
Abstract
Background:
Head and neck squamous cell carcinoma (HNSCC) is one of the most common malignant tumors. The purpose of this study was to establish and validate a gene-expression-based prognostic signature in non-metastatic patients with HNSCC.
Materials and methods:
All the patients were retrieved from The Cancer Genome Atlas (TCGA) and Gene Expression Omnibus (GEO) databases. We randomly divided the GSE65858 samples into 70% (training cohort, n = 190) and 30% (internal validation cohort, n = 72). A total of 36 samples collected from the TCGA HNSCC databases were selected as an independent external validation cohort. The oligo package in R was used to normalize the raw data before analysis. Data characteristics were extracted, and a gene signature was built via the least absolute shrinkage and selection operator regression model. The predictive model was developed by multivariable Cox regression analysis. T stage, N stage, human papilloma virus status, and the gene signature were incorporated in this predictive model, which was shown as a nomogram. Calibration and discrimination were performed to assess the performance of the nomogram. The clinical utility of this nomogram was assessed by the decision curve analysis.
Results:
Overall, 2001 significant messenger RNAs in HNSCC samples were identified compared with normal samples. The gene signature contained seven genes and significantly correlated with overall survival. The gene signature was also significant in subgroup analysis of the primary cohort. The calibration was plotted in the external cohort (C-index 0.90, 95% CI 0.85, 0.95) compared with the training (C-index 0.76, 95% CI 0.73, 0.79) and internal (C-index 0.71, 95% CI 0.66, 0.77) cohorts. In clinic, a decision curve analysis demonstrated that the model including the prognostic gene signature score status was better than that without it.
Conclusion:
This study developed and validated a predictive model, which can promote the individualized prediction of overall survival in non-metastatic patients with HNSCC.
Introduction
Head and neck cancer is one of the most common malignant tumors around world and ranks 11th in terms of cancer-related deaths. 1 Head and neck squamous cell carcinoma (HNSCC) accounts for 90%–95% of head and neck cancer cases, with >500,000 new cases and >350,000 deaths worldwide each year. A key feature of HNSCC is the high rate of metastases, especially to lymph nodes. Indeed, by the time of diagnosis, nearly half of the patients with HNSCC have progressed. The tumor in most patients has metastasized to the lymph nodes. The 5-year survival rate of patients with HNSCC is 40%–60%, and the median survival time of individuals with advanced HNSCC is 6–9 months.2-4 Data from clinical trials indicate that patients with human papilloma virus (HPV)-associated cancer respond better to all treatments than the HPV-negative counterparts, with a longer survival time.5,6。The 3-year survival rate of HPV-related cancer patients is 75%, while that of HPV-negative patients is below 50%. 6
Traditional prognostic models incorporate clinical and pathological parameters as independent risk factors.7,8 However, many studies have demonstrated that gene expression also represents one of the most important factors affecting prognosis.9-11 Therefore, identifying further potential HNSCC biomarkers using many open databases of gene expression data is critical. Hence, genomic and clinical factors were combined to build a nomogram model, which can predict the survival rate of non-metastasized HNSCC patients in 1 to 2 years. The prediction helps doctors better understand the nature of the illness, and focus on the appropriate treatment in accordance to findings. Patients could be better treated according to their own conditions, rationally allocating medical resources. The ultimate goal is to clinically treat HNSCC and provide evidence for the overall survival rate of HNSCC patients.
Methods
Patient information collection and study design
All HNSCC patients were collected from The Cancer Genome Atlas (TCGA) database (http://tcga-data.nci.nih.gov/tcga) on 1 September 2018 and GSE65858 database (https://www.ncbi.nlm.nih.gov/geo/query/acc.cgi?acc=GSE65858). All included samples met the following criteria: (a) patients with messenger RNA (mRNA) expression data and clinical data were selected; (b) patients with stage M0 were selected; (c) survival time of patients was more than 10 days. There were 262 samples with M0 for the final analysis from the GSE65858 database, and 36 samples were obtained from TCGA HNSCC database. We randomly divided the GSE65858 samples into 70% (training cohorts, n = 190) and 30% (internal validation cohorts, n = 72). The 36 samples collected from TCGA HNSCC database were selected as independent external validation cohorts. The platform of mRNA expression analysis of the training cohort and the internal validation cohort was Illumina HumanHT-12 V4.0 Expression BeadChip (GPL10558). The mRNA expression analysis of external validation was performed on the Illumina HiSeq RNASeq V2 platform. All of the patients were evaluated based on the 6th edition of the American Joint Committee on Cancer Staging Manual. 12 No patients received anti-cancer treatment prior to biopsy sampling.
Differentially expressed analysis
Oligo package in R to normalize the raw data collected from TCGA HNSCC database for data processing. Empirical Bayes (eBays) in the limma package 13 was applied to identify significantly differentially expressed genes between normal tissues and HNSCC tissues. The thresholds we chose were |log2foldChange(FC)|>2.0 and adjusted P value < 0.05.
Features selection and prognostic gene signature
The least absolute shrinkage and selection operator (LASSO) is a dimensionality reduction algorithm that can better analyze high-dimensional data compared to regression analysis. 14 The bootstrap algorithm is suitable for evaluating the robustness of genes screened by LASSO.
We constructed the prediction model by the Cox model in the training cohort. 15 We found the optimal cutoff value through the pROC package in R software. 16 The prognostic gene signature (PGS) score for non-metastatic HNSCC was separated by the optimal cutoff value into high-risk and low-risk groups.
Development of an individualized prediction model
One- and two-year overall survival (OS) were our main research endpoints. The OS and hazard ratios (HRs) were calculated by the Kaplan–Meier algorithm and univariate Cox regression analysis, respectively. The log-rank method tested the differences between the survival curves. The PGS score as a predictor for non-metastatic HNSCC patients was analyzed in the training, internal, and external cohorts. We discovered the significant variables through the univariate Cox regression analysis. Candidate variables with P < 0.2 on univariate analysis were included in the multivariable model. Finally, the multivariable Cox regression model began with the candidate predictors as follows: sex, tobacco, alcohol, age, T stage, N stage, HPV status, and PGS score. The nomograms we developed by rms package included age, T stage, N stage, HPV status, and PGS score. The nomogram model was built by the coefficients of the multivariable Cox regression model. P values < 0.05 were considered significant.
Performance of the nomogram in the training cohort
Calibration curves and Hosmer-Lemeshow test 17 were used to assess the calibration of the nomogram. Harrell’s C-index was calculated via a bootstrap method with 1000 resamples to quantify the discrimination performance of this nomogram. In practical applications, it is difficult to find a completely consistent prediction model. The C-index standard is as follows: C-index is lower accuracy from 0.50 to 0.70; medium accuracy is between 0.71 and 0.90; high accuracy is above 0.90.
Clinical use
The R-script decision curve analysis for survival data (STDCA) (http://www.mskcc.org/research/epidemiology-biostatis-tics/health-outcomes/decision-cure-analysis) was used for the decision curve analysis (DCA), which can assess the clinical net benefit of different probability thresholds. 18
Comparison of prognostic models
To better showcase the reliable performance of the PGS score within the prognostic model, we designed a new model excluding the PGS score and compared it with the DCA curve and the C-index.
Results
Patient characteristics
A total of 262 patients with non-metastatic HNSCC were included in the current analysis. Patient characteristics in the training, internal validation, and external validation cohorts are shown in Table S1, which lists the numbers of patients in the training cohort (GSE65858, n=190), the internal validation cohort (GSE65858, n=72), and the external validation cohort (TCGA HNSCC, n=36). Median follow-up times were 864 days (interquartile range (IQR) 604.5–1139.5) in the training cohort, 799.5 days (IQR 606.5–1056.5) in the internal validation cohort, and 440 days (IQR 377.5–901) in the external validation cohort.
Identification of gene signature
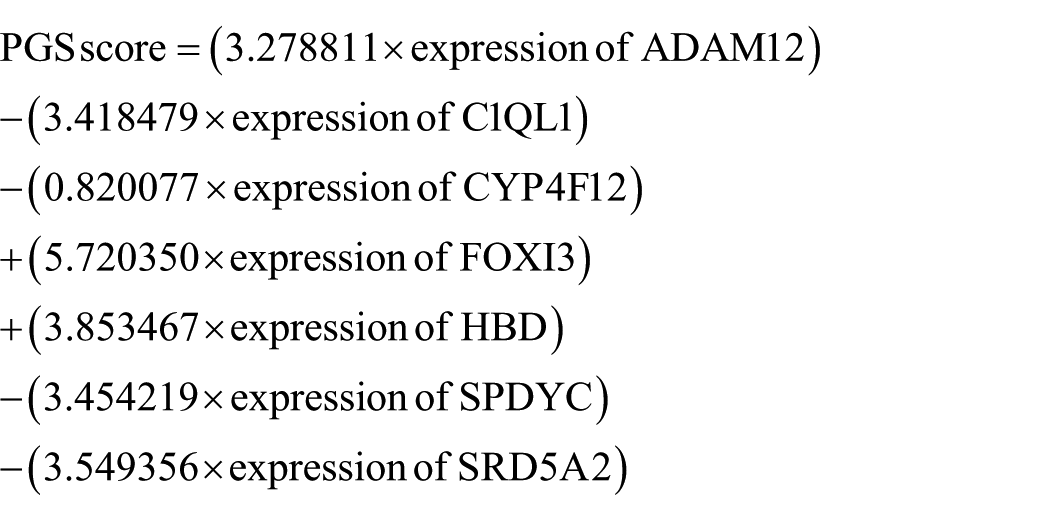
The mRNA expression profiles and clinical information of HNSCC patients were downloaded from the TCGA database. We identified 2001 differentially expressed mRNAs in HNSCC samples using the “DESeq” package in R (Figure 1). In the LASSO analysis, a gene signature consisting of seven genes was associated with OS in the training cohort (Figure 2(a) to (d), Table S2). The formula of the PGS score consisted of the expression levels of these seven genes and their regression coefficients:
An optimal cutoff value was selected to separate patients into low-risk and high-risk groups using the pROC package in R in primary, training, and internal cohorts. In the primary cohort, 131 of 262 patients were assigned to the high-risk group and 131 to the low-risk group. Figure 3(a) shows that patients in the low-risk group had longer OS (P < 0.0001) than those in the high-risk group. In the training cohort, 92 of 190 patients belonged to the high-risk group and 98 to the low-risk group. Figure 3(b) shows that patients in the low-risk group had longer OS (P < 0.0001) than those in the high-risk group. In the internal validation cohort, the optimal cutoff value was 15.3085, and 39 of 72 patients belonged to the high-risk group and 33 to the low-risk group. Figure 3(c) shows that patients in the low-risk group also had longer OS (P = 0.048). In the external cohort, 28 of 36 patients were assigned to the high-risk group and 8 to the low-risk group. Figure 3(d) shows that patients in the low-risk group had longer OS (P < 0.0001) than those of the high-risk group.
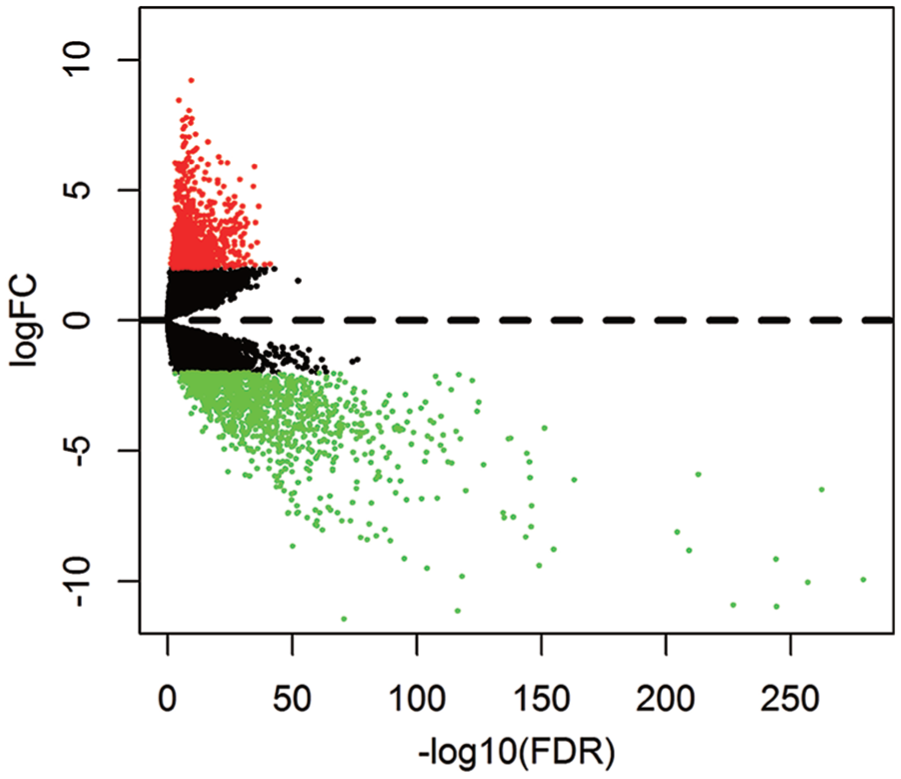
Volcano plot for the aberrantly expressed mRNA between HNSCC and para-tumorous. Red dots indicate the high expression and the green dots indicate the low expression of mRNAs. Black dots show the mRNAs with expression of |log2FC|<2. The X axis represents an adjusted FDR and the Y axis represents the value of log2FC. Aberrantly expressed mRNAs were calculated by DESeq R. Altogether, 873 high and 1128 low expressed mRNAs were achieved. This volcano plot was conducted by the ggplot2 package of R language.
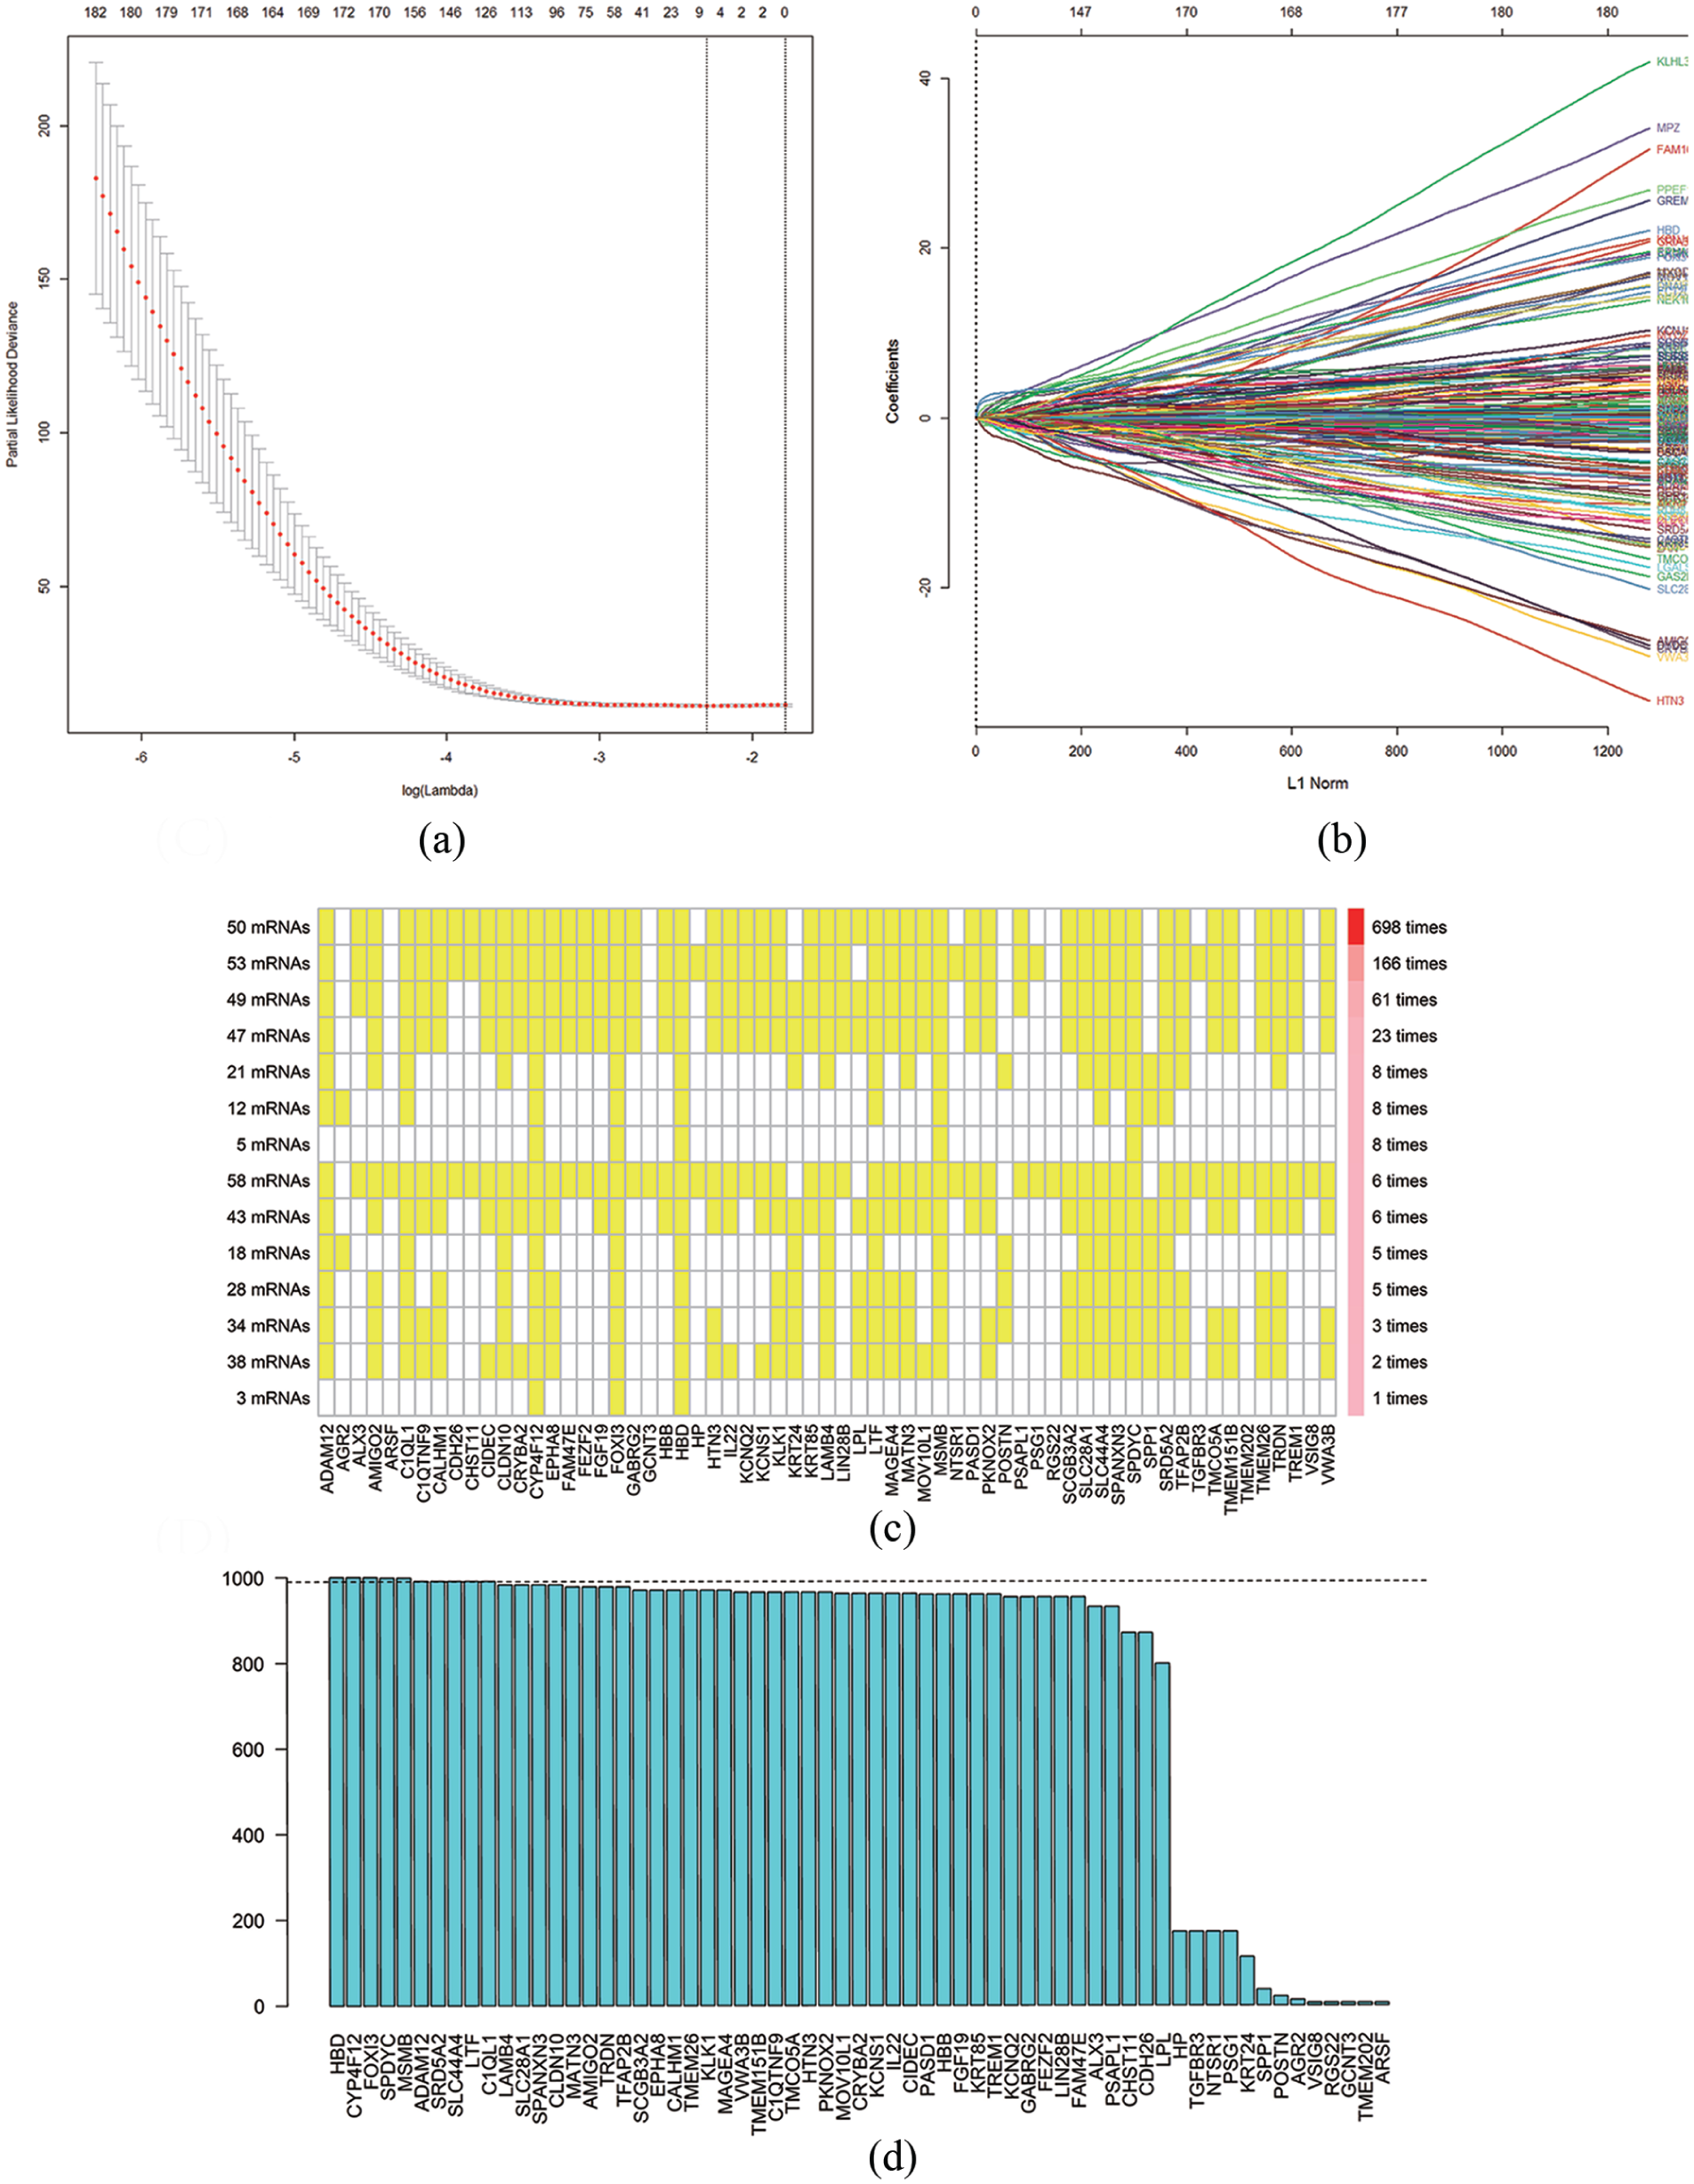
Texture feature selection using the least absolute shrinkage and selection operator (LASSO) Cox regression model. (a) Tuning parameter (λ) selection in the LASSO model used 10-fold cross-validation via minimum criteria. The area under the receiver operating characteristic (AUC) curve was plotted versus log(λ). Dotted vertical lines were drawn at the optimal values by using the minimum criteria. (b) LASSO coefficient profiles of the 2001 texture features. A coefficient profile plot was produced against the log(λ) sequence. A vertical line was drawn at the value selected using 10-fold cross-validation. (c) High consistency was demonstrated in the mRNAs among the 14 extracted mRNA sets. The left ordinate indicates the seed mRNA set and the number of seed mRNAs found by every single iteration of LASSO. The right ordinate is the frequency of the seed mRNA set disclosed through the 1000 times Cox LASSO regression. The horizontal ordinate is the mRNA name. The yellow block represents the occurrence of the particular mRNA in the specific mRNA set. (d) A total of 10 seed mRNAs with >990 occurrences in the most common mRNA set were filtered out for further analysis. The blue column indicates the frequency of each mRNA occurring in the most common mRNA set.
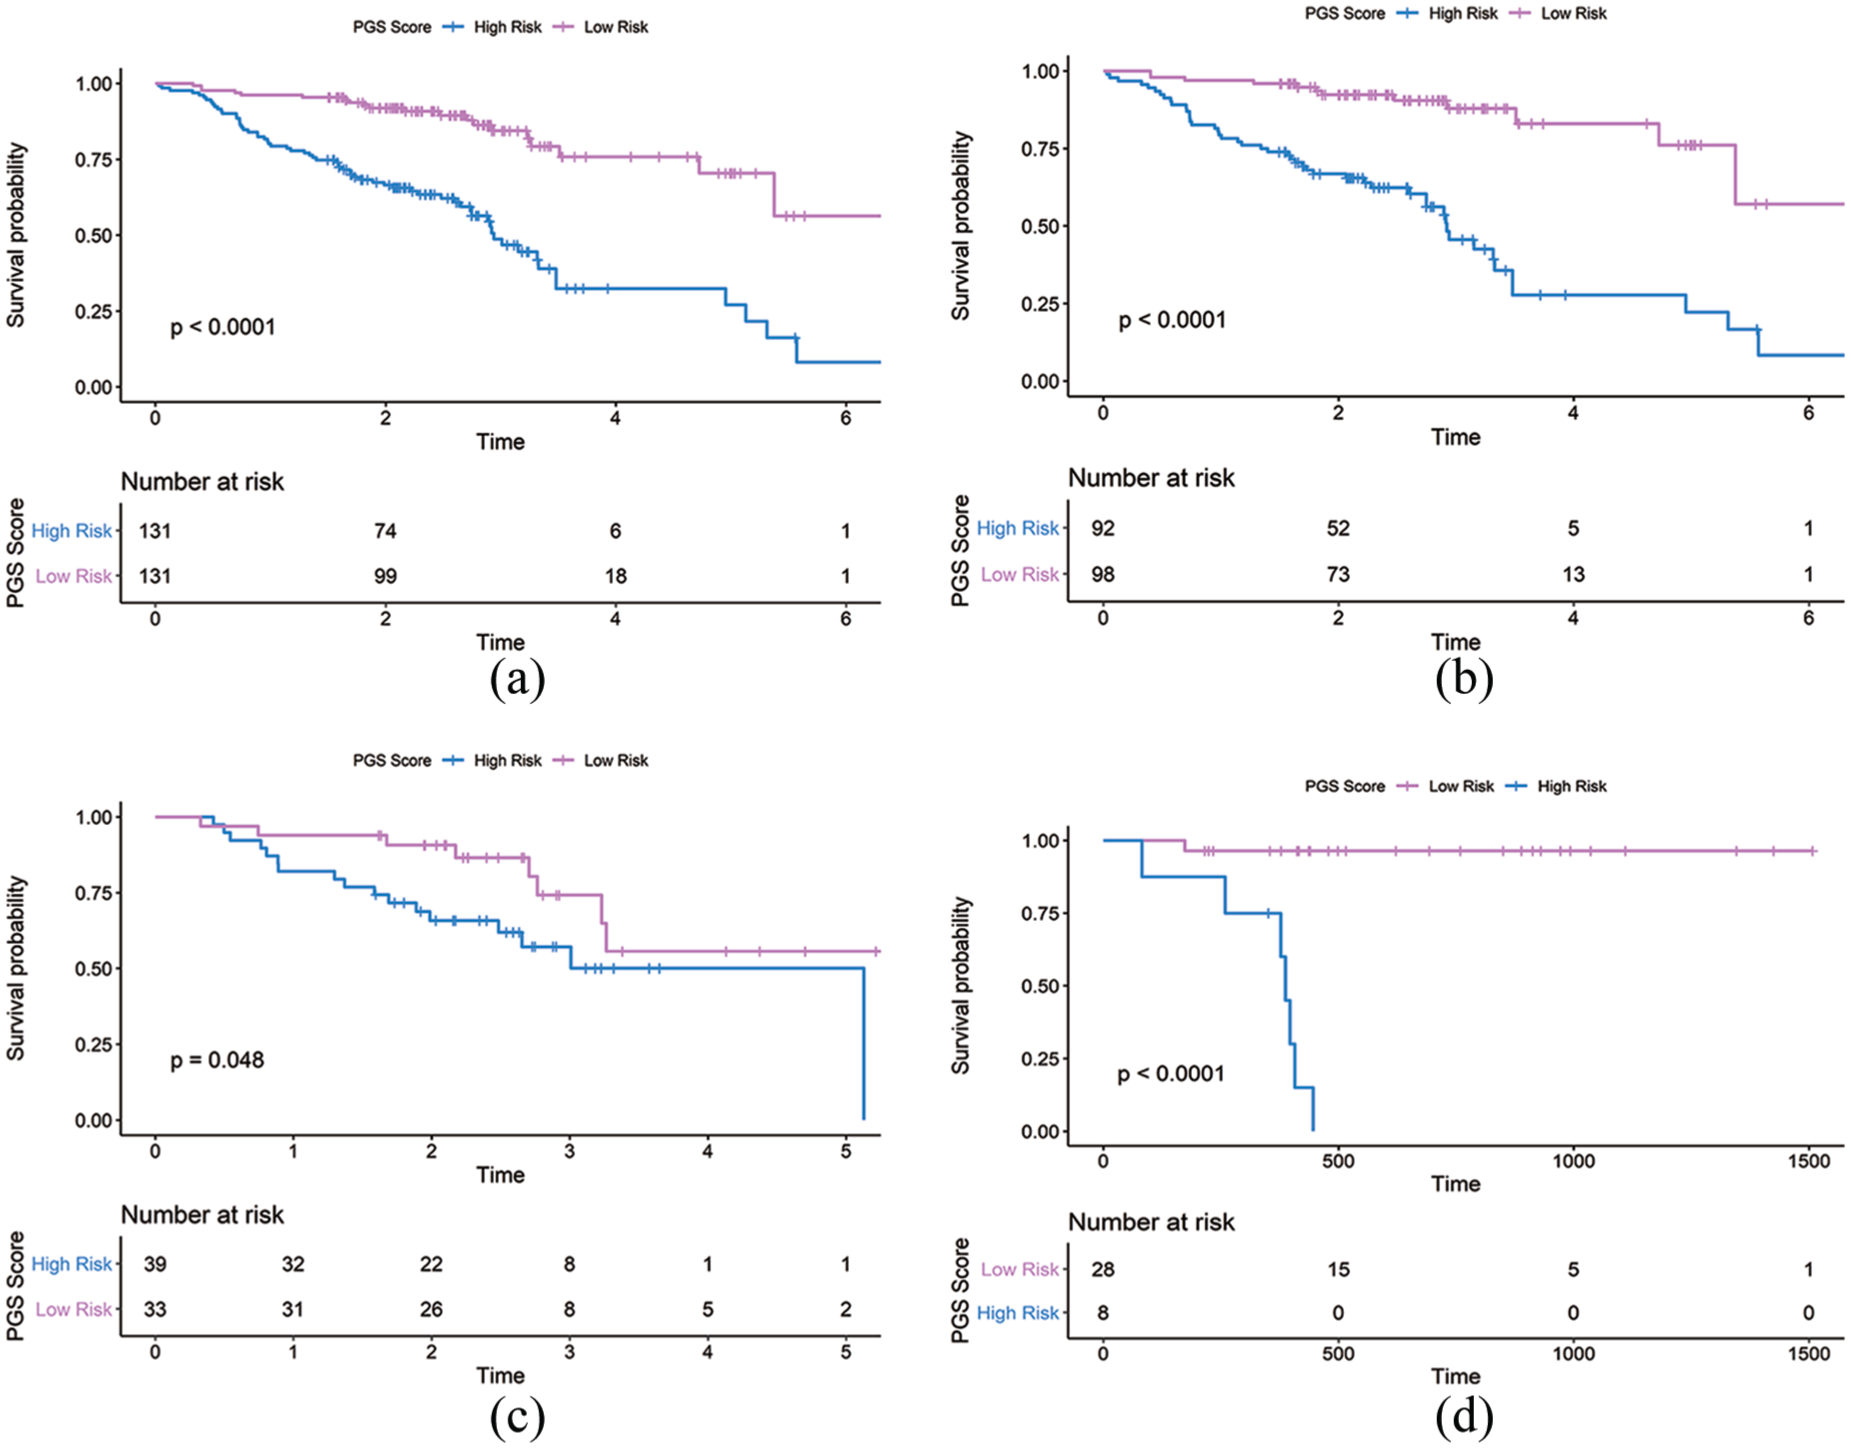
Kaplan-Meier curves of overall survival according to the PGS Score. (a) Primary cohort (n=262). (b) Training cohort (n=190). (c) Internal validation cohort (n=72). (d) External validation cohort (n=36).
Characteristics of the gene signature in clinical subgroups
Figure 4 shows univariate analysis of OS by clinical subgroup in the training cohort. Different categories were analyzed for age, sex, smoking, alcohol, T category, N category, and HPV status. The result showed that the PGS score was significantly associated with OS in all but three subgroups (age ⩾ 60, non-smokers and HPV status positive).
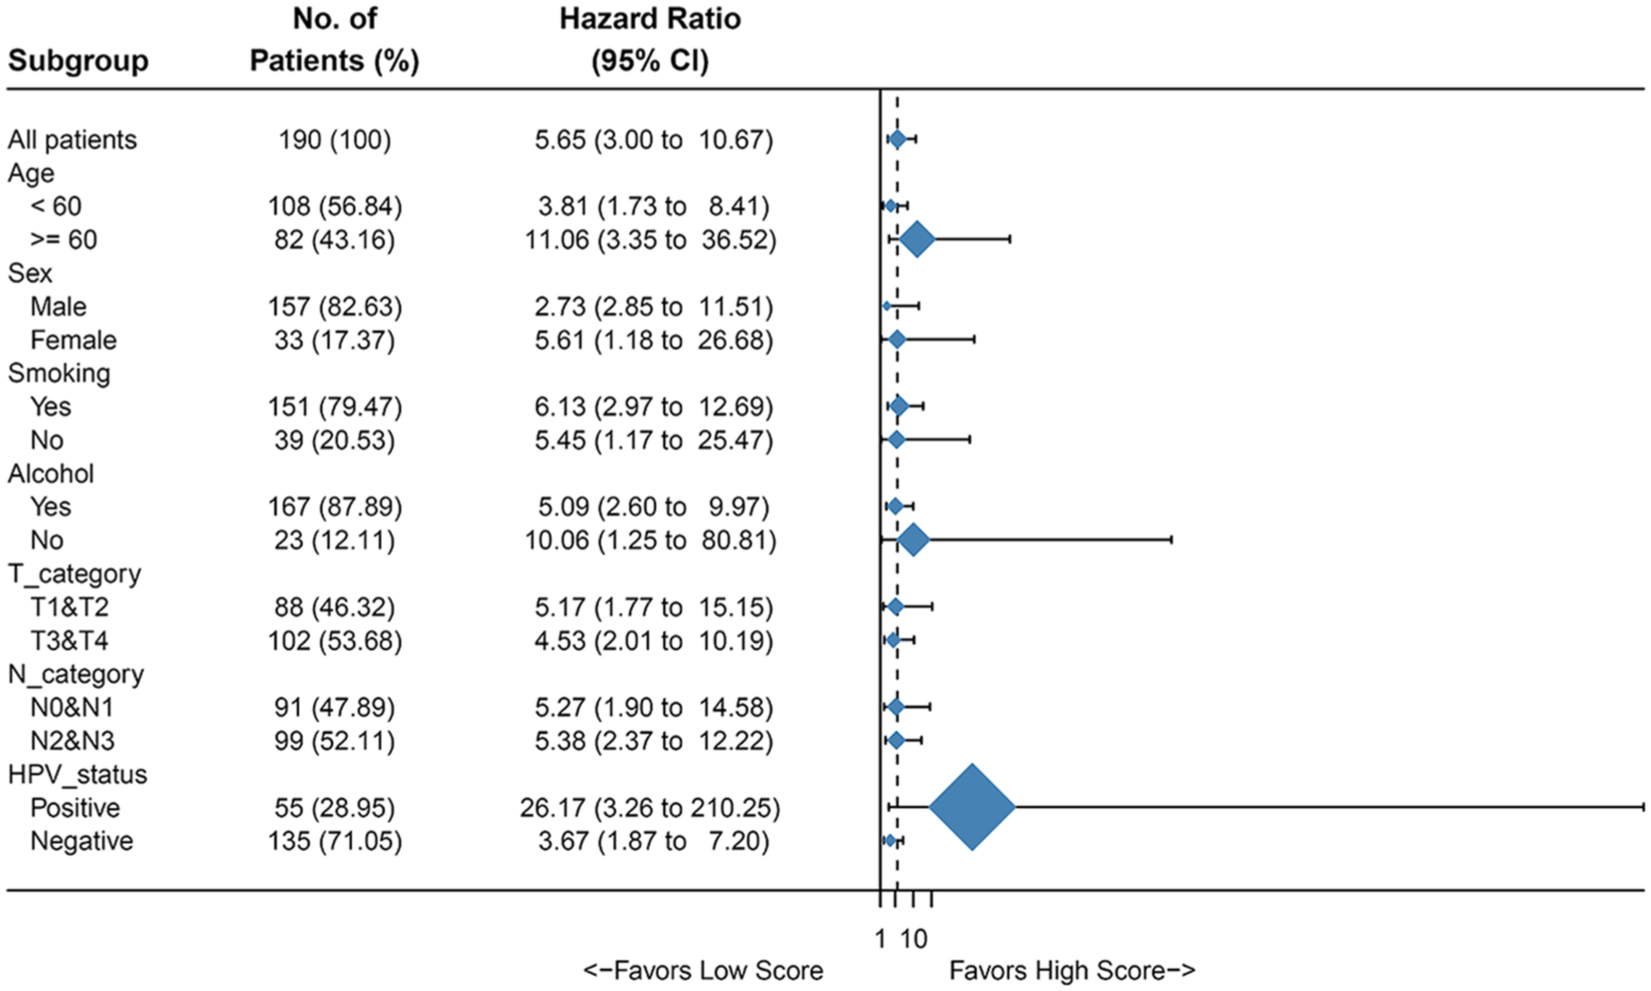
Univariate association of PGS and clinicopathological characteristics with non-metastatic HNSCC in training cohort. HR: hazard ratio; PGS: prognostic gene signature.
Development of a gene signature prediction model
Univariate and multivariate regression analyses were performed with PGS score, sex, age, smoking, alcohol, T category, N category, and HPV status as independent predictors. Factors with P < 0.2 in the univariate Cox analysis were included in the multivariate Cox analysis (Table S3). The prediction model was developed with independent predictors that included PGS score, T category, N category, and HPV status (Table S4). The model was then also presented as a nomogram (Figure 5(a)).
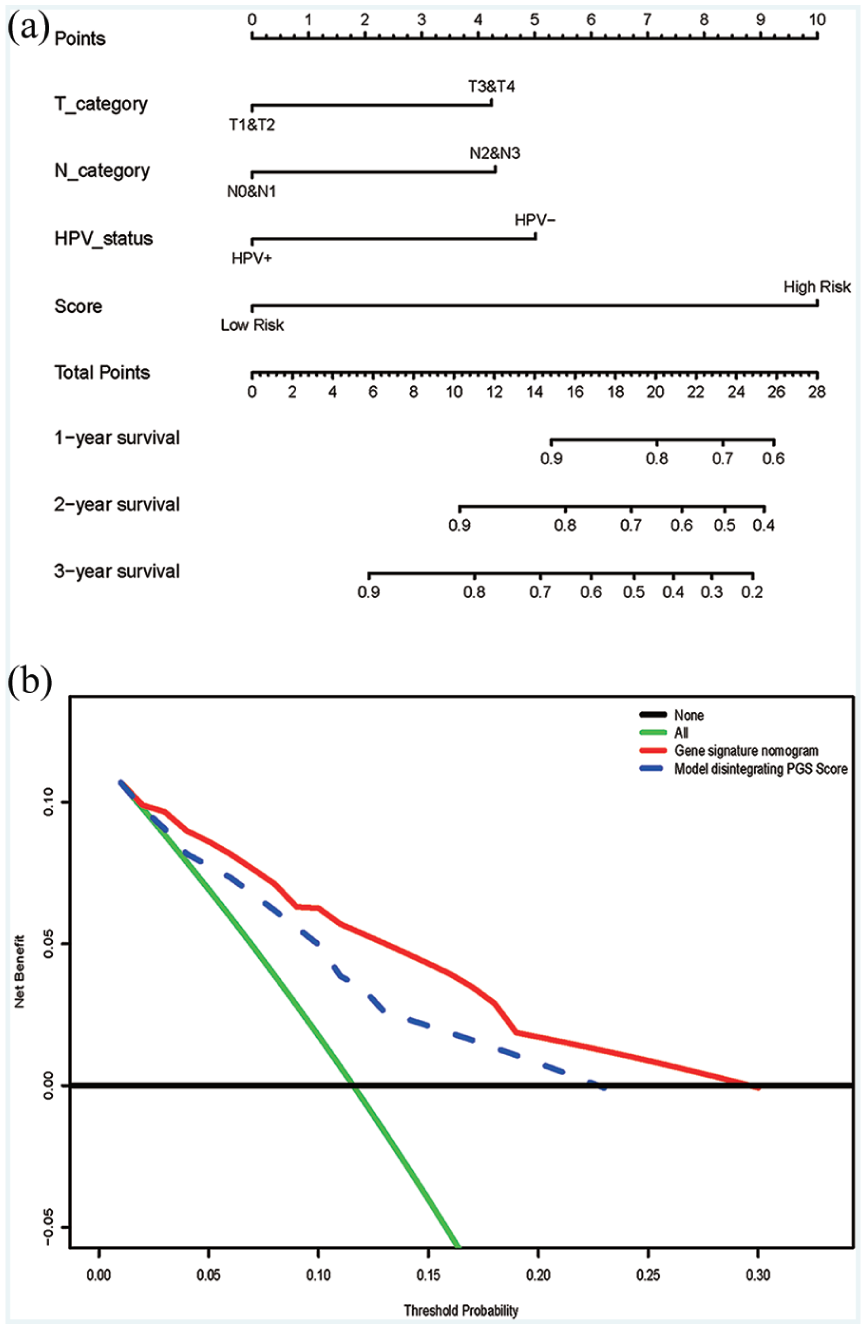
Prognostic model and DCA analysis. (a) Nomogram plot for patients with non-metastatic head and neck squamous cell carcinoma. (b) Decision curve analysis for the genetic nomogram.
Calibration of the prediction model in the training and validation cohort
Calibration in the external cohort (C-index 0.90, 95% CI 0.85, 0.95) was better than those of the training cohort (C-index 0.76, 95% CI 0.73, 0.79) and the internal cohort (C-index 0.71, 95% CI 0.66, 0.77). The calibration curve for 1- and 2-year OS of patients with non-metastatic HNSCC are shown in Figure S1.
Selection of an individualized prediction model
The prognostic model without a PGS score is shown in Table S4. It is conclusive that the C-index of the model without a PGS score in the training cohort was 0.70, 95% CI 0.66, 0.73. However, we found that the model with a PGS score had a higher C-index (0.76, 95% CI 0.73, 0.79) than the model without a PGS Score.
Clinical use
Figure 5(b) shows the DCA for the prognostic prediction model and the model without a PGS score. The results showed that using the prognostic prediction model with a PGS score to predict OS of non-metastatic patients could yield increased net benefit through the novel model than the treat-all-patients or treat-none scheme. Comparing this model without HPV status, the prognostic prediction model with a PGS score could benefit the patients more.
Discussion
Clinicians who treat head and neck cancer use specific disease sites, tumor stages, and pathological results to help guide the treatment options (i.e. appropriate surgical procedures; radiological targets, doses, and fractions; and indications for chemotherapy). 5 Surgery and radiotherapy are the most common treatments for early HNSCC; there are multiple treatments for advanced HNSCC. 18 For about 30%–40% of patients with stage I or II, a single operation or radiation therapy (RT) is usually recommended. 5 For about 60% of patients diagnosed with locally or regionally advanced disease, multimodal treatment is recommended, which is usually surgery followed by adjuvant radiotherapy or chemotherapy. 5 Previous studies have reported the 5-year survival rate of patients with HNSCC to be from 40% to 60%. Because accurate diagnosis is very difficult, identifying reliable prognostic biomarkers to distinguish patients at high risk is urgently required. A novel prognostic mode based on the expression profiles of seven genes was developed by our group to predict the OS of non-metastatic patients with HNSCC.
By the LASSO algorithm, 2001 uniquely expressed genes were reduced to seven potential predictors after examination. This method combines potential predictors into a gene expression signature; Kaplan–Meier analysis was conducted on the PGS score in the training, internal validation, Únd external validation cohorts.
The results showed that PGS was an independent prognostic factor in patients with non-metastatic HNSCC. The prediction model was developed using independent predictors, which included the PGS score, T category, N category, and HPV status. The results revealed that the discrimination of the internal validation cohort was slightly lower than that of the training cohort, while the discrimination of the external verification cohort was larger than that of the training cohort. This implies that the prediction model was comprehensively developed to predict 1- and 2-year OS in patients with non-metastatic HNSCC and is applicable to the validation cohort.
HPV status is an important prognostic factor, even though it was not an independent risk factor for HNSCC as assessed by the Cox regression analysis. However, this may be due to an insufficient sample size. Meanwhile, the single-factor regression coefficient of HPV status of less than 0.2 was included in the multivariate Cox regression analysis, and the results showed that HPV status was indeed a factor associated with the prognosis of HNSCC patients, which corroborates with previous studies.19-21 Thus, the HPV status was incorporated into the model.
Since cancer is a very complex disease, elevated or decreased gene expression levels may affect cancer occurrence and metastasis. Therefore, it is necessary to assess the expression profiles of genes in cancer tissues. In this study, we identified seven genes that predict the OS of non-metastatic patients with HNSCC. Among these genes, FOXI3 plays a key role in epithelial–mesenchymal transition (EMT).22-24 Indeed, studies have shown that FOXI3 can affect tumor metastasis and drug resistance by regulating developmental characteristics, including stem cell maintenance and EMT.25-27 Previous reports demonstrated that apart from speedy/RINGO cell cycle regulator family member C (SPDYC), the seven other mRNAs included in the PGS model have been positively linked to cancer. However, the cancer-causing mechanism is unclear, and the number of available studies is too few. In recent years, reports on ADAM12 in healthy individuals display low to medium expression levels, with overexpression in HNSCC patients. ADAM12 and human epidermal growth factor receptor 2 (HER2) amounts show a positive correlation, and HER2 overexpression causes tumor invasion and metastasis, lowering the overall survival rate of HNSCC patients. 28 The model also predicted that overexpression of ADAM12 was correlated with poor prognosis. C1QL1 alteration was not found within HNSCC, but this gene represents a significant prognostic biomarker of thyroid and colon cancers.29,30 Previous findings indicate hepatocellular carcinoma (HCC) patients with good OS overexpress CYP4F12. 31 Although CYP4F12 was not altered in HNSCC, the protective role of CYP4F12 was similar to that found in HCC. SRD5A2 encodes steroid 5-α-reductase 2 that converts testosterone to the more potent androgen receptor agonist dihydrotestosterone. 32 SRD5A2 predicts OS in patients with pancreatic cancer, and lower SRD5A2 transcript abundance has previously been associated with a poor or favorable outcome. This is in accordance with our published test results. Therefore, the PGS score developed here could represent a good prognostic factor in non-metastatic patients with HNSCC. The nomogram developed in this study could predict the OS of patients and identify those requiring additional medical attention. However, good discrimination and calibration are not enough to prove that patients can benefit from this model in clinical practice.33-35 So we used clinical decision analysis to assess whether the model could improve the outcome of patients.33,36 The DCA demonstrated that patients could benefit more from the current model than the treat-all-patients or treat-none scheme.
This study built and validated a reliable model for predicting OS of non-metastatic patients with HNSCC even though there are still many limitations. First, although next-generation sequencing has emerged and has provided new perspectives for cancer research at the molecular level, it is difficult to collect good quality data from patients. Second, there are many methods of bioinformatics, and different research teams may come to discrepant conclusions when analyzing the same dataset. Third, this study included samples from two open databases; that is, TCGA and GEO. Due to the limitation of the sample size, the extrapolation of this model requires additional clinical data for confirmation. In this study, a nomogram comprising a PGS score would help clinicians make a correct estimation of the condition of patients with non-metastatic HNSCC. More patients and independent prognostic factors will be considered in a future model when additional HNSCC data can be gathered.
Supplemental Material
Supplemental_Material – Supplemental material for A nomogram based on a gene signature for predicting the prognosis of patients with head and neck squamous cell carcinoma
Supplemental material, Supplemental_Material for A nomogram based on a gene signature for predicting the prognosis of patients with head and neck squamous cell carcinoma by Bowen Yang, Lingyu Fu, Shan Xu, Jiawen Xiao, Zhi Li and Yunpeng Liu in The International Journal of Biological Markers
Footnotes
Declaration of conflicting interest
The author(s) declared no potential conflicts of interest with respect to the research, authorship, and/or publication of this article.
Funding
The author(s) disclosed receipt of the following financial support for the research, authorship, and/or publication of this article: This work was supported by the National Science and Technology Major Project of the Ministry of Science and Technology of China (No. 2017ZX09304025); Science and Technology Plan Project of Liaoning Province (No. 2016007010); and The General Projects of Liaoning Province Colleges and Universities (LFWK201706).
Supplemental Material
Supplemental material for this article is available online.
References
Supplementary Material
Please find the following supplemental material available below.
For Open Access articles published under a Creative Commons License, all supplemental material carries the same license as the article it is associated with.
For non-Open Access articles published, all supplemental material carries a non-exclusive license, and permission requests for re-use of supplemental material or any part of supplemental material shall be sent directly to the copyright owner as specified in the copyright notice associated with the article.