
Abstract
Motivation:
Although several prognostic signatures for lung adenocarcinoma (LUAD) have been developed, they are mainly based on a single-omics data set. This article aims to develop a novel set of prognostic signatures by combining genetic mutation and expression profiles of LUAD patients.
Methods:
The genetic mutation and expression profiles, together with the clinical profiles of a cohort of LUAD patients from The Cancer Genome Atlas (TCGA), were downloaded. Patients were separated into 2 groups, namely, the high-risk and low-risk groups, according to their overall survivals. Then, differential analysis was performed to determine differentially expressed genes (DEGs) and mutated genes (DMGs) in the expression and mutation profiles, respectively, between the 2 groups. Finally, a prognostic model based on the support vector machine (SVM) algorithm was developed by combining the expression values of the DEGs and the mutation times of the DMGs.
Results:
A total of 13 DEGs and 7 DMGs were recognized between the 2 groups. Their prognostic values were validated using independent cohorts. Compared with several existing signatures, the proposed prognostic signatures exhibited better prediction performance in the testing set. In addition, it is found that 1 of the 7 DMGs, GRIN2B, is mutated much more frequently in the high-risk group, showing a potential value as a therapy target.
Conclusions:
Combining multi-omics data sets is an applicable manner to identify novel prognostic signatures and to improve the prognostic prediction for LUAD, which will be heuristic to other types of cancers.
Keywords
Introduction
In China, about 3.9 million new cancer cases were reported in 2015, 1 of which lung cancer ranks the first place and accounts for nearly 20% of total cases. Lung adenocarcinoma (LUAD), a subtype of non-small cell lung carcinoma (NSCLC), accounts for 40% of all lung cancers.2,3 LUAD patients are usually diagnosed at a relatively late stage and suffer poor survivals. 4 Therefore, it is of great value to further improve the long-term survival rate of LUAD,5,6 which can be achieved by developing individual therapy based on prognostic signatures.
There have been several efforts to identify prognostic signatures for lung cancer in the genomics era since 2002.7-13 In recent years, Shukla et al 14 developed a 4-gene signature set based on the univariate Cox analysis on an LUAD cohort from The Cancer Genome Atlas (TCGA). A 20-gene-based signature set was identified from differentially expressed genes in LUAD compared with adjacent normal lung tissues in Zhao et al. 15 Chen et al 16 constructed a multistep bioinformatics analysis pipeline and identified 27 genes that are significantly related to overall survival in LUAD patients. Songyang et al 17 identified a set of robust prognostic signatures containing 25 genes by the meta-analysis-based Cox analysis on 10 gene expression data sets. However, these studies are all based on single-omics data set, namely, genetic expression data set. As the multi-omics data sets of lung cancer are available in TCGA, it is possible to explore prognostic signatures by integrating different types of omics data sets. In some applications of machine learning, combining different types of features will result in better prediction performance. 18
The patterns of the somatic mutations in NSCLC have been extensively studied to reveal mutation characteristics from different aspects, such as the distinct genetic mutations in LUAD and other subtypes of NSCLC, 19 in different races with LUAD,20,21 in younger patients compared with elderly,22,23 and in never-smoking patients.24-26 Thus, it is necessary to identify prognostic signatures from the mutation profiles of LUAD patients. Till to now, there have been several studies that try to combine genetic expression and mutation profiles to improve the outcome prediction of some diseases, including myelodysplastic syndromes. 27 To our knowledge, the study by Song et al 28 is the first trail of survival prediction of LUAD by integrating genetic mutation and expression profiles. It has been verified that the predictive accuracy was improved by the contributions of genetic mutations.
In this article, a novel set of prognostic signatures of LUAD was identified by integrating genetic mutation and expression profiles. An LUAD cohort from TCGA was downloaded and used to identify prognostic signatures. The patients of the cohort were separated into the high-risk and low-risk groups according to their overall survivals. Differential analysis between the 2 groups produced 20 prognostic genes, including 13 differentially expressed genes (DEGs) and 7 differentially mutated genes (DMGs). A prognostic model based on the support vector machine (SVM) algorithm was then built by combining the expression values of the DEGs and the mutation times of the DMGs. When training the prognostic model, the 10-fold cross-validation strategy was used to find the optimal hyper-parameters. The validation results in the testing set have showed that the identified prognostic signatures are effective for the stratification of LUAD samples, and the prediction performance has been improved by the contributions of the DMGs. The main contribution of this article is the identification of DMGs between the high-risk and low-risk groups, and the combination of the features of the DEGs and DMGs, which can be applied to the survival prediction of other types of cancers.
Materials and Methods
The pipeline of the proposed method is showed in Figure 1. First, 272 samples of the TCGA LUAD cohort were selected according to the overall survival and were partitioned into the training set and testing set. Then, DEGs and DMGs were determined from the training set, and the features of them were combined to train a prognostic model based on the SVM algorithm. The 10-fold cross validation was used to find the best hyper-parameters. Finally, this model was used to stratify the samples in the testing set to evaluate its performance.

Pipeline of the proposed method.
Data collection and grouping
A cohort of LUAD from TCGA was used in this article. The genetic mutation and expression profiles, and their corresponding clinical profiles, were downloaded on October 2019, including 522 samples. 29 Table 1 lists the clinical information of them. The overall survival is the only considered factor to group these samples into 3 subgroups. A total of 137 samples were partitioned into the low-risk group as their overall survivals are larger than 36 months. For the high-risk group, a more rigorous standard was used, and a sample was determined to be high risk if its vital status is dead and its overall survival is less than 36 months; 135 patients were grouped into the high-risk group. The remaining samples were classified into the unknown group as the days to last follow-up are less than 36 months and the vital status was alive; their exact overall survivals cannot be determined. Totally, 272 of 522 samples were selected and randomly separated into the training set (75%) and testing set (25%). The training set contains 200 samples, comprising 100 high-risk and 100 low-risk samples, respectively. The remaining samples were used as the testing set. The training set was used to identify the prognostic signatures and to build the prognostic model, and the testing set was used to evaluate them.
Clinical information of 522 LUAD samples from TCGA.

Abbreviations: LUAD, lung adenocarcinoma; TCGA, The Cancer Genome Atlas.
Identification of differentially expressed genes
GDCRNATools 30 was used to identify the DEGs in the high-risk samples compared with the low-risk samples. The profiles of message RNA (mRNA) were used for this analysis. The gdcDEAnalysis function of GDCRNATools with the limma method selected was used to determine the DEGs. The criteria are false discovery rate (FDR)-adjusted P value <.05 and the absolute value of log2-based fold change >1.
Identification of differentially mutated genes
The MafCompare function in Maftools package 31 was used to detect the DMGs between the high-risk and low-risk samples. The parameter “minMut” was set to be 10, meaning that the number of samples with a DMG mutated in one group must be at least 10 more than that in another group.
External validation of the DEGs and DMGs
The prognostic values of the DEGs and DMGs were validated by Kaplan-Meier (KM) plot 32 and International Cancer Genome Consortium (ICGA) Data Portal (https://dcc.icgc.org/), respectively. When using KM plot, the Jetset was used to select the optimal probe set for each prognostic gene.
Prognostic prediction model
First, a feature matrix was established by combining the features of the DEGs and DMGs. The expression values of the DEGs and the mutation times of the DMGs of all the samples in the training set were integrated as a combined feature matrix. The risk of a sample was used as its label.
Then, a prognostic model based on the SVM algorithm was built; the principle of the SVM algorithm can be found in Maldonado et al. 33 The feature matrix and the labels of the training set were inputted into the SVM model. The 10-fold cross validation was used to determine the optimal hyper-parameters. In this article, the e1071 package in R was used to build and train this model.
Results
Differentially expressed genes
By performing the gdcDEAnalysis function with defined criteria in the GDCRNATools package, 5 13 DEGs were identified and are listed in Table 2 and Supplementary File 1. Among these genes, FAM83A-AS1 and AC005077.4 belong to long noncoding RNA and pseudogene, respectively, and the rest are protein-coding genes, as depicted in Figure 2A. Three DEGs, SFTA3, KLRG2, and BMP5, are downregulated in the high-risk samples compared with the low-risk samples, while other 10 genes are all upregulated, as depicted in Figure 2B.
Information of identified DEGs (sorted by the value of logFC).
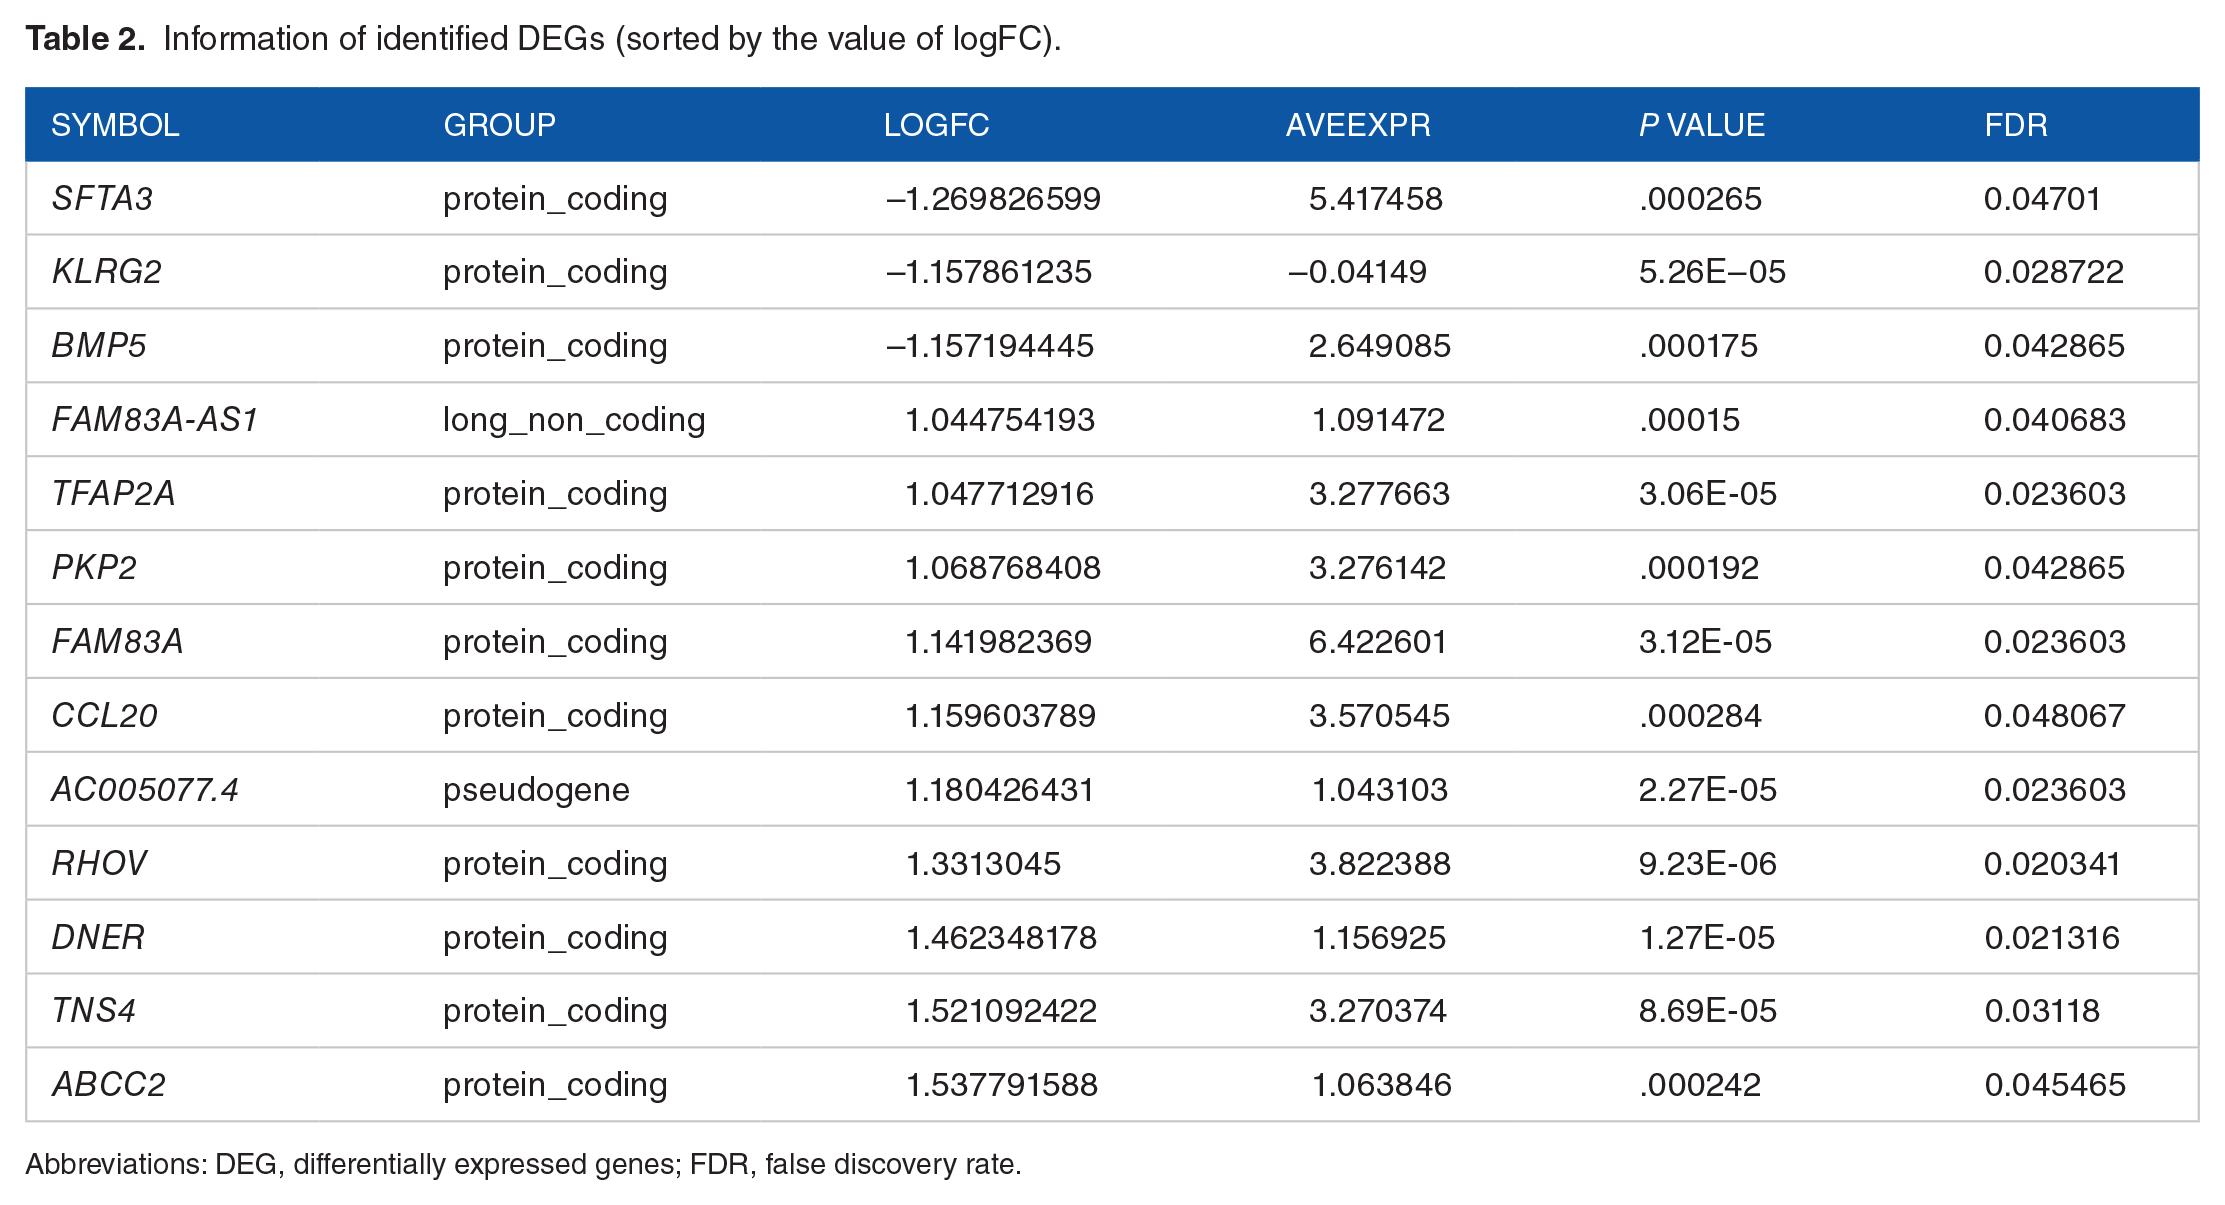
Abbreviations: DEG, differentially expressed genes; FDR, false discovery rate.

(A) Bar plot of identified DEGs and (B) volcanic plot of identified DEGs, in which FDR represents FDR-adjusted P values.
Differentially mutated genes
By performing the MafCompare function in the Maftools package, 31 7 DMGs were identified and are listed in Supplementary File 1. Three samples in the training set do not contain genetic mutation profiles, so 0197 samples were included in this analysis. Figures 3 and 4 depict the forest and co-onco plots of the DMGs. Six DMGs are mutated more frequently in the low-risk samples. One gene, GRIN2B, is mutated in 19% of the high-risk samples, while only 6% of the low-risk samples have mutations of this gene. The locations of the somatic mutations of the DMGs are showed in Supplemental Figure S1 to S7.

Forest plot of 7 DMGs.

Co-oncoplot of 7 DMGs.
The expression levels of the DMGs between patients in the high-risk and low-risk groups were then analyzed, as showed in Figure 5. Based on the P values of the DMGs, there are not significant differences between the 2 groups. However, it is found that the mutations of DMXL1, FAT2, GRIN2B, and THSD7A may impact their mRNA levels because their P values are smaller than that of other genes. Compared with the expression levels of the high-risk samples, DMXL1 and FAT2 are downregulated in the low-risk samples with them mutated, while THSD7A is upregulated.
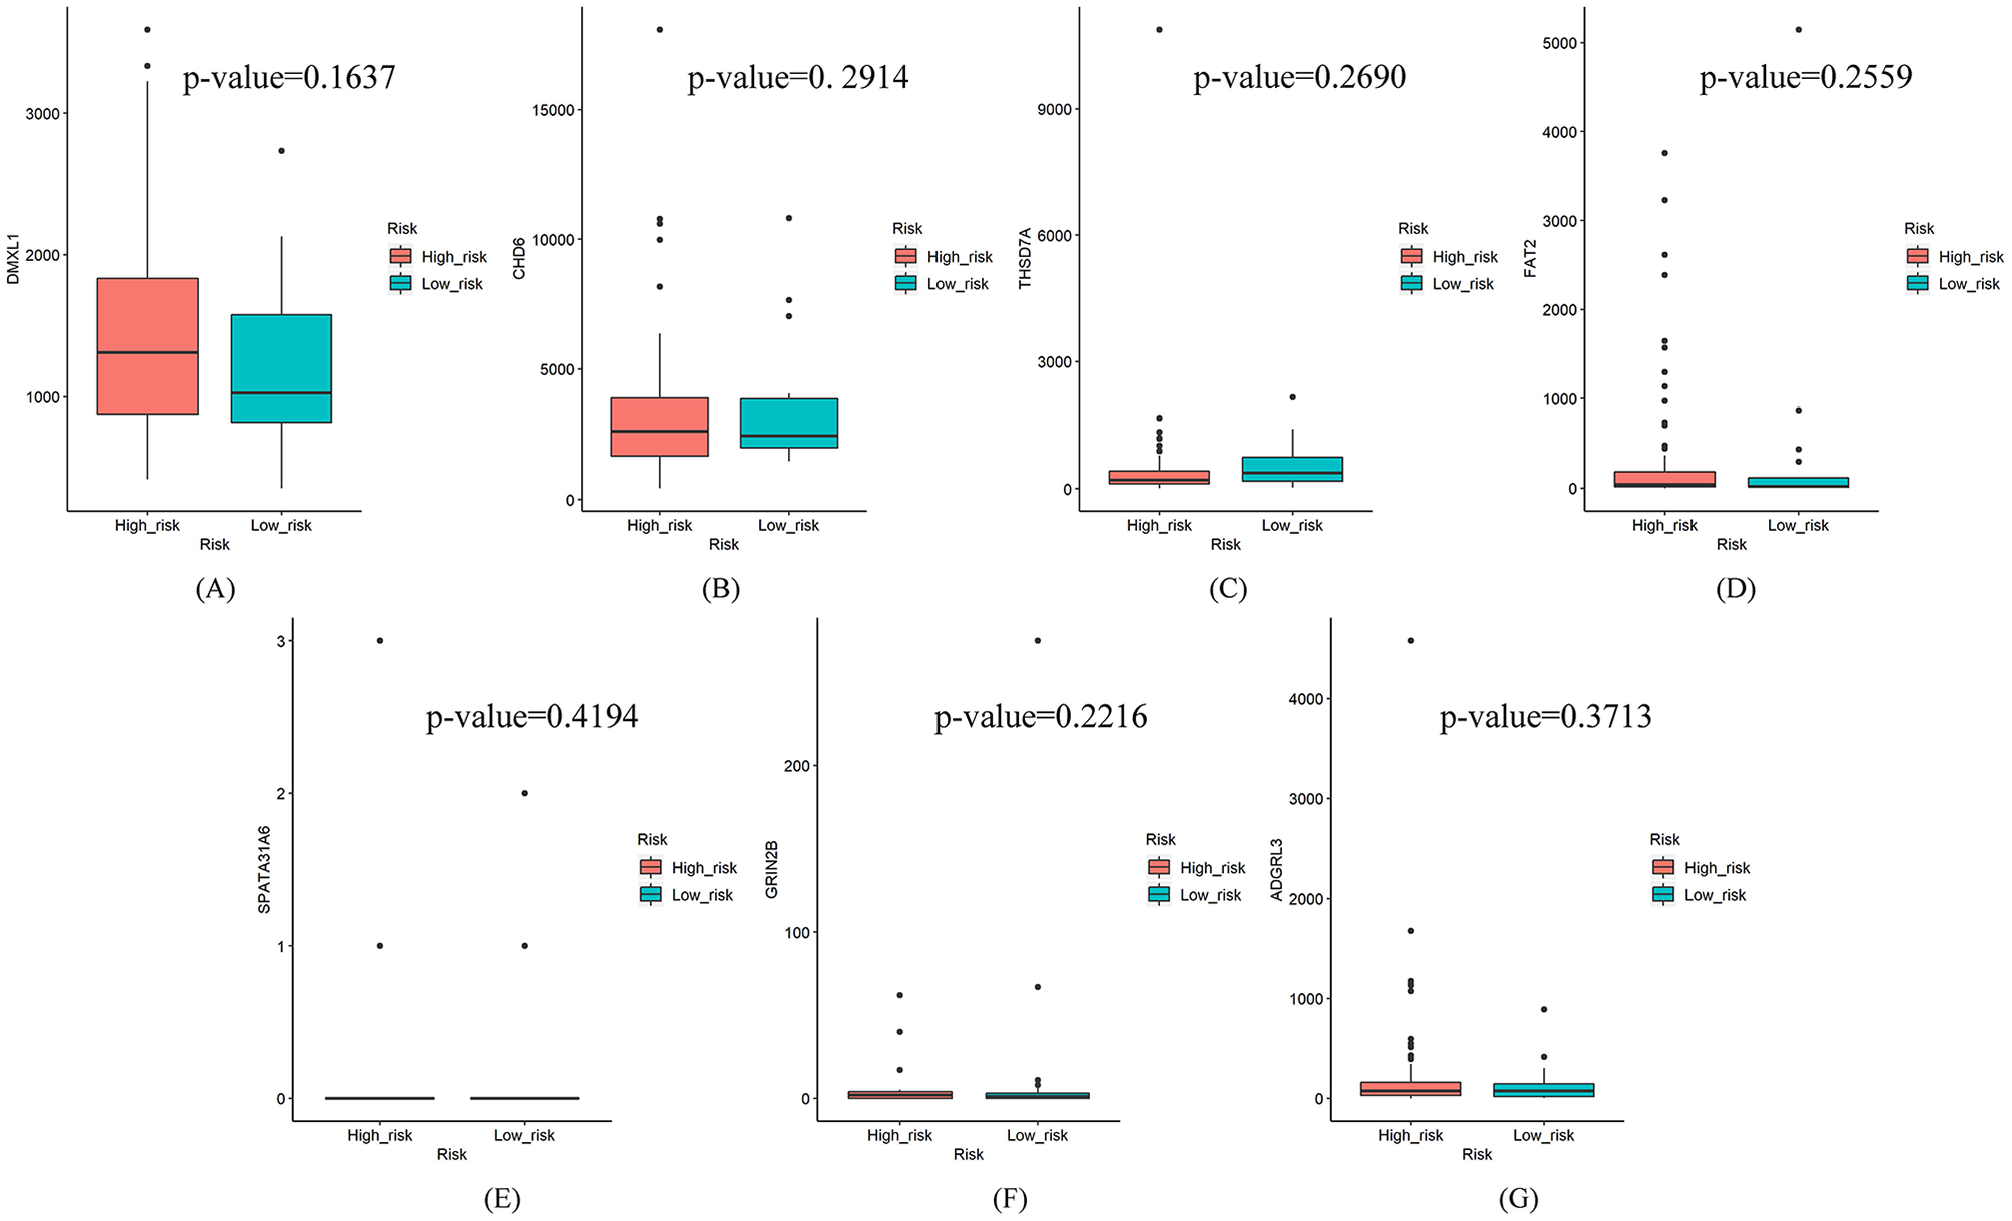
Expression levels of 7 DMGs of the high-risk and the low-risk samples: (A) DMXL1, (B) CHD6, (C) THSD7A, (D) FAT2, (E) SPATA31A6, (F) GRIN2B, and (G) ADGRL3.
External validation of the DEGs and DMGs
Figures 6 and 7 show the results of the univariate Cox regression analysis of the DEGs and DMGs. Three DEGs and one DMG are not found in KM plot and ICGA Data Portal. In Figure 6, it is found that 9 DEGs, except DENR and LARC, are significantly related to the overall survival of LUAD samples; the relationships between their expression levels and the survival rate of LUAD samples are consistent with the results of this article. The validation results of DNER and LARC are not so promising. SFTA3 and BMP5 could be tumor suppressor genes because high expression levels of them relate to better survival, while others could be oncogenes.

KM curves of 10 DEGs on 1926 LUAD patients, who were separated into the high-expression and low-expression groups. SFTA3 and BMP5 could be tumor suppressor genes because higher expression levels of them relate to better survival, while others could be oncogenes: (A) SFTA3, (B) BMP5, (C) FAM83A, (D) TFAP2A, (E) PKP2, (F) CCL20, (G) RHOV, (H) DNER, (I) TNS4, and (J) ABCC2.

KM curves of 6 DMGs on 195 LUAD patients, who were separated into the mutated and not mutated groups. GRIN2B is significantly associated with the survival rate of LUAD patients and it could be a tumor suppressor as the risk of patients with it mutated is higher: (A) DMXL1, (B) CHD6, (C) THSD7A, (D) FAT2, (E) SPATA31A6, and (F) GRIN2B.
In Figure 7, it can be found that the mutations of GRIN2B are significantly associated with the survival rate of LUAD samples, which is consistent with the results of this article. The patients with mutations of GRIN2B show worse outcomes compared with these who do not have mutations of GRIN2B. Therefore, GRIN2B could be a tumor suppressor gene as the risk of a patient with it mutated is higher.
Validation of the prognostic model
A combined feature matrix was constructed by integrating the normalized expression values of the DEGs and the mutation times of the DMGs. The dimension of the feature matrix is 200 × 20, in which each column represents an LUAD sample of the training set. Then, the prognostic model based on the SVM algorithm was trained using the 10-fold cross validation, and the optimal hyper-parameters were obtained.
Sensitivity, specificity, and the area under the ROC (receiver operating characteristic) curve (AUC) were used to evaluate the prognostic performance. They are defined by 4 terms, namely, true positive (TP), true negative (TN), false positive (FP), and false negative (FN). TP is the number of the high-risk samples that are predicted as high risk, while FP is the number of the high-risk samples but predicted as low risk incorrectly; TN is the number of the low-risk samples that are predicted as low risk, while FP is the number of low-risk samples but predicted as high risk. Sensitivity, specificity, and AUC are defined as follows:


and

Sensitivity mainly evaluates the ability to recognize high-risk samples, whereas specificity mainly focuses on the prediction performance of the low-risk samples. The greater values of these criteria indicate better classification result.
The prediction performance of the DEGs and DMGs with patients in different stages was first evaluated by the prognostic model. The values of sensitivity, specificity, and AUC of stage I to IV are listed in Table 3. The prognostic genes worked the best with the patients in stage III, where 7 of 8 high-risk patients were stratified correctly. There are only 2 high-risk patients in stage IV, so the specificity is not available.
Evaluation metrics of stratification results based on DEGs and DMGs of the training set with different stages.

Abbreviations: AUC, area under the ROC curve; DEG, differentially expressed genes; DMG, differentially mutated genes; ROC, receiver operating characteristic.
Statistically significant values were represented in bold.
The values of sensitivity, specificity, and AUC by using single (DEGs) and integrated (DEGs and DMGs) features are listed Table 4. It can be found that by integrating the features of the DEGs and DMGs, the performance of the proposed prognostic model was significantly improved, with the specificity and AUC increasing from 0.543 to 0.743 and from 0.537 to 0.637 respectively.
Evaluation metrics of stratification results based on different signature sets with the best metrics written in bold.

Abbreviations: AUC, area under the ROC curve; DEG, differentially expressed genes; DMG, differentially mutated genes; ROC, receiver operating characteristic.
Statistically significant values were represented in bold.
The proposed signature set was then compared with 4 most recent sets of prognostic signatures for LUAD, which are all based on genetic expression profiles. The prediction experiments of all the signature sets were performed on the same training and testing sets used in this article. In the training set, the expression values of genes in each prognostic signature set were selected and used to train the SVM model. The 10-fold cross validation was also used in the training progress of them. Finally, the trained model was evaluated by the testing set and the prediction results are listed in Table 4. It can be found that the proposed signatures achieved the greatest values of specificity and AUC. Figure 8 depicts the ROC curves of the stratification results of the samples in the testing set by different prognostic signature sets and their corresponding prognostic models; it can be found that the proposed prognostic signatures stood out on top compared with others.

ROC curves of proposed prognosis model by using our signatures and others.
Discussion
This study aims to integrate the genetic mutation and expression profiles to predict overall survival (OS) of LUAD using a TCGA data set. Patients in this data set were separated into the high-risk and low-risk groups according to the overall survival. Differential analysis between the 2 groups produced a novel set of prognostic genes, containing 13 DEGs and 7 DMGs. Finally, a prognostic model was constructed using the integrated features of the DEGs and DMGs. The validation results have showed the prognostic value of the DEGs and DMGs and have showed the power of the DMGs on the survival prediction. The most significant contribution of this article is the integration of the genetic mutation and expression profiles to determine prognostic genes for LUAD patients. If genetic expression and mutation profiles are available, the pipeline of determining DEGs and DMGs in this article can be applied to other types of cancers.
The functions of the DEGs and DMGs were searched from https://www.uniprot.org/ and are listed in Supplementary File 2. The DEGs and DMGs were also searched on PubMed using the gene name and lung cancer. The number of related papers and functions of the DEGs and DMGs in lung cancer are listed in Supplementary File 2. SFAT3, BMP5, FAM83A, TSN4, ABCC2, and FAT2 have been suggested to be biomarkers in lung cancer.34-39 The other genes were identified as biomarkers for lung cancer for the first time in this article. In addition, there is no related study about KLRG2, DMXL1, CHD6, ADGRL3, and SPATA31A6, suggesting that they act independently as biomarkers in lung cancer.
The relationships between the DEGs and DMGs and some known driver genes of lung cancer were analyzed. FAM83A has been indicated as a proto-oncogene that functions in the epidermal growth factor receptor (EGFR) signaling pathway. 40 EGFR is a well-known driver gene in lung cancer, and it has been suggested that FAM83A lies downstream of EGFR/PI3K and upstream of MEK. In breast cancer cells, it has been revealed that downmodulation of FAM83A led to decreased proliferation and invasiveness in cell cultures as well as to decreased tumor growth in vivo. 40 In lung cancer, several studies about FAM83A have been published in recent years. Overexpression of FAM83A has been indicated to be related to poor clinical outcomes in LUAD,41-44 and FAM83A promotes the progression and tumorigenicity in non-small cell lung cancer by regulating Wnt and Hippo signaling pathways.44,45 Therefore, FAM83A is an effective prognostic biomarker and a potential new therapeutic target in lung cancer.36,46 In this article, it is found that FAM83A is overexpressed in the high-risk samples compared with the low-risk samples.
Enrichment analysis of the gene set, comprising the DEGs, DMGs, EGFR, and KRAS, was performed using KEGG pathways database in this article. The results illustrated that GRIN2B and EGFR were enriched into Rap1 signaling pathway (P = .002) and Ras signaling pathway (P = .003), suggesting a potential relationship between them. The 2 genes were then searched in PubMed and only one paper was obtained, 47 in which both GRIN2B and EGFR were determined as biomarkers for gastric cancer but the relationship between them was not discussed. Therefore, it is a promising study to explore the relationship between GRIN2B and EGFR in lung cancer.
Genetic mutations can affect gene expressions. 27 However, the interactive mechanism between the genetic mutation and expression is still not well understood. 28 It is found that DMXL1 and FAT2 are downregulated in the low-risk patients with these genes mutated, while THSD7A is upregulated. To reveal how the DMGs impact their expression levels is one of our future works. From the KM plots of the DMGs, GRIN2B is a potential tumor suppressor gene in LUAD, which has been confirmed in some types of cancer, such as diffuse large B-cell lymphoma, 48 gastric cancer, 47 and LUAD. 49
There are 2 main limitations of this study. First, in the validation results of DMGs, only GRIN2B showed a promising prognostic performance. The reason is that the DMGs only mutated in a small portion of whole samples. For example, only 19% of the high-risk samples have mutations of GRIN2B. Second, the performance of stratification is far from satisfactory. Although several prognostic models can be used to predict the overall survival of LUAD,15,17 the AUC values are only 0.615 and 0.637 in Zhao et al 15 and in this article, respectively. New signatures, such as microbial biomarkers,50,51 and prognostic models based on advanced machine learning algorithms, such as deep learning methods, 52 are needed to further improve the performance of the survival prediction.
Conclusion
In this article, 13 DEGs and 7 DMGs were identified in an LUAD cohort, and a prognostic model was constructed by combining the features of the DEGs and DMGs. The validation results on the testing set have showed the superiority of the proposed prognostic signatures and model compared with others. The main contribution of this article is that the prognostic signatures are determined by a new manner, in which patients with LUAD were partitioned into the high-risk and low-risk groups. Differential analysis of the expression and mutation profiles between the 2 groups identified a new set of prognostic signatures. This pipeline can be applied to other types of cancers to determine novel prognostic signatures and potential therapeutic targets.
There are several promising extensions of this study. First, the overall survival of LUAD patients is only considered when identifying DEGs and DMGs in this article. In future study, more factors, such as the therapy, should be included to determine prognostic signatures. Second, with multi-omics data sets available, it is a practical manner to improve the prognostic prediction performance by combining the features from the genetic to epigenomic profiles of cancer samples.
Supplemental Material
SupplementaryFigures – Supplemental material for Combining Genetic Mutation and Expression Profiles Identifies Novel Prognostic Biomarkers of Lung Adenocarcinoma
Supplemental material, SupplementaryFigures for Combining Genetic Mutation and Expression Profiles Identifies Novel Prognostic Biomarkers of Lung Adenocarcinoma by Yun Liu, Fu Liu, Xintong Hu, Jiaxue He and Yanfang Jiang in Clinical Medicine Insights: Oncology
Footnotes
Funding:
The author(s) disclosed receipt of the following financial support for the research, authorship, and/or publication of this article: This research was funded by the National Natural Science Foundation of China (Nos. 30972610, 81273240, 91742107, and 81570002), National Key Research and Development Program (Nos. 2017YFC0910000 and 2017YFD0501300), Jilin Province Science and Technology Agency (Nos. 20200403084SF, JLSWSRCZX2020-009, 20200901025SF, 20190101022JH, 2019J026, 20170622009JC, 2017C021, 2017J039, SXGJXX2017-8, JJKH20180197KJ, DBXM154-2018, and 2018SCZWSZX-015), and the Project funded by China Postdoctoral Science Foundation (2019M651204).
Declaration of conflicting interests:
The author(s) declared no potential conflicts of interest with respect to the research, authorship, and/or publication of this article.
Author Contributions
YL, FL, and YJ contributed conception and design of the study; XH organized the database; YL and JH performed the statistical analysis; YL and FL wrote the first draft of the manuscript; YL, FL, XH, and YJ improved the manuscript. All authors contributed to manuscript revision, and read and approved the submitted version.
Availability of Data and Materials
All data used in this paper can be downloaded from The Cancer Genome Atlas (TCGA) freely.
Ethical Approval
This article does not contain any studies with human participants or animals performed by any of the authors.
Supplemental Material
Supplemental material for this article is available online.
References
Supplementary Material
Please find the following supplemental material available below.
For Open Access articles published under a Creative Commons License, all supplemental material carries the same license as the article it is associated with.
For non-Open Access articles published, all supplemental material carries a non-exclusive license, and permission requests for re-use of supplemental material or any part of supplemental material shall be sent directly to the copyright owner as specified in the copyright notice associated with the article.