
Abstract
BACKGROUND:
We performed a bioinformatics analysis to screen for cell cycle-related differentially expressed genes (DEGs) and constructed a model for the prognostic prediction of patients with early-stage lung squamous cell carcinoma (LSCC).
METHODS:
From a gene expression omnibus (GEO) database, the GSE157011 dataset was randomly divided into an internal training group and an internal testing group at a 1:1 ratio, and the GSE30219, GSE37745, GSE42127, and GSE73403 datasets were merged as the external validation group. We performed single-sample gene set enrichment analysis (ssGSEA), univariate Cox analysis, and difference analysis, and identified 372 cell cycle-related genes. Additionally, we combined LASSO/Cox regression analysis to construct a prognostic model. Then, patients were divided into high-risk and low-risk groups according to risk scores. The internal testing group, discovery set, and external verification set were used to assess model reliability. We used a nomogram to predict patient prognoses based on clinical features and risk values. Clinical relevance analysis and the Human Protein Atlas (HPA) database were used to verify signature gene expression.
RESULTS:
Ten cell cycle-related DEGs (EIF2B1, FSD1L, FSTL3, ORC3, HMMR, SETD6, PRELP, PIGW, HSD17B6, and GNG7) were identified and a model based on the internal training group constructed. From this, patients in the low-risk group had a higher survival rate when compared with the high-risk group. Time-dependent receiver operating characteristic (tROC) and Cox regression analyses showed the model was efficient and accurate. Clinical relevance analysis and the HPA database showed that DEGs were significantly dysregulated in LSCC tissue.
CONCLUSION:
Our model predicted the prognosis of early-stage LSCC patients and demonstrated potential applications for clinical decision-making and individualized therapy.
Keywords
Introduction
Globally, lung cancer has the highest incidence and mortality rate, with 1.8 million individuals annually diagnosed and approximately 1.6 million dying from the disease every year [1]. Non-small cell lung cancer (NSCLC) accounts for 85%–90% of all these cases [2]. As the second most common NSCLC type, lung squamous cell carcinoma (LSCC) is more likely to show a central type by imaging [3]. LSCC survival rates appear to be worse when compared with lung adenocarcinoma (LUAD) due to the fact that LSCC develops more frequently in smokers who suffer with chronic obstructive pulmonary disease and heart disease [4]. Equally, LSCC survival rates are also affected by several clinical factors, including the Tumor-Node-Metastasis (TNM) stage, age, gender, and health status. At the cell and molecular level, the expression of particular genes can robustly reflect LSCC diagnostics and prognostics. Additionally, when compared with late-stage NSCLC patients, early-stage patients have a better overall survival (OS) rate due to the presence of unique molecular mechanisms [5, 6]. In recent years, LSCC treatment has not been limited to traditional therapies; along with chemoradiotherapy and surgery, personalized treatment plans based on gene mutations and immunotherapy have increased survival rates in some LSCC patient groups [7].
Despite considerable progress in novel therapies for LSCC, disease verification and evaluation methodologies are relatively poor. In clinical settings, most clinicians use TNM staging and histological classification to evaluate carcinoma development. Previously, it was reported that several factors (e.g., age and gender) could be better disease predictors than TNM staging [8, 9, 10], thus, it is important to develop novel and robust models to estimate prognoses in LSCC patients.
Several studies have reported that the cell cycle is closely connected with LUAD cell growth and proliferation, with some genes having roles in these pathways. For example, the CUL4A
Materials and methods
Microarray data
We downloaded gene expression profiles from GSE157011, GSE30219, GSE37745, GSE42127, and GSE73403 datasets encompassing 678 early-stage LSCC tissue samples from the Gene Expression Omnibus (GEO) database of the National Center for Biotechnology Information (
Acquisition of key cell cycle-related genes and difference analysis
The reference gene set was acquired from “KEGG_CELL_CYCLE” (
Gene Ontology (GO) and Kyoto Encyclopedia of Genes and Genomes (KEGG) analysis
Biological functions and pathways of specific cell cycle-related DEGs were identified by GO and KEGG enrichment analyses, respectively. GO comprised three terms: molecular function (MF), biological process (BP), and cellular component (CC), and they were calculated using the “clusterProfilter” package in R (Version 3.6.3) [19]. A
Model construction and validation
The GSE157011 discovery set was randomly grouped into two parts in a 1:1 scale, and were defined as the internal training group and the internal testing group. The least absolute shrinkage and selection operator (LASSO) was used to further predict candidate cell cycle-related DEGs, and was used to construct the prognosis prediction model in the internal training group [20]. From multivariate Cox regression, a signature was established, and the risk score of each patient calculated using the following formula:
Where
Based on the median risk score, patients in the internal training group were divided into low-risk and high-risk groups. Kaplan-Meier (KM) survival curves and time-dependent receiver operating characteristic curves (tROC), evaluating the OS of both groups, were plotted to assess model efficiency. The model was also verified in the internal testing group, the external validation set, and all groups. To verify if risk scores were independent risk factors, risk score and clinical feature combinations were examined using univariate and multivariate Cox regression analysis. A
Developing and assessing a predictive nomogram based on clinical features
A prognostic nomogram was established to predict 1, 3, and 5 year patient survival rates based on clinical features and risks in the internal training set, while a calibration plot was used to assess the degree of fitness by comparing with facts. The “rms” and “survival” packages in R were used for this (Version 3.6.3).
Identifying molecular subtypes and validating prognostic genes
Using the “ConsensusClusterPlus” package in R (Version 3.6.3), the candidate gene matrix was used to identify molecular subtypes in early-stage LSCC Then, survival analysis was performed between these subtypes.
Clinical relevance analysis
According to the integration of clinical information and expression of prognostic genes, the relevance between a series of integrated matrix parameters was plotted using the “beeswarm” package in R (Version 3.6.3). A
Results
Acquisition and screening cell cycle-related DEGs
After balancing for batch effects, GSE157011 raw data, including gene expression and clinical information were processed in ssGSEA. Using Spearman’s correlations and
The acquisition of key cell cycle-related differentially expressed genes (DEGs). (A) A heatmap showing cell cycle-related DEGs. (B) A volcano map showing cell cycle-related DEGs. (C, D) Gene Ontology (GO) terms in enrichment analysis. (E) Kyoto Encyclopedia of Genes and Genomes (KEGG) pathways in enrichment analysis.
Prognostic model of the internal training group and risk signatures with 10 differentially expressed genes (DEGs).(A, B) Cell cycle-related DEGs were screened using log (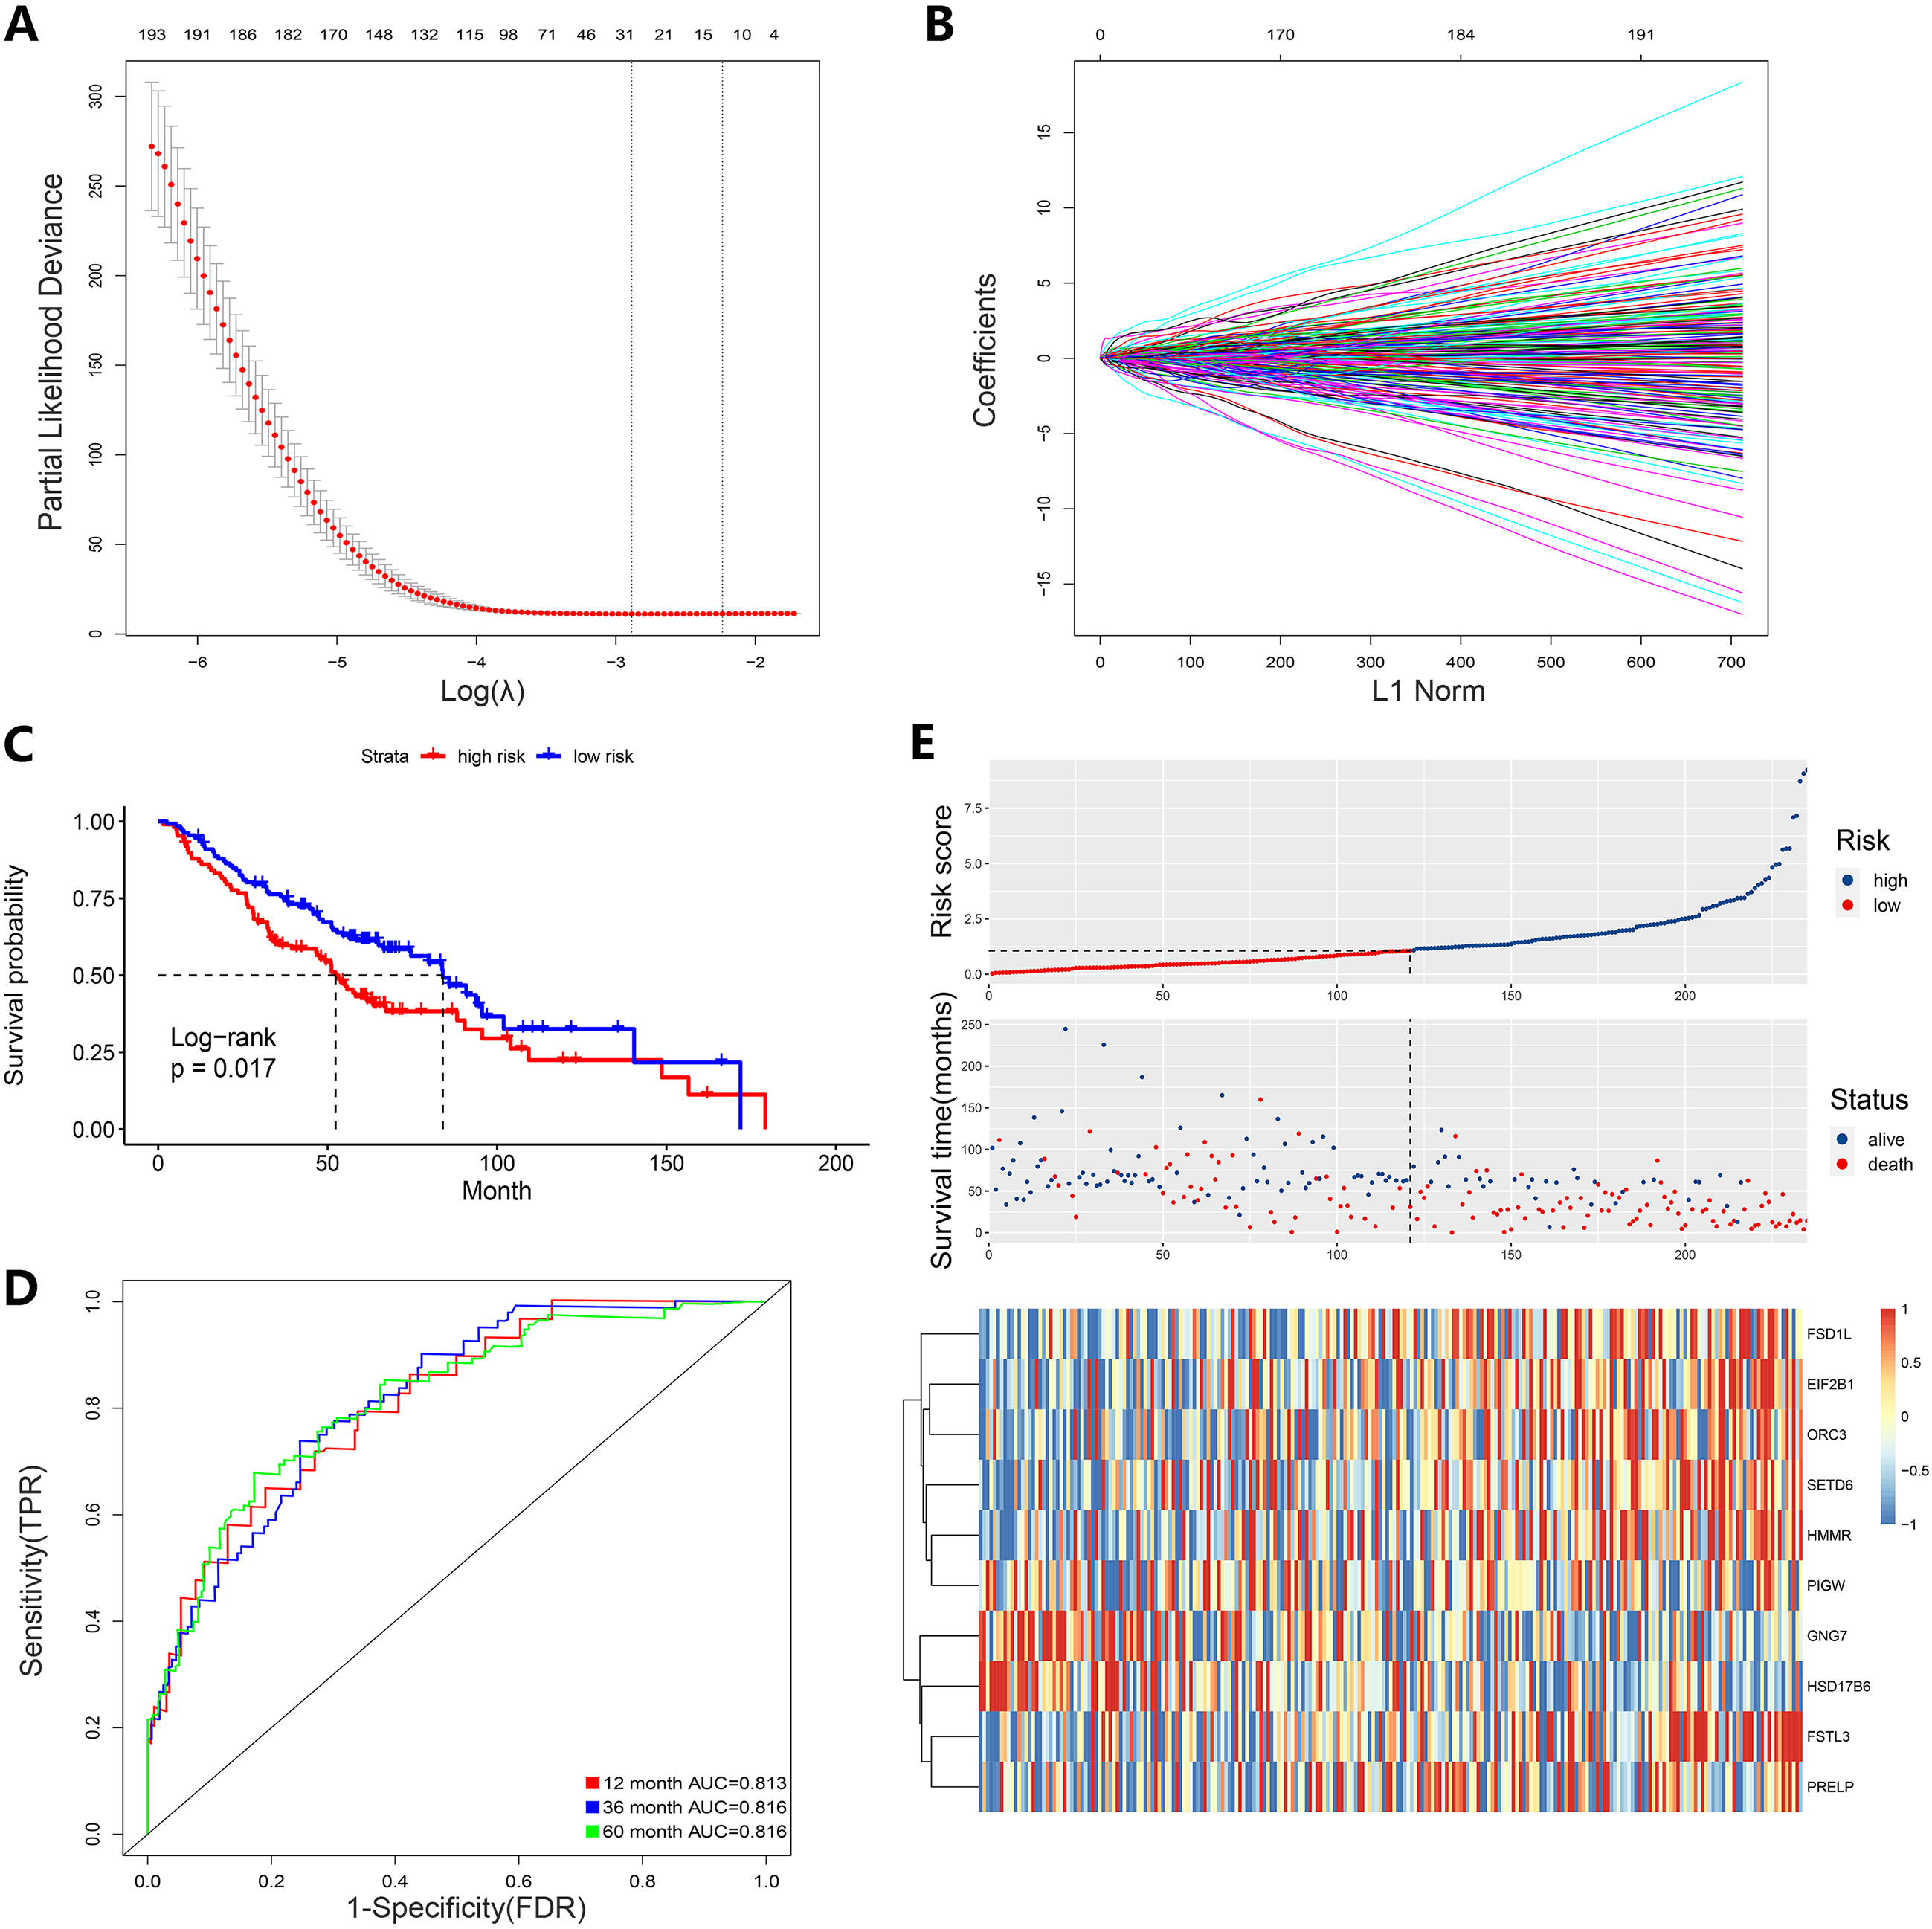
Model validation. Risk scores and survival analysis of high and low patient groups. The AUC of the ROC curve for OS and a risk plot and heatmap of the 10 DEGs in the (A) internal testing group, (B) discovery set, (C) external validation set, and (D) all samples. OS, overall survival; ROC, Receiver Operating Characteristic; AUC, Area under Curve.
The AUC of the ROC for OS was calculated in the model using different clinical features. Survival analysis of high and low patient groups and the AUC of the ROC for (A, B) age, (C, D) gender, (E, F) T1a
Univariate and multivariate Cox analysis of signatures combined with clinical features and nomogram construction. (A) Univariate Cox regression analysis. (B) Multivariate Cox regression analysis. (C) The AUC of the ROC. (D, E) Nomogram construction and the degree of fitness from calibration analysis. ROC, Receiver Operating Characteristic; AUC, Area under Curve.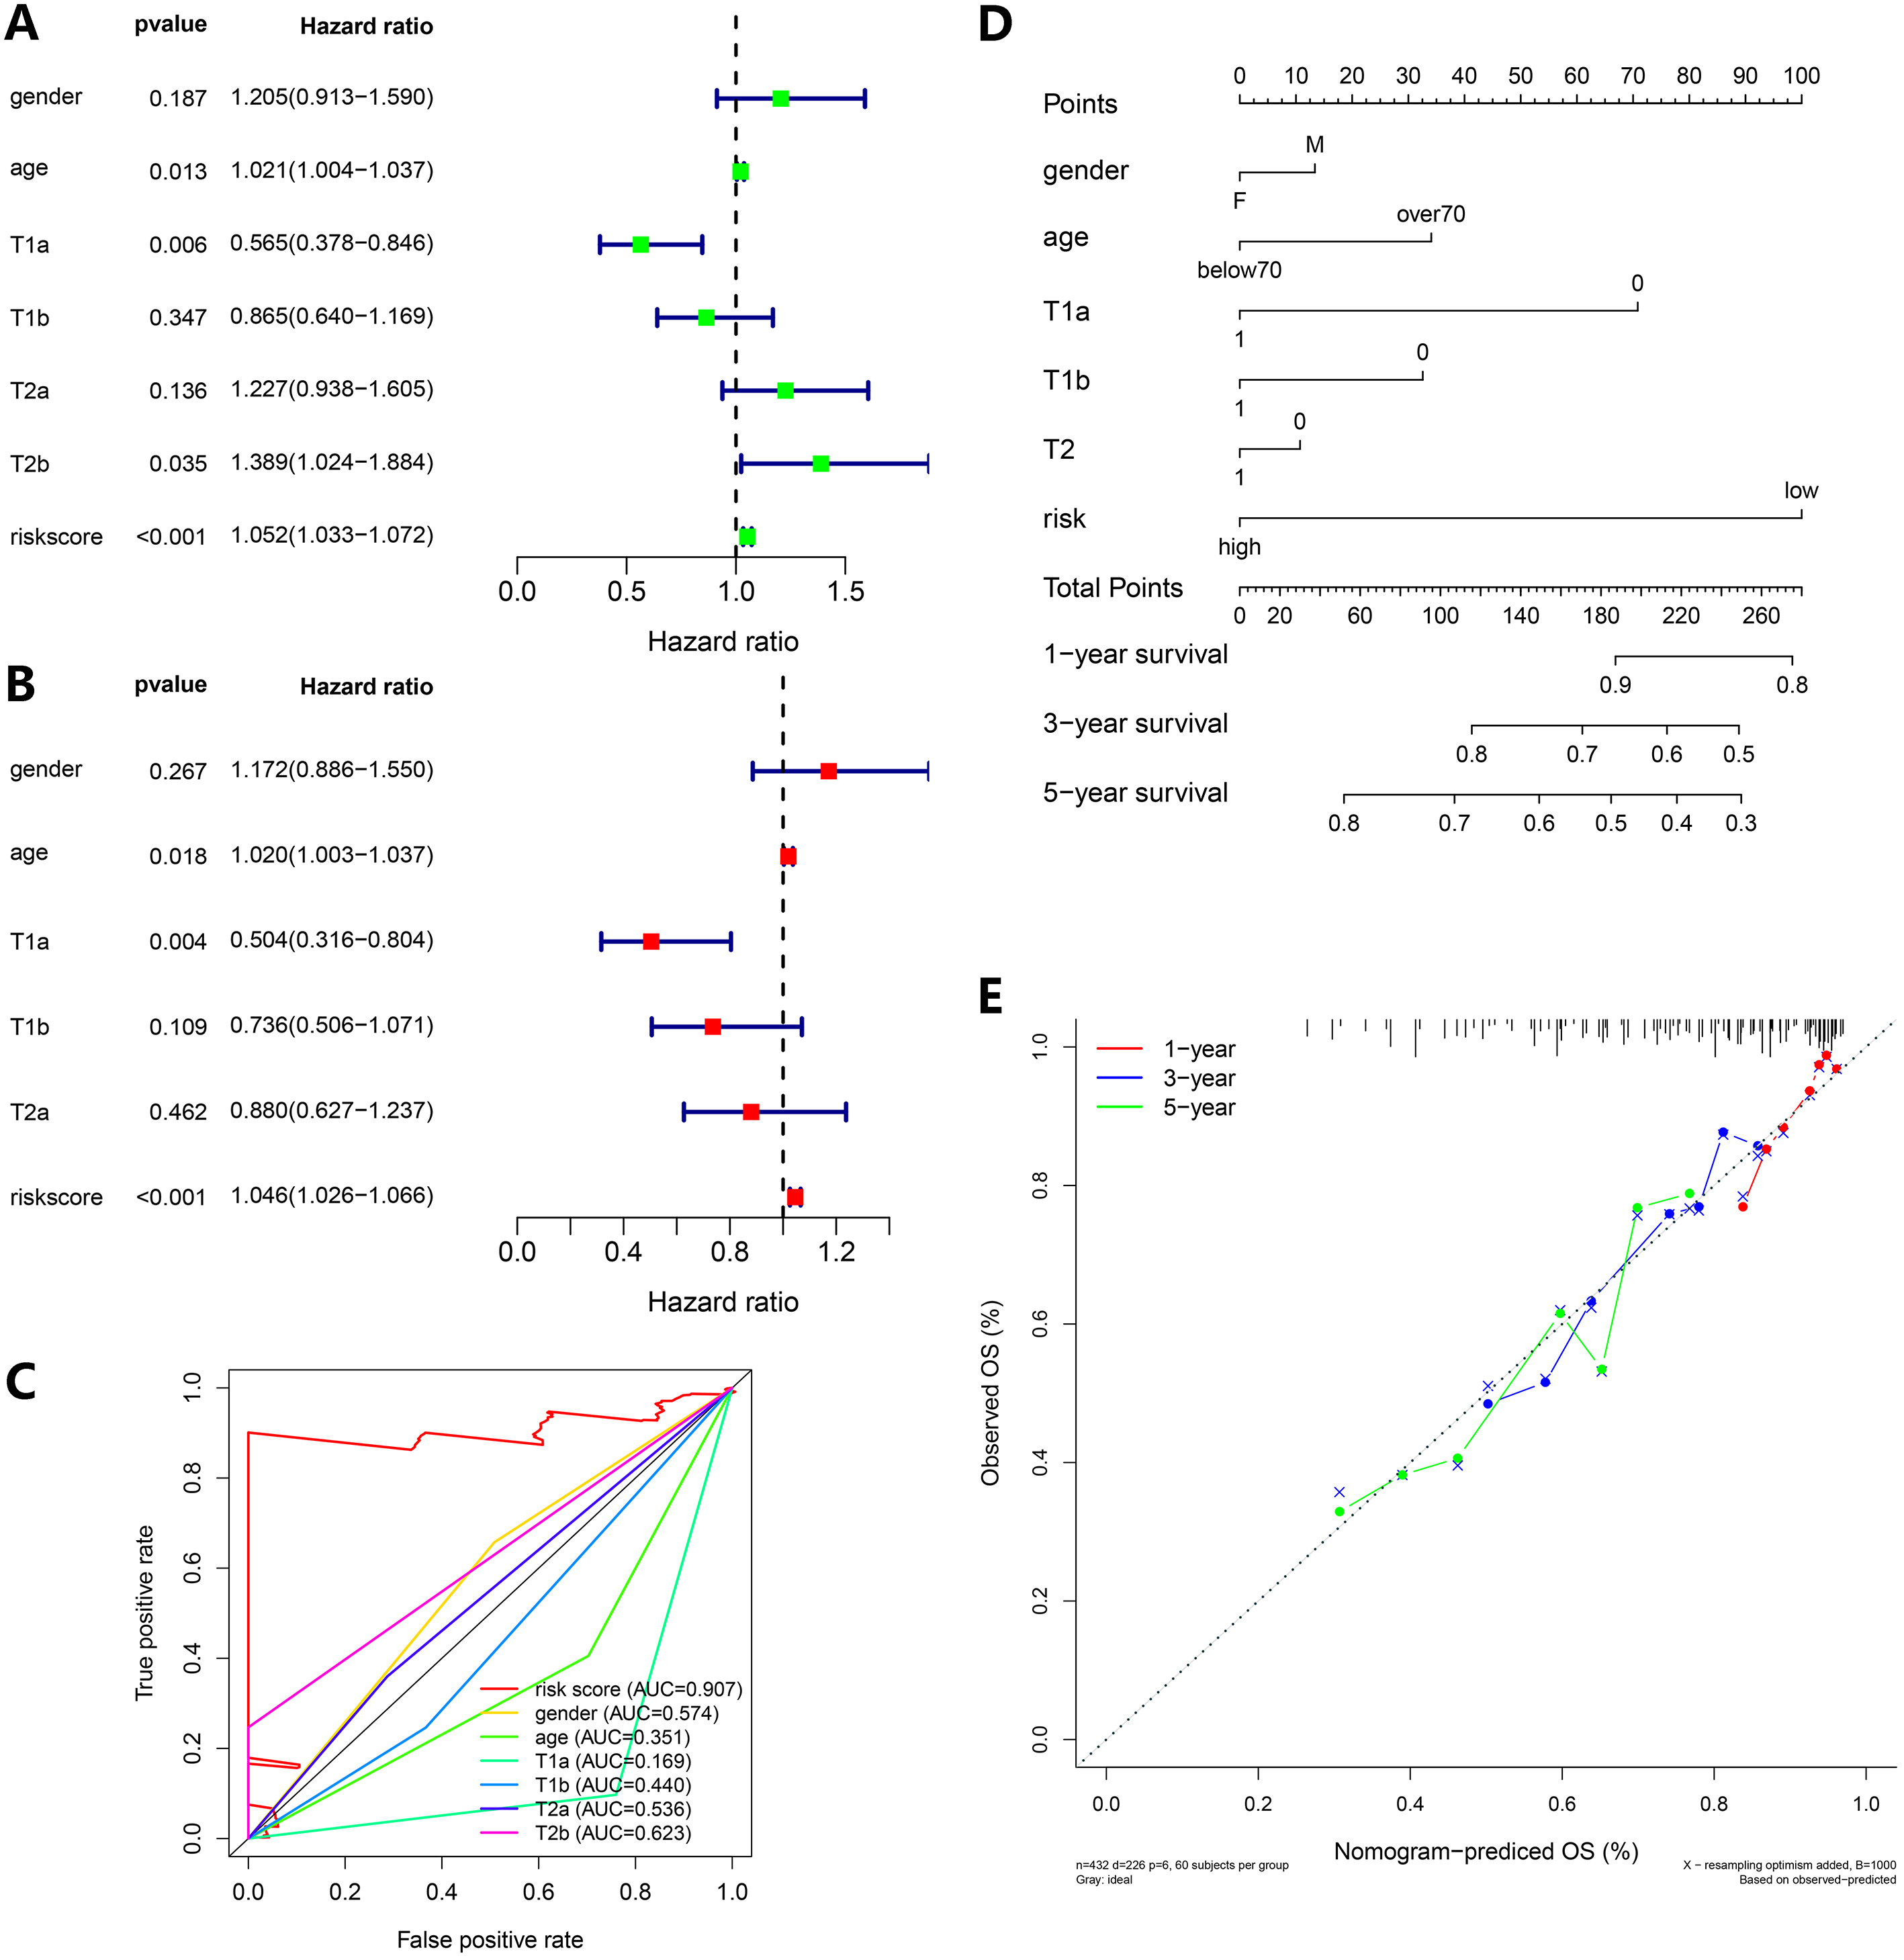
Molecular subtype identification. (A–C) Molecular subtypes based on 10 DEGs: Elbow and gap plots for different numbers of clusters; Consensus heatmap of clusters. (D) Survival analysis of the five clusters. DEGs, differentially expressed genes.
Clinical relevance analysis. EIF2B1, FSD1L, FSTL3, ORC3, HMMR, PRELP, and SETD6 expression (A–G), PIGW, HSD17B6, and GNG7 expression (H–J) between high-risk and low-risk patient groups. The relevance between risk and stage T is shown (K–L).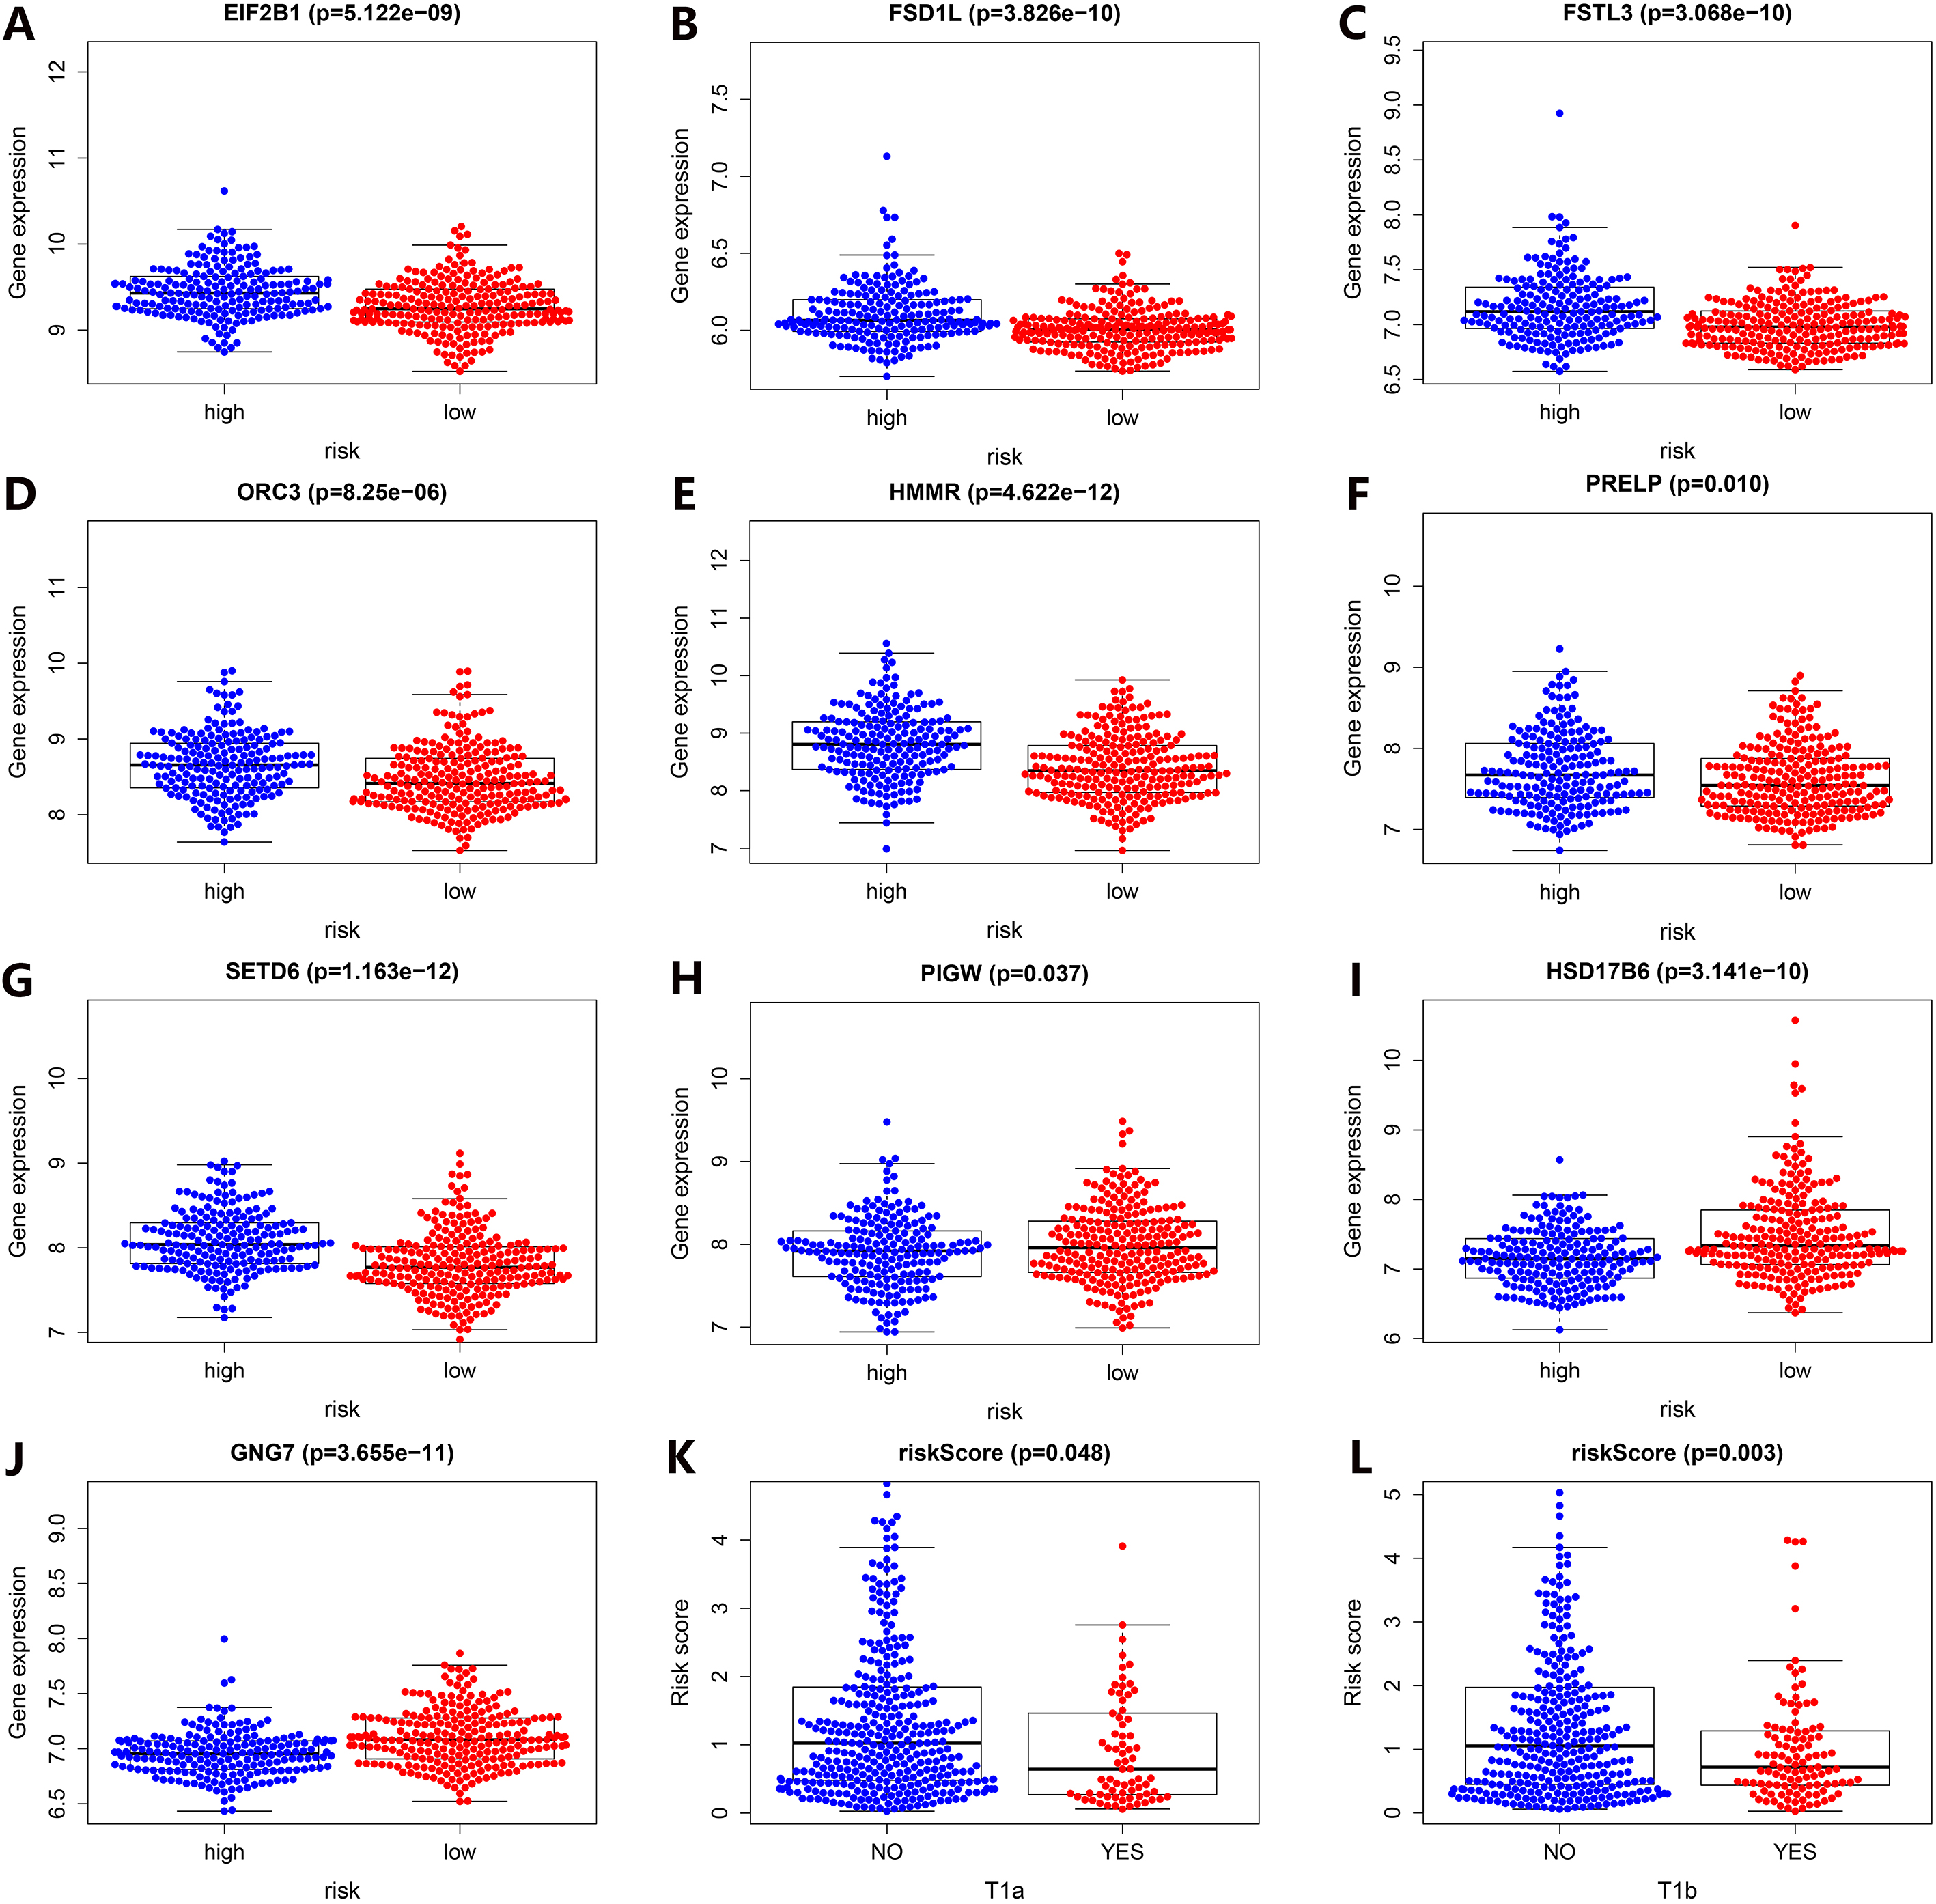
Protein levels of cell cycle-related DEGs in LSCC tumor and normal tissue from the HPA database.
From GO and KEGG enrichment analysis on the 372 cell cycle-related DEGs, we identified several functional enrichment pathways (Fig. 1D and E). GO analyses showed the largest number of terms were involved in organelle fission, mitotic nuclear division, regulation of lymphocyte proliferation, and the regulation of mononuclear and nuclear division. Genes enriched for each term are shown (Fig. 1C). KEGG results showed that most enrichment pathways were involved in cell adhesion molecules and the phagosome. The most common GO function terms were in division and proliferation which were closely related to the cell cycle and reflected our hypothesis.
Constructing and validating a prognostic genetic risk score model
According to a random standard, we generated an internal training group and internal testing group from the discovery set. LASSO regression was used for cross-validation, after which we selected 27 candidate genes with the log (
The same design formula was used for the internal testing group (Fig. 3A), discovery set (Fig. 3B), external validation set (Fig. 3C), and all groups (Fig. 3D). Datasets showed that patients in the high-risk group had significantly lower OS than those in the low-risk group, consistent with the internal training group. Also, the AUC of the ROC curve for OS in different datasets verified that the signature was robust. The AUC of the internal testing group was 0.660, 0.637 and 0.634 at 1, 3, and 5 years, respectively. The AUC in the discovery set was 0.747, 0.728, and 0.725 at 1, 3, and 5 years, respectively. The AUC in the external validation set was 0.710, 0.664, and 0.672 at 1, 3, and 5 years, respectively, and in all groups, it was 0.649, 0.623, and 0.634 at 1, 3, and 5 years, respectively.
Using different patient clinical classifications, we also performed survival analysis. When classified for age and gender, OS results were the same as our model (Fig. 4A–D). In particular for T stages, whether in T1 or T2, the OS of patients in the high-risk group was lower than in the low-risk group (Fig. 4E and F). Additionally, patients who did not relapse and patients before stage IV in OS also met our expectations (Fig. 4G and H). Values above the AUC in ROC curves for OS in different clinical classifications were desirable.
Risk scores are strong independent prognostic factors for early-stage LSCC
To further assess the prognostic value of risk scores, we collected different clinical features from early-stage LSCC patients for univariate and multivariate Cox regression analysis, including age, gender, and T stage (Fig. 5A and B). The AUC of the ROC curve for the risk score was 0.907 which was the best comparing with other clinical features (Fig. 5C). These results showed that the risk score was a strong independent prognostic factor for each patient. Additionally, a nomogram was executed by combining these clinical features and risk values (Fig. 5D). Calibration analysis showed the degree of fitness by comparing with facts (Fig. 5E), thus the nomogram was efficient and accurate.
Identifying molecular subtypes and clinical relevance analysis
To identify novel tumor molecular subtypes [22], we used consensus clustering to generate five potential clusters due to their stability when the
Verifying prognostic genes
Validation results from the HPA database suggested that EIF2B1, FSD1L, FSTL3, and ORC3 expression in tumor tissue was higher than in normal tissue (Fig. 8A–D), and that HMMR, SETD6, HSD17B6, and GNG7 expression was not detected in both tumor and normal tissue (Fig. 8E–H). PRELP and PIGW expression was not detected in the HPA database, in either tumor or normal tissue. In terms of validation, our analyses were reliable.
Discussion
Globally, LSCC represents approximately one third of all NSCLC cases [23]. In terms of LUAD, therapy options are varied and include surgery, targeted therapy, and immunotherapy [24, 25]. However, very limited personalized therapies are performed for advanced LSCC [26], thus their survival rates are poor. However, patients with early-stage LSCC (I–IIIA) are treated by surgery, often in combination with neoadjuvant treatment before the operation, therefore their OS is higher than for advanced disease [27, 28]. Consequently, the construction of a model for patients in early-stage LSCC is highly significant for predicting disease prognoses.
The cell cycle is key process for cell proliferation and division, and consists of five consecutive phases: G0, G1, S, G2, and M [29]. Most carcinoma cells break down in phase G1 and G2, due to more mutations occurring on G1 checkpoint easier and DNA damage and degradation occurring on G2 checkpoint mainly via the ATM/CHK2/p53 pathway [30]. Using gene data from high-throughput techniques, we collected cell cycle-related gene information and used it to systematically investigate associations between tumors and genes. Critically, more studies are now constructing disease signatures using such methods [31, 32].
In our study, we screened 372 genes from 467 cell cycle-related genes and performed LASSO regression and multivariate Cox regression analysis. From this, 10 signature DEGs were identified. Based on this approach, we established a predictive model; the AUC was 0.813, 0.816, and 0.816 at 1, 3, and 5 years in the internal training group, which showed good robustness. Additionally, similar data were observed for the internal testing group, discovery set, or external validation set. In a short, on the premise of rare models based on early-stage LSCC, the model is reliable to assess the prognosis.
From these gene signatures, FSTL3 is a member of the FSTL family and regulates testicular aging and size [33] and also glucose and fat homeostasis [34]. In breast and hepatocellular carcinoma, FSTL3 was reported as a potential biomarker due to its abnormal expression [35, 36]. Recently, FSTL3 overexpression was shown to promote NSCLC proliferation and metastasis, which was regulated by the long non-coding RNA DSCAM-AS1/miR-122-5p axis [37]. EIF2B1 is a guanine nucleotide exchange factor for its GTP-binding protein partner EIF2, and is involved in protein biosynthesis [38]. During cell cycle S phase, OBI1 catalyzes the multi-mono-ubiquitylation of a subset of chromatin-bound ORC3 and ORC5 proteins [39]. As an intracellular, microtubule-associated, spindle assembly factor, HMMR increases the activity of mitotic kinases [40]. HMMR was also reported to inhibit LUAD cell proliferation, migration, invasion, and promote cell apoptosis by down-regulating HMMR [41]. From laboratory studies, SETD6-deficient cells progressed faster through the different mitotic steps toward cytokinesis stages [42]. GNG7 induces autophagy and cell death by inhibiting the mTOR pathway, which is also related to actin cytoskeleton and cell division [43].
However, our study had some limitations. Model construction was based on the internal training group, and further validation in multi-institution seemed to be a great choice. Additionally, functional verification studies are required to assess the relevance of these cell cycle DEGs in lung cancer etiology.
Conclusions
Based on cell cycle-related genes, we constructed a prognostic model for early-stage LSCC patients which could significantly guide clinical decision-making and individualized therapy. Also, these specific cell cycle-related genes could be used as new targets to treat LSCC.
Data availability statement
The datasets generated for this study can be found in the online repositories. The names of the repository/repositories and accession number(s) can be found in the article.
Ethical approval and consent to participate
This study has been approved by the Ethics Committee of the First Affiliated Hospital of Soochow University and was performed in accordance with the provisions of the Ethics Committee of Soochow University. Written informed consent was obtained from the patient for publication of this manuscript.
Author contributions
Conception: FY and JW.
Interpretation or analysis of data: LYK.
Preparation of the manuscript: ZCP, HY and FC.
Revision for important intellectual content: JD, LJX and MHT.
Supervision: FY and JW.
Declaration of interests
The authors declare that they have no known competing financial interests or personal relationships that could have appeared to influence the work reported in this paper.
Funding
This work was supported by the Jiangsu Provincial Research Foundation for Basic Research (Grant no. BK20191174), Suzhou Medical and Health Science and Technology Innovation Project (Grant no. SKY2022142), and Suzhou Science, Education and Health Youth Project (Grant no. KJXW2022006).
Supplementary data
The supplementary files are available to download from http://dx.doi.org/10.3233/CBM-220227.
sj-zip-1-cbm-10.3233_CBM-220227.zip - Supplemental material
Supplemental material, sj-zip-1-cbm-10.3233_CBM-220227.zip