
Abstract
Background and Aims:
Hepatocellular carcinoma is associated with several chronic liver diseases, especially chronic hepatitis B virus, hepatitis C virus, and alcoholism. It is increasingly appreciated that obesity/metabolic syndrome is also associated with chronic liver disease and subsequent hepatocellular carcinoma.
Methods:
We retrospectively investigated the serum lipid profiles in a large hepatocellular carcinoma cohort, associated predominantly with the hepatitis B virus, hepatitis C virus, alcohol or nonalcoholic steatohepatitis. The cohort was examined both as a whole, as well as stratified by etiology.
Results:
We found significant associations between parameters of hepatocellular carcinoma biology such as maximum tumor diameter, portal vein thrombosis, tumor multifocality or alpha-fetoprotein levels and individual lipid components, including total cholesterol, high-density lipoprotein cholesterol, low-density lipoprotein cholesterol, triglycerides and body mass index. In a final multiple linear regression model considering all lipid variables together, only high-density lipoprotein cholesterol was significantly associated with the tumor Tumor Aggressiveness Index. High-density lipoprotein cholesterol was found to have a statistically higher hazard ratio for death than low high-density lipoprotein cholesterol levels (Cox). On examination by etiological group, alpha-fetoprotein levels were significantly higher in patients with hepatitis C virus compared to those with alcohol or nonalcoholic steatohepatitis, but maximum tumor diameter, tumor multifocality and portal vein thrombosis were similar across etiological groups. Nonalcoholic steatohepatitis patients had significantly less cirrhosis than other groups and hepatitis B virus patients had significantly higher cholesterol and low-density lipoprotein cholesterol levels than hepatitis C virus patients.
Conclusions:
This is the first report, to our knowledge, of a relationship between serum lipid parameters and indices of hepatocellular carcinoma growth, invasion and aggressiveness, as well as with survival.
Introduction
Alterations in blood lipid profiles and metabolism have been described in the presence of chronic hepatitis infection, cirrhosis, and hepatocellular carcinoma (HCC), and changes in metabolic profiling have even been suggested to be useful for HCC screening.1-7 Multiple changes in the lipid composition of cancer cells, including HCC have also been well described.1,8-13 Several approaches to the correction of altered lipid levels in non-alcoholic fatty liver disease have been reported.14-17 The global epidemic of obesity has recently shifted attention to the increased incidence of obesity-associated and metabolic syndrome 18 -associated non-alcoholic fatty liver disease (NAFLD) and obesity-driven cancers and HCC,19-23 that may occur in the presence or in the absence of cirrhosis.22-24
In the present study, we report an analysis of blood lipid profile parameters from a large cohort of well-studied HCC patients who also had survival information and we show an association between lipid profile parameters and HCC aggressiveness. Furthermore, the blood lipid profile patterns differ HCC patients associated with the hepatitis B virus (HBV), the hepatitis C virus (HCV), alcohol, or nonalcoholic steatohepatitis (NASH).
Methods
Data collection
We retrospectively analyzed prospectively collected data in the Italian Liver Cancer (ITA.LI.CA) study group database of 521 HCC patients accrued till 2008 at 11 centers 25 who had full baseline tumor parameter data, including computed tomography (CT) scan information on the maximum tumor diameter (MTD); the number of tumor nodules; the presence of portal vein thrombosis (PVT) and plasma alpha-fetoprotein (AFP) levels; blood counts; routine blood liver function tests, (total bilirubin, gamma glutamyl transpeptidase (GGTP), albumin); demographics and survival information; and those who had lipid profile data and a single known etiological cause. ITA.LI.CA database management conforms to Italian legislation on privacy, and this study conforms to the ethical guidelines of the Declaration of Helsinki. Approval for this retrospective study on de-identified HCC patients was obtained by the Institutional Review Board of participating centers.
Tumor Aggressiveness Index
The Tumor Aggressiveness Index 26 was calculated as the sum of scores:
MTD (in tertiles): MTD<4.5; 4.5 ≤ MTD ≤ 9.6; MTD>9.6; for scores 1, 2, 3, respectively;
AFP (cutoff): AFP<100; 100 ≤ AFP ≤ 1000; AFP>1000; for scores 1, 2, 3, respectively;
PVT (No/Yes): PVT(No); PVT(Yes); for scores 1 and 3 respectively; Nodules (number): Nodules ≤ 3; Nodules>3; for scores 1 and 3 respectively.
Statistical methods
Characteristics of HCC patients were described by using mean (±SD) or proportions (%) for continuous or categorical variables, respectively.
For analytic purposes some variables were dichotomized: glycemia (< 100 or ≥100 mg/dL); total cholesterol (<200 or ≥200 (mg/dL), low-density lipoprotein (LDL) cholesterol (<160 or ≥160 mg/dL), high-density lipoprotein (HDL) cholesterol (
Multiple linear regression on dichotomized variables was applied to the data.
To explore differences in metabolic parameters an Tumor Aggressiveness Index was built. The index reflects the sum of each single score as follows: MTD (in terciles): MTD<4.5; 4.5≤MTD≤9.6; MTD>9.6; scores 1, 2, 3, respectively; AFP (cutoff): AFP<100; 100≤AFP≤1000; AFP>1000 ng/mL; scores 1, 2, 3, respectively; PVT (No/Yes): PVT (No); PVT (Yes); scores 1 and 3, respectively; Tumor Nodules (number): Nodules≤3; Nodules>3; scores 1 and 3, respectively.
For survival analysis, the HDL cholesterol ≥50(F), ≥40(M) or <50(F), <40(M) mg/ was used.
The non-parametric Kaplan–Meier method was applied to explore survival probabilities for each Metabolic Index category and to provide estimates of the probability of death. Cox’s Model was then fitted to the data. The proportional hazard assumption was evaluated by means of Schoenfeld residuals (SRT). Model fitting was evaluated by means of Akaike Information Criteria (AIC) and Bayesian information criterion (BIC). Risk estimators are expressed as hazard ratios (HR) and 95% confidence interval (95% CI).
The final multiple linear regression model of the Tumor Aggressiveness Index score or the Cox proportional hazard models for death were used in the stepwise method, and all variables were examined as categorical.
All Cox proportional hazard models for death were adjusted for age and gender.
All statistical analyses were performed by using Stata statistical software, version 14.2 (StataCorp LP, College Station, TX, USA).
Results
Metabolic parameters in relation to tumor aggressiveness parameters
The focus of this study was on 521 HCC patients who had lipid profile data collected and a known single etiological cause of their disease. Child Pugh A cirrhosis was evident in 74.8% of the patients, and 14.9% had Child Pugh B cirrhosis. An examination was made for any association between each of the six metabolic profile components (glycemia, total cholesterol, HDL, LDL, triglycerides and BMI) and each or all of the four parameters of HCC aggressiveness (Tumor Aggressiveness Index), namely MTD, the percentage of patients with PVT, mean AFP levels, or percentage of patients with tumor multifocality (Table 1). MTD was significantly associated with change in total cholesterol and LDL cholesterol. PVT was significantly associated only with HDL cholesterol. AFP levels were significantly associated with both HDL cholesterol and LDL cholesterol. Thus, each of the four tumor parameters was associated with a different pattern of lipids. The combination of all four tumor aggressiveness parameters together (the Tumor Aggressiveness Index25,26) was only significantly associated with HDL cholesterol levels (Table 1).
Plasma glycemia, HDL, triglycerides, total cholesterol, LDL cholesterol, HDL cholesterol, and BMI in HCC patients in relation to tumor parameters.
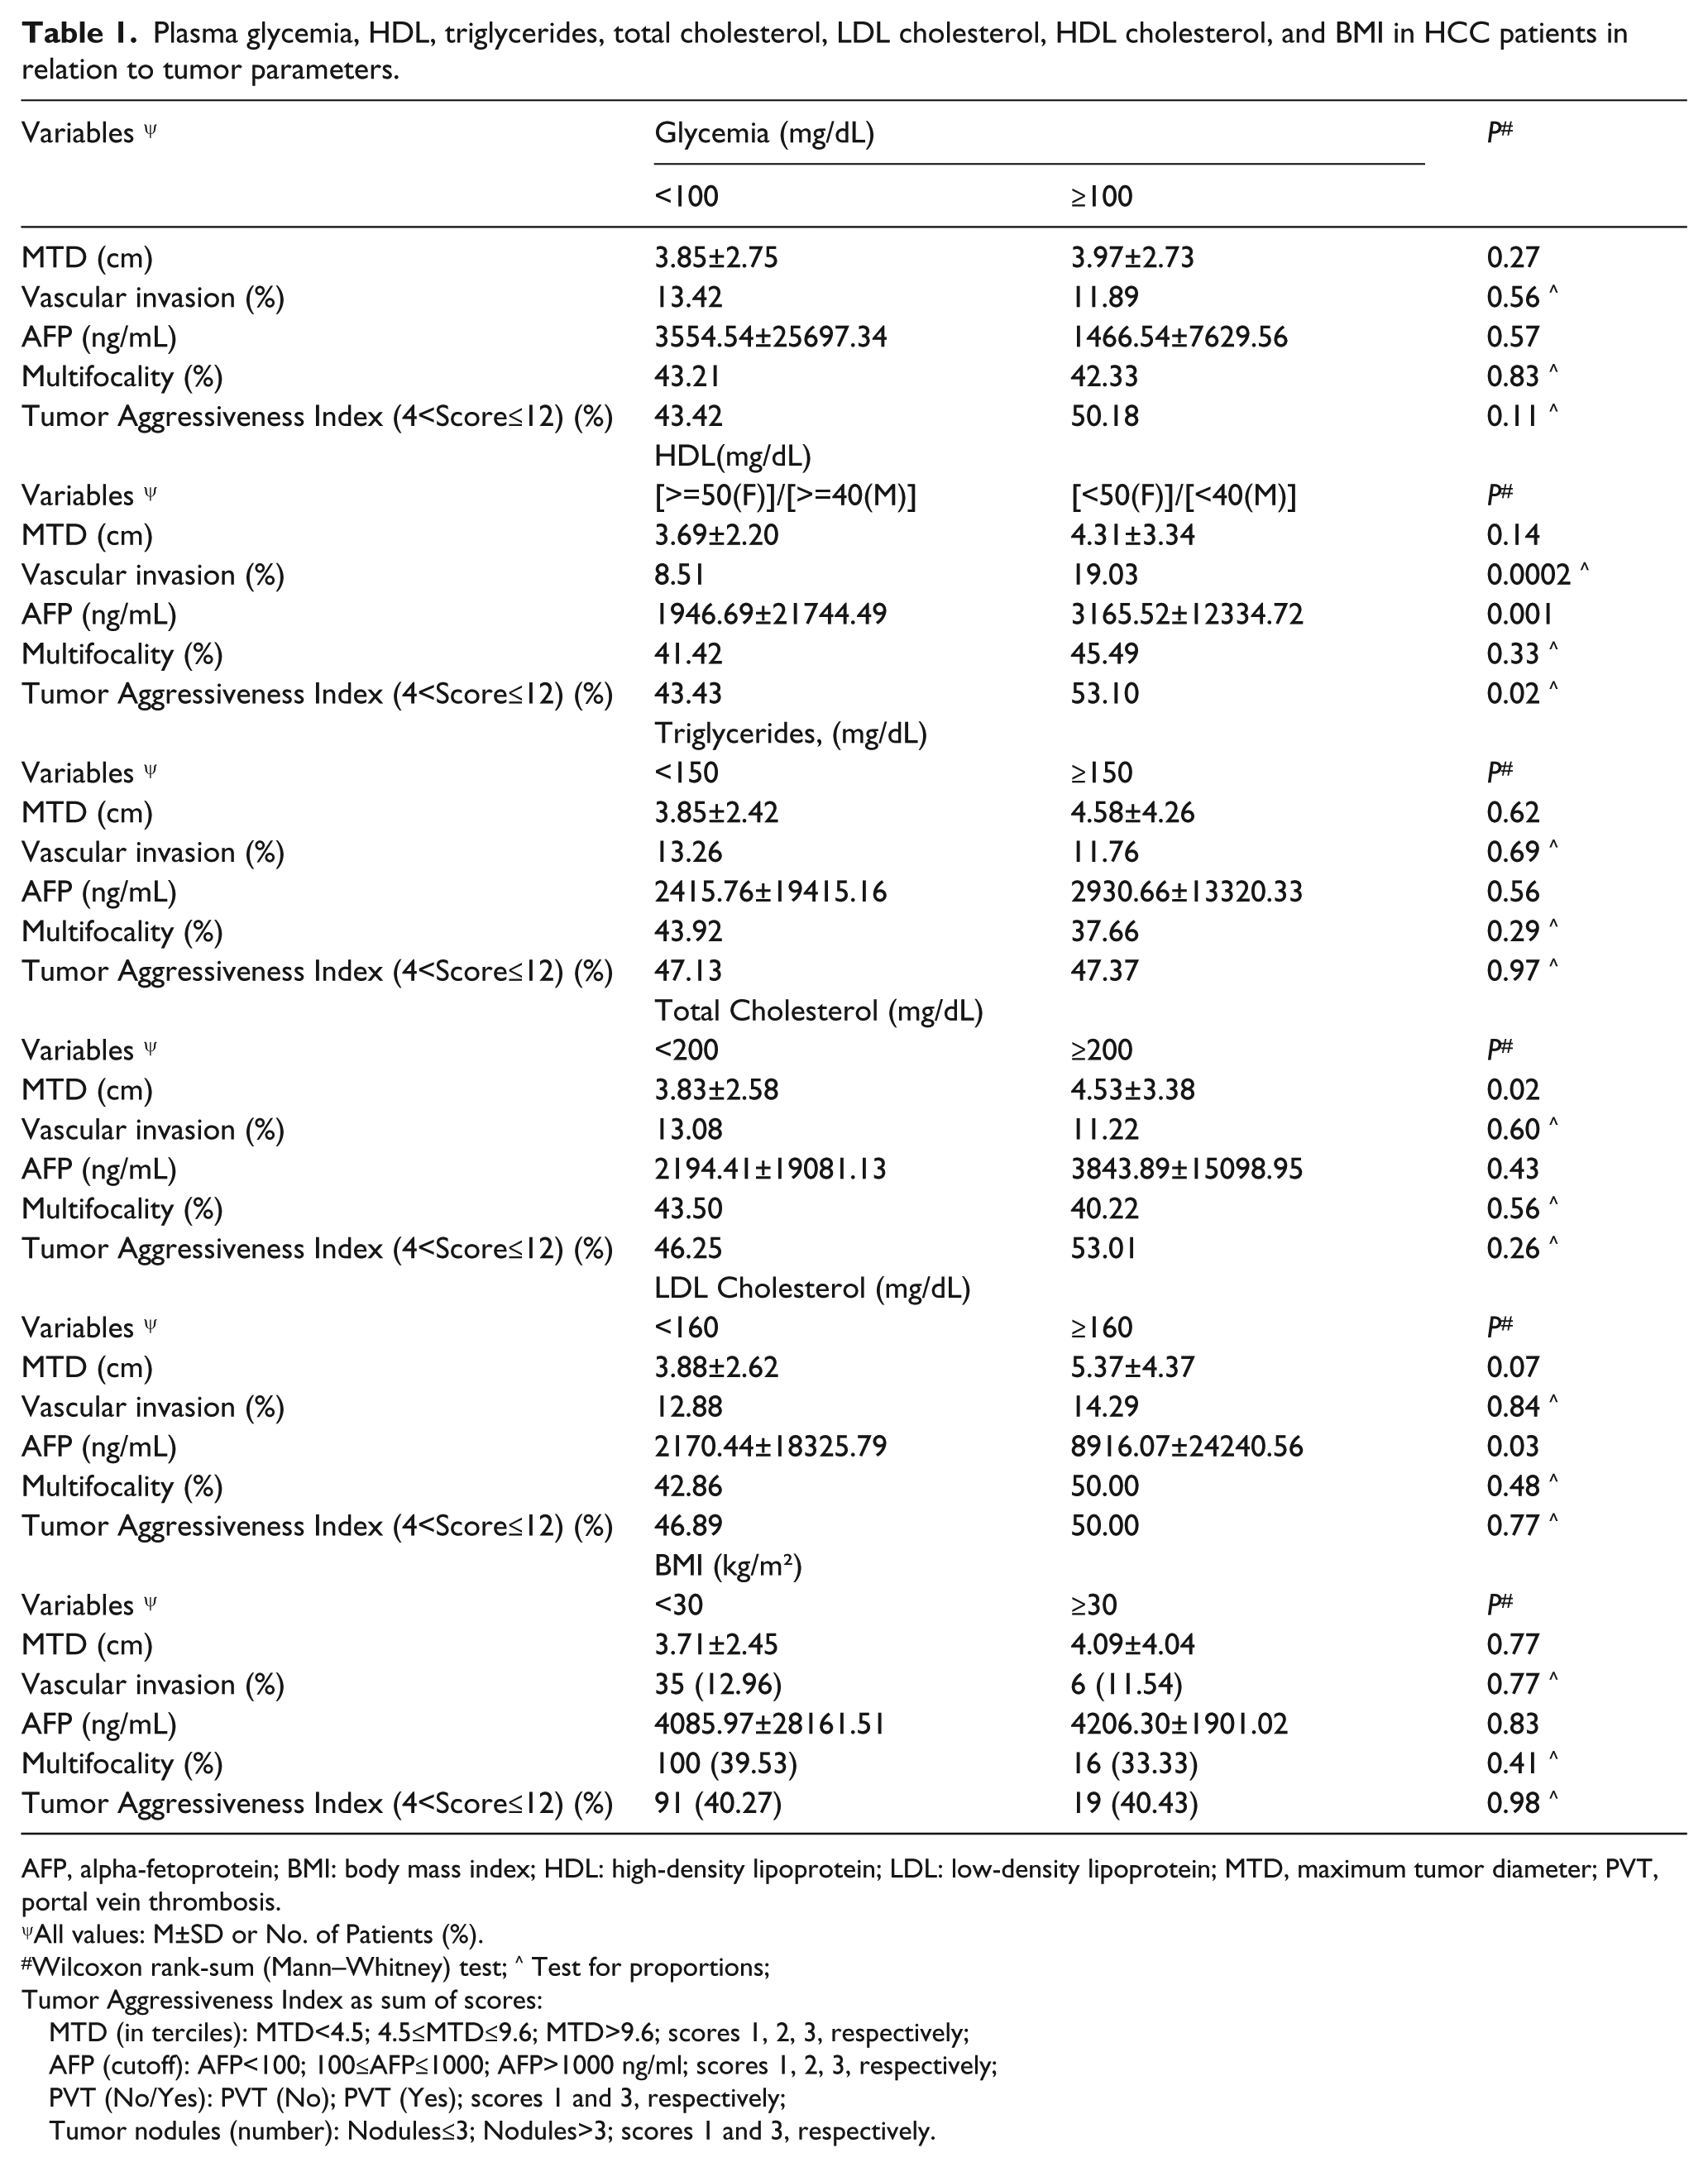
AFP, alpha-fetoprotein; BMI: body mass index; HDL: high-density lipoprotein; LDL: low-density lipoprotein; MTD, maximum tumor diameter; PVT, portal vein thrombosis.
All values: M±SD or No. of Patients (%).
Wilcoxon rank-sum (Mann–Whitney) test; ^ Test for proportions;
Tumor Aggressiveness Index as sum of scores:
MTD (in terciles): MTD<4.5; 4.5≤MTD≤9.6; MTD>9.6; scores 1, 2, 3, respectively;
AFP (cutoff): AFP<100; 100≤AFP≤1000; AFP>1000 ng/ml; scores 1, 2, 3, respectively;
PVT (No/Yes): PVT (No); PVT (Yes); scores 1 and 3, respectively;
Tumor nodules (number): Nodules≤3; Nodules>3; scores 1 and 3, respectively.
A linear regression model of the Tumor Aggressiveness Index was then calculated on single metabolism variables of glycemia, HDL cholesterol, LDL cholesterol, total cholesterol, triglycerides, and BMI. Significance was found only for HDL cholesterol, both as a single variable (Table 2A) and in the final linear regression model, using the stepwise method (Table 2B). The calculation was repeated after excluding patients with total bilirubin levels
Linear regression model of the Tumor Aggressiveness Index score on single variables glycemia, HDL, triglycerides, total cholesterol, LDL, and BMI (
Final multiple linear regression model in the stepwise method of the Tumor Aggressiveness Index score on glycemia, HDL, triglycerides, total cholesterol, LDL, and BMI, all in categories and included together in the model (
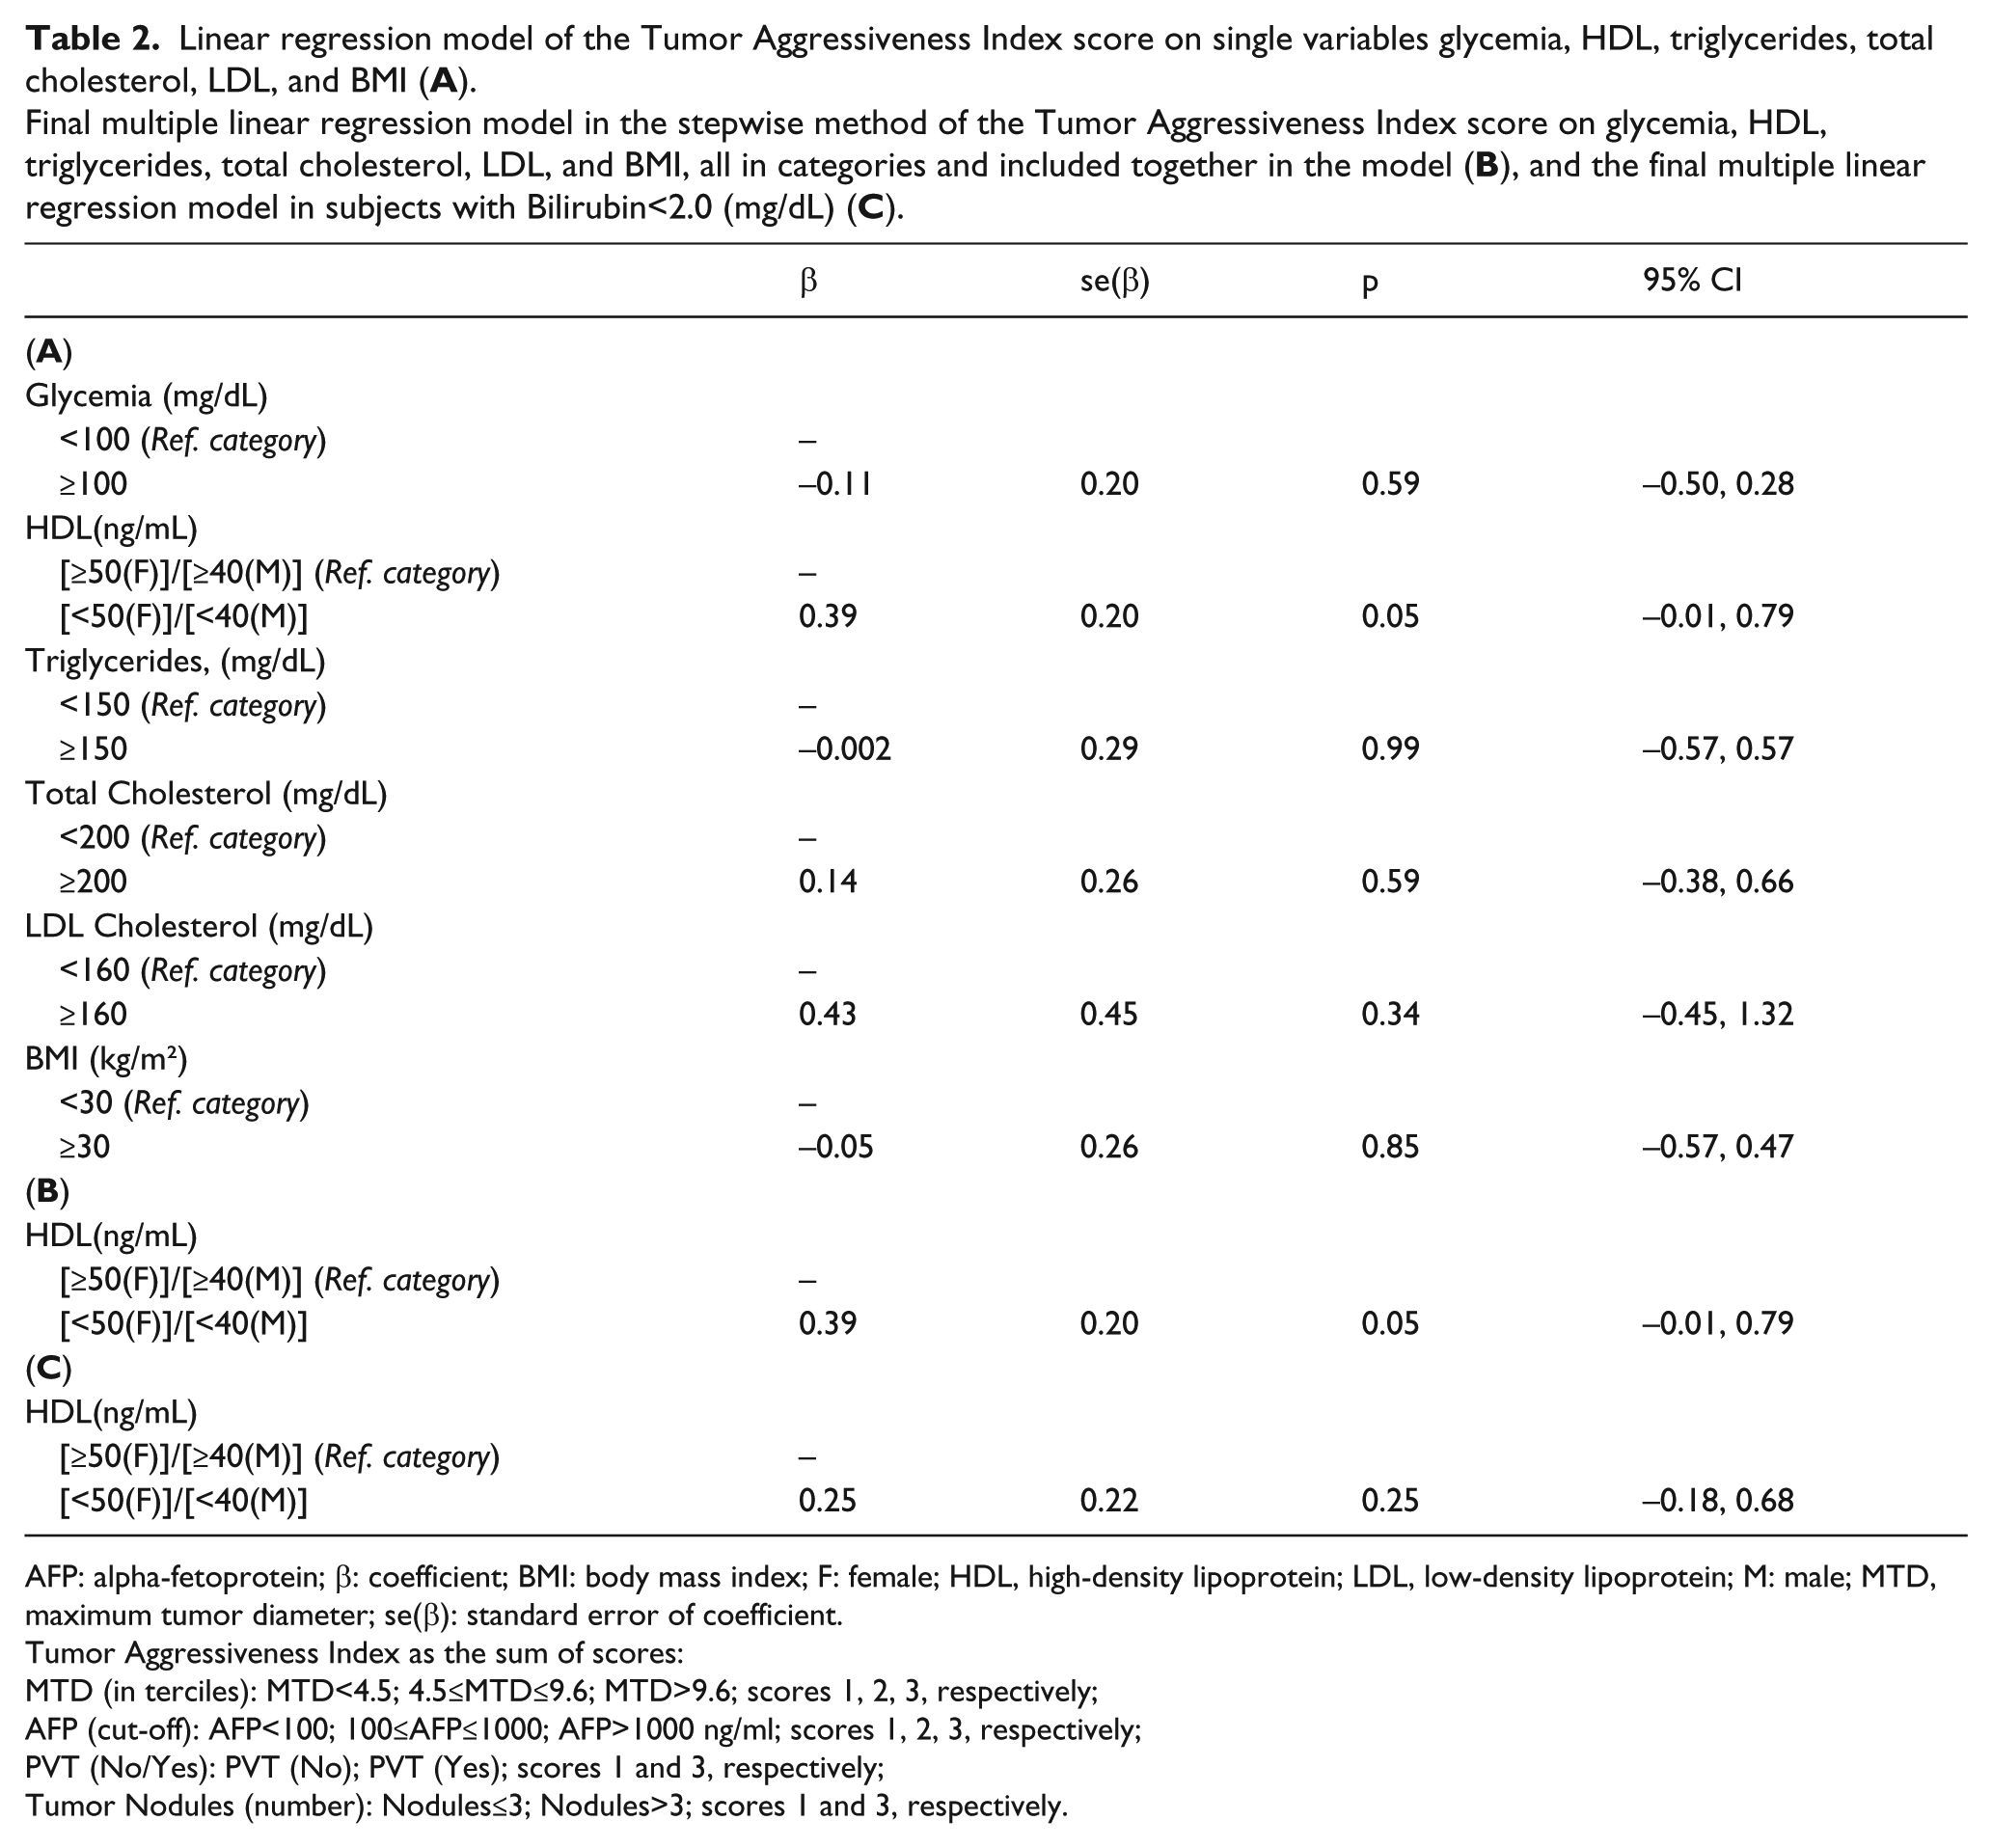
AFP: alpha-fetoprotein; β: coefficient; BMI: body mass index; F: female; HDL, high-density lipoprotein; LDL, low-density lipoprotein; M: male; MTD, maximum tumor diameter; se(β): standard error of coefficient.
Tumor Aggressiveness Index as the sum of scores:
MTD (in terciles): MTD<4.5; 4.5≤MTD≤9.6; MTD>9.6; scores 1, 2, 3, respectively;
AFP (cut-off): AFP<100; 100≤AFP≤1000; AFP>1000 ng/ml; scores 1, 2, 3, respectively;
PVT (No/Yes): PVT (No); PVT (Yes); scores 1 and 3, respectively;
Tumor Nodules (number): Nodules≤3; Nodules>3; scores 1 and 3, respectively.
Survival and HDL cholesterol
The survival of patients with all of the lipid parameters as single variables was examined, using the Cox proportional hazard method for death (Table 3). The highest HR for death was found for high HDL cholesterol (HR 1.52), and was significant at the P<0.001 level. In the final model, HDL cholesterol was significant for death, HR=1.69, P=0.003. Furthermore, after excluding patients with total bilirubin levels
Cox proportional hazard models for death, on single variables (
Final multiple Cox proportional hazard models for death, in the stepwise method, on all variables included together in the model (
All models were adjusted for age and gender, and all variables in categories.
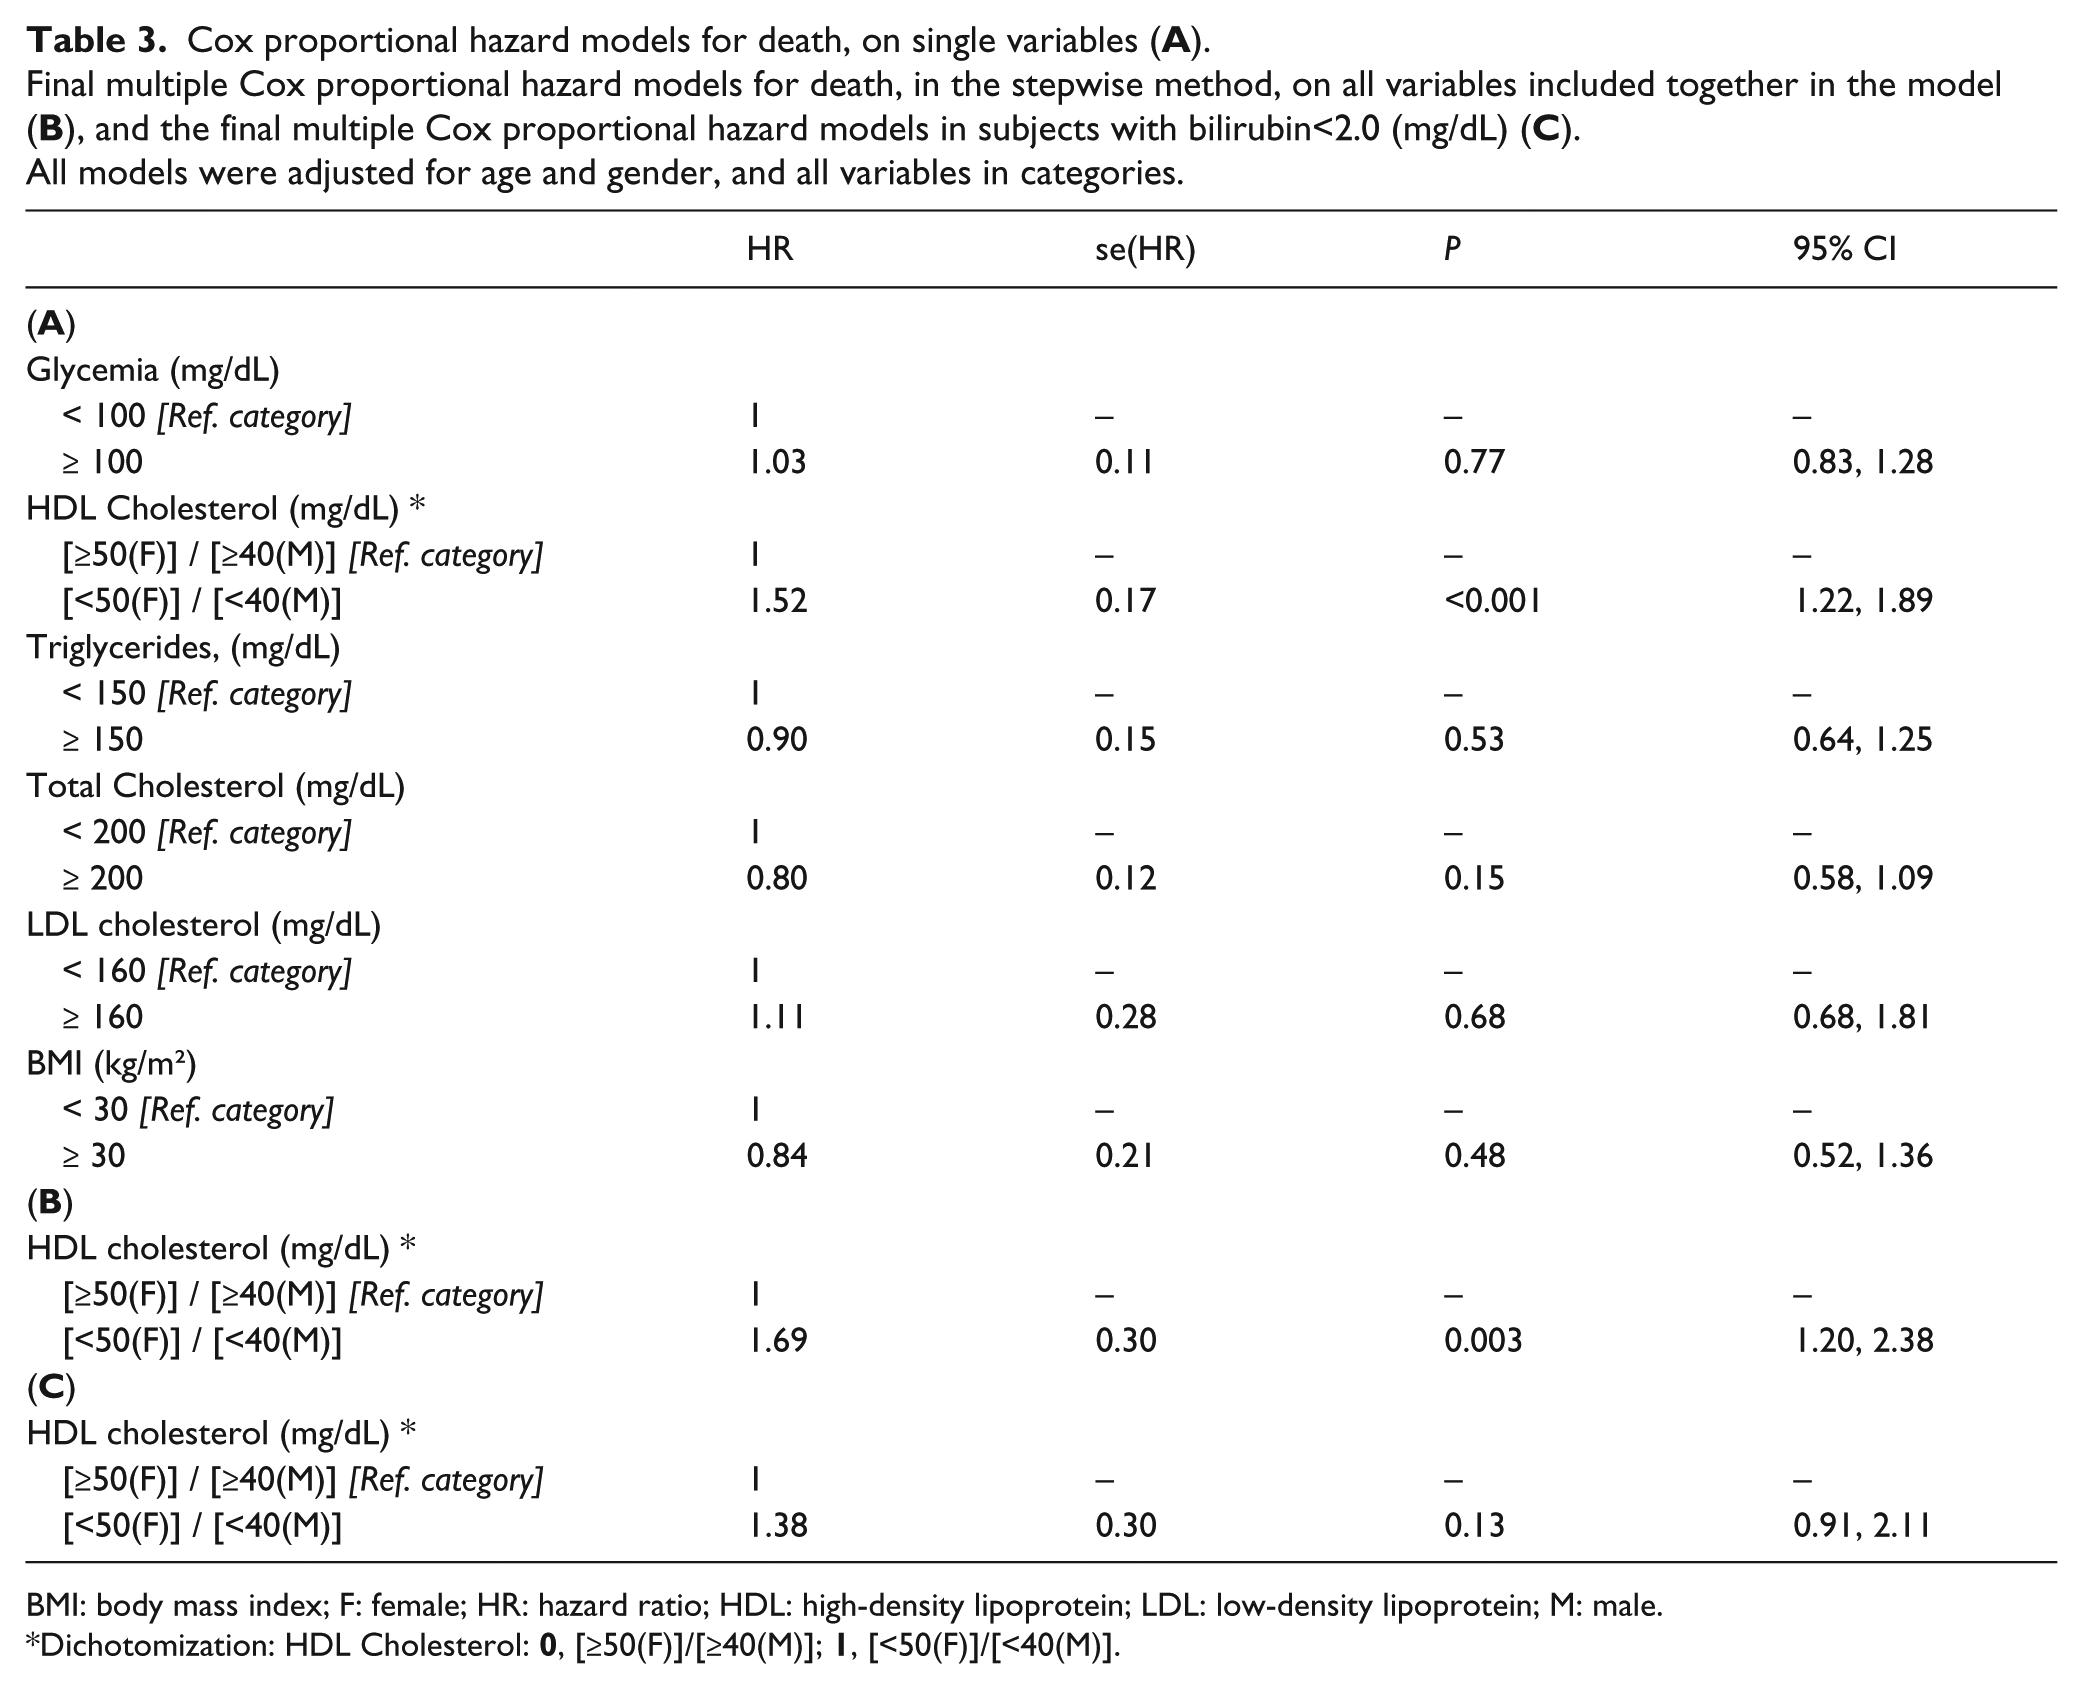
BMI: body mass index; F: female; HR: hazard ratio; HDL: high-density lipoprotein; LDL: low-density lipoprotein; M: male.
Dichotomization: HDL Cholesterol:
Likewise, in a Kaplan–Meier survival probability curve (Figure 1), low HDL cholesterol was shown to be significant for enhanced survival (Log-rank test, P=0.0009 and Wilcoxon test, P=0.0001). The sensitivity and specificity of HDL for death was 41.76% (CI 37.98%, 45.55%) and 61.41% (CI 57.68%, 45.55%) in the total cohort. Similar calculations for patients with bilirubin <2.0mg/dL were: sensitivity and specificity of HDL for death: 36.14% (CI 32.03%, 40.26%) and 62.04% (CI 57.88%, 66.20%). The positive predictive value in the total cohort was 54.2% and the negative predictive value was 49.1%.
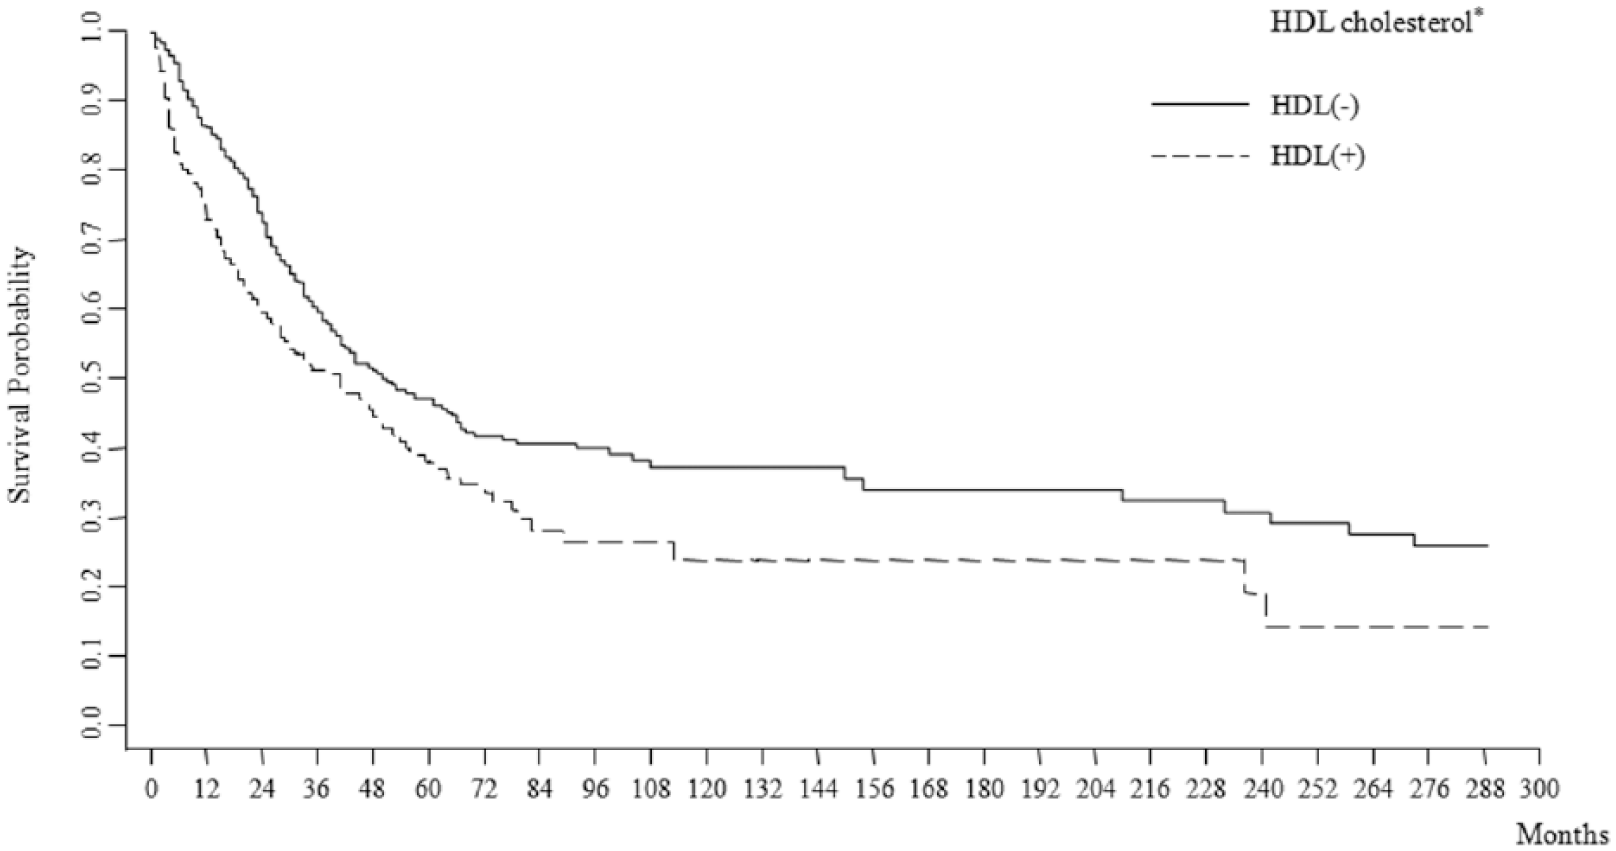
Kaplan–Meier survival probability among HCC patients categorized according to HDL (ng/mL). Log-rank test: P=0.002; Wilcoxon (Breslow) test: P=0.0003; test for the trend of survivor functions across groups: P=0.004.
Patient parameters according to HCC etiology
Since there may be different patterns of lipid metabolism amongst the various etiological types of HCC and conversely, and since lipids can also alter HCC biology, we examined the clinical and lipid profiles of the same patients as above, but stratified them according to single disease of etiology, as shown in Table 4 (patients with two diseases together, such as HBV plus HCV, were excluded). NASH patients had a lower percentage of cirrhosis (80.33%) compared with HBV, HCV, and alcohol patients (all >90%), and had a greatly increased percentage of patients with diabetes type II (NASH 63.33, alcohol 43.59, HCV 26.65, and HBV 18.18), P<0.001. NASH patients had a similarly much higher percentage of patients with obesity (NASH 54.55, alcohol 17.50, HCV 6.72, HBV 8.57), P <0.001. NASH and alcohol-associated patients both had significant glycemia compared with patients with HBV or HCV. HBV patients had significantly higher levels of both total cholesterol and LDL cholesterol than HCV patients, P
Hepatocellular carcinoma patient parameters according to etiology.
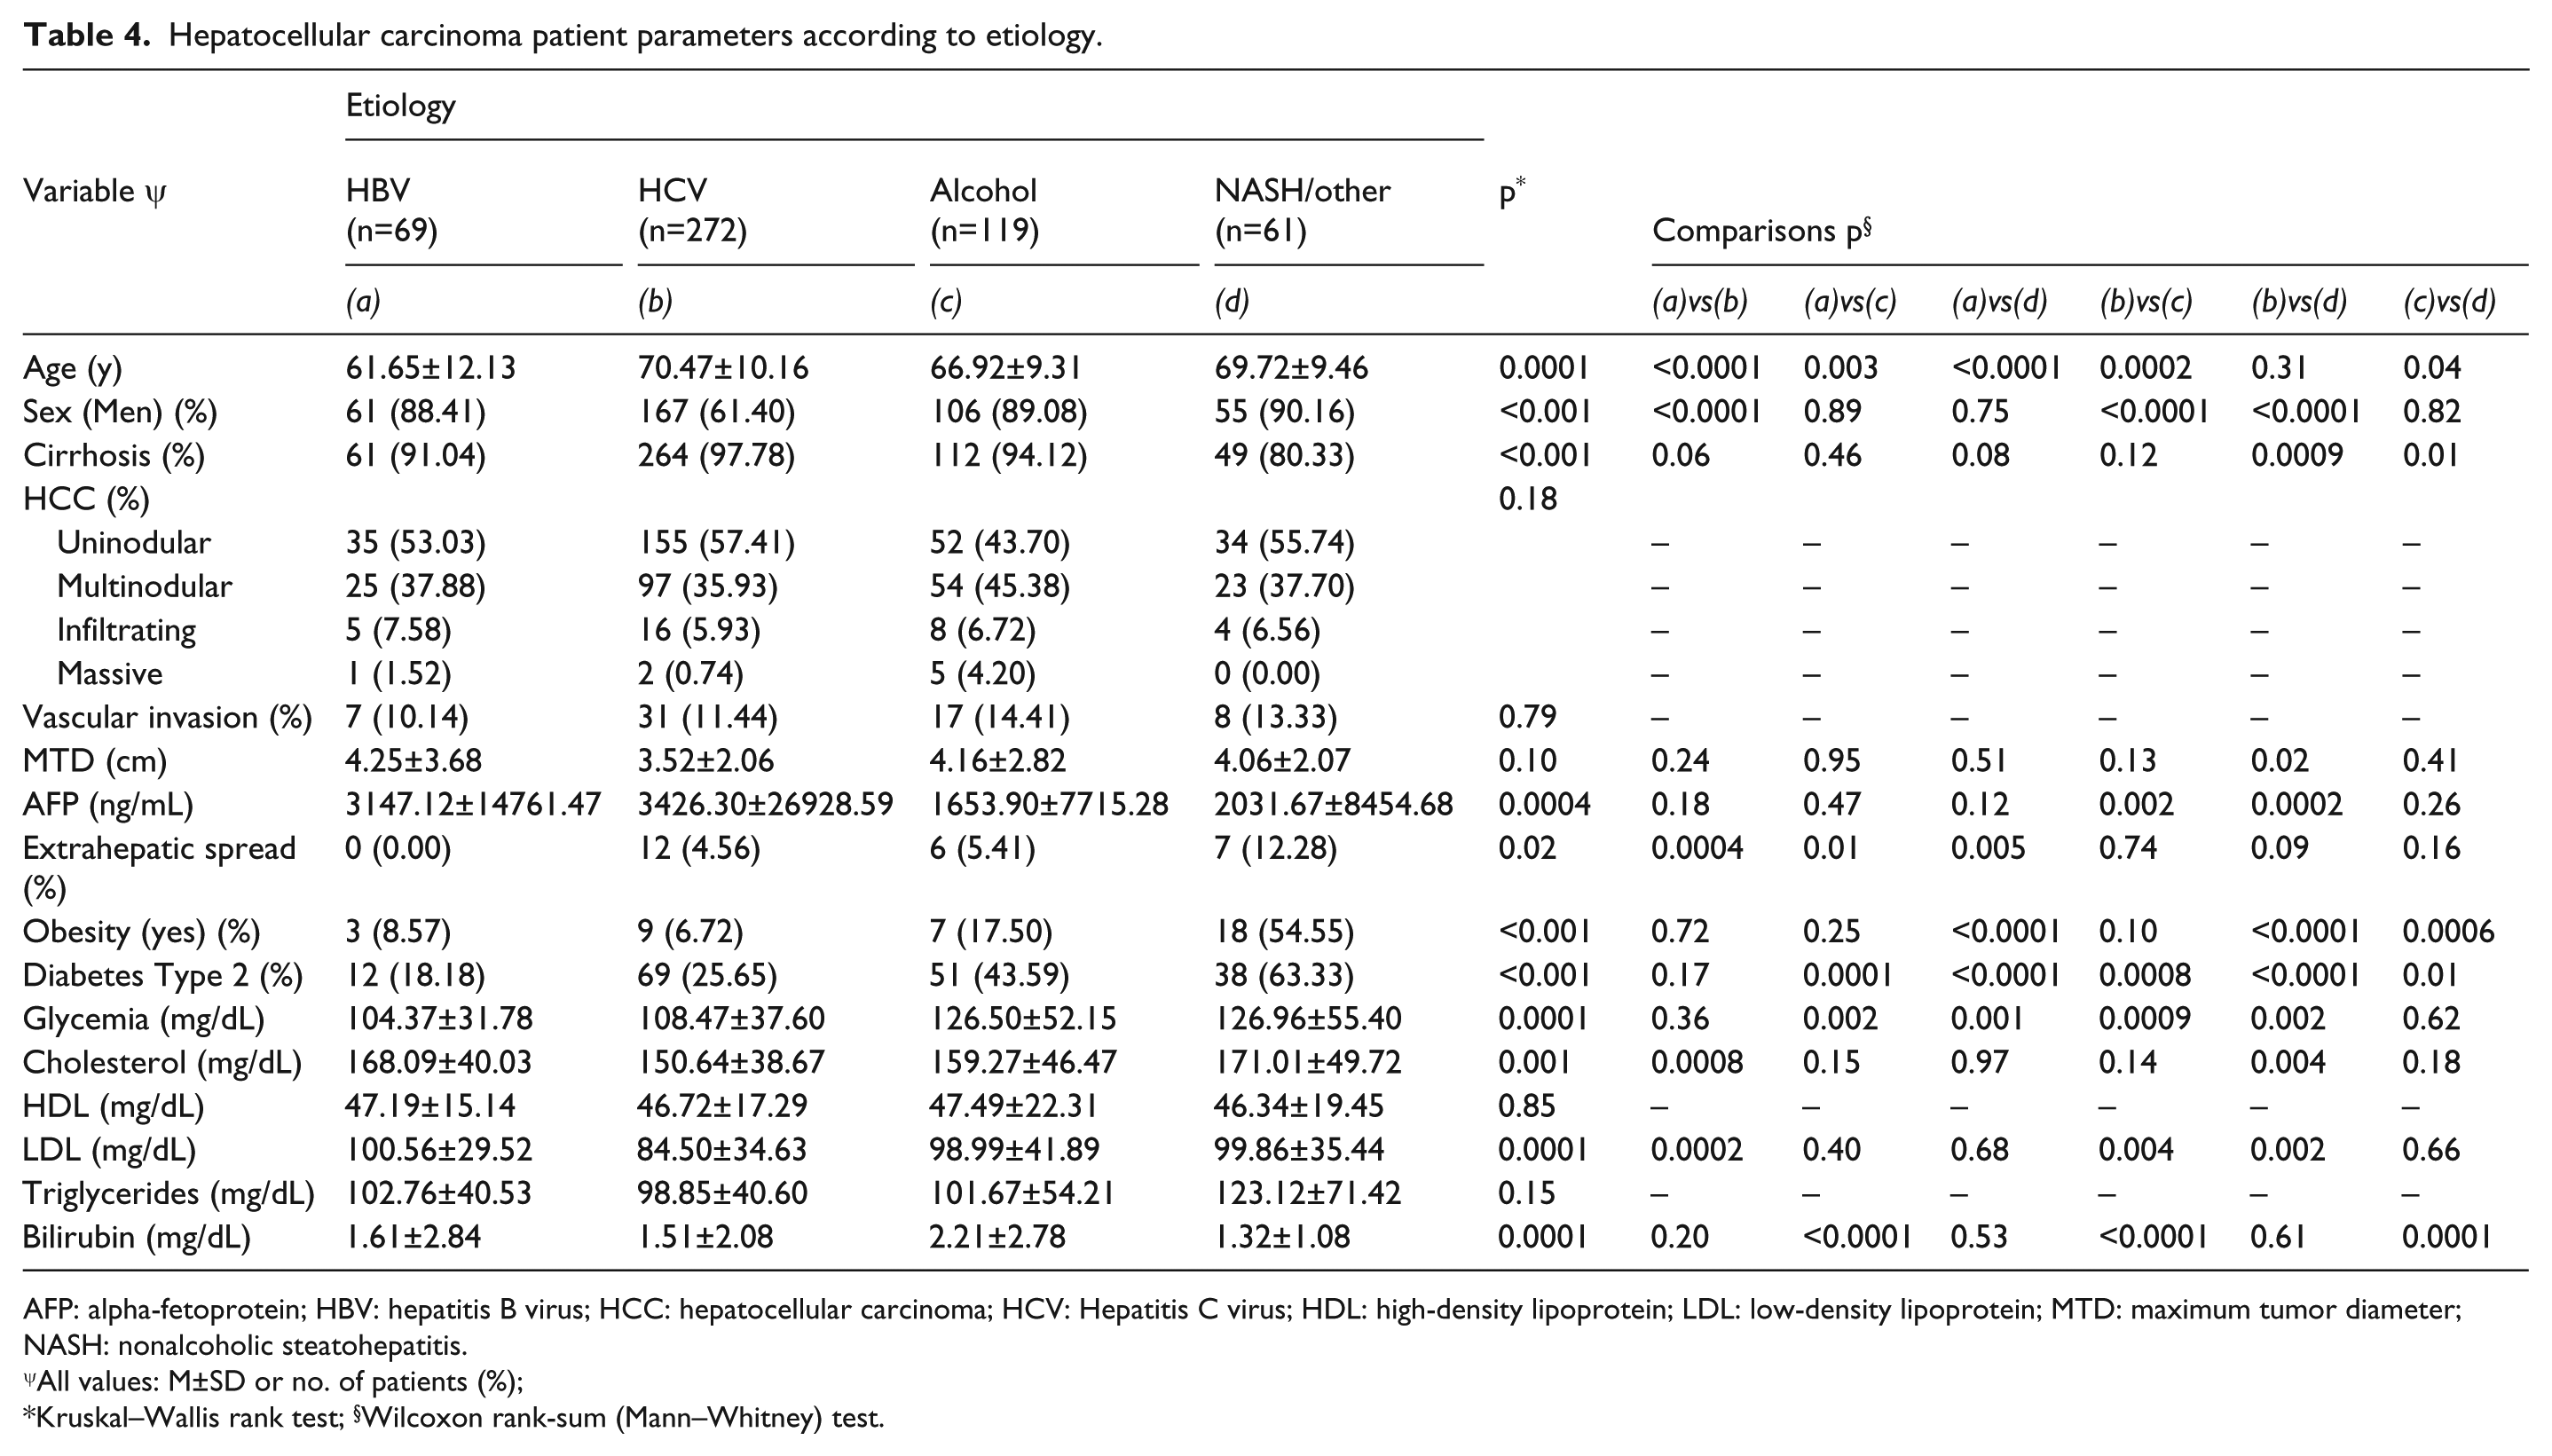
AFP: alpha-fetoprotein; HBV: hepatitis B virus; HCC: hepatocellular carcinoma; HCV: Hepatitis C virus; HDL: high-density lipoprotein; LDL: low-density lipoprotein; MTD: maximum tumor diameter; NASH: nonalcoholic steatohepatitis.
All values: M±SD or no. of patients (%);
Kruskal–Wallis rank test; §Wilcoxon rank-sum (Mann–Whitney) test.
With regard to tumor characteristics, tumor multifocality, percentage PVT, and MTD were similar across etiological groups. However, AFP levels were significantly higher in patients with HCV compared with either alcohol or NASH, but the ranges in values were large.
Discussion
Plasma lipid changes have been reported in the presence of many cancer types and have given rise to the idea that they may reflect an altered metabolism of the host milieu, which is involved in the carcinogenic process, such as inflammation-associated growth cytokines. Changes in plasma lipid profile levels have been reported in association with hepatitis infection, cirrhosis, and hepatitis-associated HCCs.1-3,7,15,27 Furthermore, there are multiple reports of altered plasma lipid profiles in obesity- or metabolic syndrome-associated HCCs8,9,19,37,39 Thus, both hepatitis-associated HCC and, separately, obesity/NAFLD-associated HCC, seem to occur in the presence of altered lipid metabolism.
Also, metabolic and lipid profiles are found to be altered not only in the plasma of HCC patients, but also in the tumor lipid droplets plus tumor mitochondria and tumor membranes,16,17 in the presence or absence of obesity. Alterations in lipids have been thought to influence not only metabolism, but also gene and tumor biology.28,29 Thus, several studies have attempted to alter the lipid composition of tumors, both experimentally and in patients,30-32 as well as indirectly, by targeting the obesity-associated inflammation. 33 There may be different patterns of lipid metabolism amongst the various etiological types of HCC7,8,14,15,27 and conversely, since lipids can also alter HCC biology,6,28,29 we examined the clinical and lipid profiles of a cohort of HCC patients with defined single etiologies, to determine whether there might be any relationship between HCC biology and levels of several commonly measured plasma lipids.
In this HCC cohort, 52.21% of the patients had HCV-associated HCC, 13.24% had HBV, 22.84% had alcoholism, and 11.71% had NASH. We examined the six metabolic profile components of glycemia, total cholesterol, HDL, LDL, triglycerides, and BMI in relation to each of the four parameters of HCC aggressiveness, namely MTD, percentage patients with PVT, percentage tumor multifocality and mean AFP levels, as well as all four parameters together, called the Tumor Aggressiveness Index (Table 1). MTD was significantly associated with changes in total cholesterol and LDL cholesterol, and PVT was significantly associated only with HDL cholesterol. AFP levels were significantly associated with both HDL and LDL cholesterol. In both a linear and a final multiple linear regression model, using the stepwise method, only HDL cholesterol was found to be significantly associated with the Tumor Aggressiveness Index (Table 2). We examined the survival of patients, using the Cox proportional hazard models for death, and found that the highest HR for death was found for HDL cholesterol on both the single lipid variables and in the final model with all the variables included together. We then examined the HCC patients separately according to the four etiologies of HCV, HBV, alcohol, and NASH. NASH patients had significantly less cirrhosis than in the other etiologies, although the tumor characteristics were similar amongst different etiologies, except for AFP levels, which were higher in the HCV than in the alcohol- or NASH-associated patients (Table 4). However, the lipid profiles had significant differences among the four etiologies. Thus, NASH- and alcohol-associated patients both had significant glycemia compared with patients with either HBV or HCV, and HBV patients had significantly higher levels of both total cholesterol and LDL cholesterol than HCV patients (P=0.0001). Tumor aggressiveness was associated with HDL cholesterol in HCV patients, but tumor aggressiveness was instead significantly associated with both LDL cholesterol and BMI in NASH patients. Thus, for the first time, we have shown a relationship between lipid parameters and indices of HCC growth.
There might several possible lipid changes that are involved in HCC biological characteristics such as growth (MTD). Changes in tumor membrane lipids alter membrane fluidics and thus growth factor signaling, as well as HCC properties such as tumor invasiveness.6,15 Postulated mechanisms have also included chronic inflammation as well as signaling via adipokines, such as leptin. A role for lipids and obesity in altering the intestinal microbiome, with subsequent effects on tumorigenesis, is being intensively studied. It is becoming clearer that free radicals are also involved in tumor biology, possibly through obesity-associated inflammation or through lipid-related changes.34-36 Thus, although obesity and metabolic syndrome, and their attendant lipid changes, have been shown to be associated with HCC development, it is increasingly clear that in non-obesity/NASH- associated HCC, there are also many associated lipid changes,37-40 which are likely to contribute to HCC biology and are thus coming to be viewed as a target for potential HCC therapies.8-11,31-33,36
There were some clear limitations to this study (n=521), including the relatively small number of patients in the different subgroups—especially in the etiological subgroups. Furthermore, although we found associations for HDL and tumor parameters, whether they were cause or consequence cannot be definitively established. The fact that the HCC–HDL relationships held up even when patients with elevated blood bilirubin levels were excluded from the analysis (Tables 2C and 3C), indicated to us that the lipid changes were not a consequence of compromised liver function, as suggested in other studies. 2 Furthermore, some patients from the larger dataset were excluded from this analysis due to missing lipids data. Thus, these findings might not be useful in screening, but they do have potential for prognosis considerations.
Conclusions
Both the Tumor Aggressiveness Index and the PVT were significantly associated with HDL levels. Significance for HDL was also found in a final linear regression model of the tumor aggressiveness index, regardless of bilirubin levels. The highest HR for death was also found for high HDL. When different etiological causes were compared, there were no significant differences for HDL.
Footnotes
Author contributions
Brian I. Carr, Gianluigi Giannelli, and Vito Guerra contributed equally to this study.
Declaration of conflicting interest
The author(s) declared no potential conflicts of interest with respect to the research, authorship, and/or publication of this article.
Funding
The author(s) received no financial support for the research, authorship, and/or publication of this article.