
Abstract
Objective:
PTTG3P, which maps to chromosome 8q13.1, is a novel long noncoding RNA with oncogenic properties in cancers. In this study, we aimed to investigate the prognostic value of PTTG3P in terms of overall survival and recurrence-free survival and its potential regulatory network and transcription pattern in patients with hepatocellular carcinoma.
Patients and Methods:
An in silico analysis was performed using data from the Cancer Genome Atlas-Liver Hepatocellular Carcinoma.
Results:
Results showed that the high PTTG3P expression group was consistently associated with shorter overall survival and recurrence-free survival, regardless of pathological stages or tumor grade. High PTTG3P expression was an independent indicator of shorter overall survival (hazard ratio: 2.177, 95% confidence interval: 1.519-3.121, P < .001) and recurrence-free survival (hazard ratio: 2.222, 95% confidence interval: 1.503-3.283, P < .001). The genes strongly coexpressed with PTTG3P are enriched in several KEGG pathways that are closely associated with carcinogenesis and malignant transformation of hepatocellular carcinoma.
Conclusion:
Based on the findings, we infer that PTTG3P expression might serve as an independent prognostic biomarker in primary hepatocellular carcinoma.
Introduction
Hepatocellular carcinoma (HCC), which accounts for over 90% cases of primary liver cancers, is one of the most common malignancies and a leading cause of cancer-related death across the world. 1,2 Although the advances in diagnostic and therapeutic strategies have improved the prognosis of this disease, the 5-year overall survival (OS) is still unsatisfactory. 3 Therefore, identification of reliable prognostic biomarkers can support better management of HCC and improve patient survival.
Long noncoding RNAs (lncRNAs) are a group of non-coding RNAs that are longer 200 nt. In the past decades, many studies revealed that they are essential regulators in diverse biological processes, such as cell cycle, cell proliferation, hemostasis, stress responses, angiogenesis, and apoptosis. 4 Due to their critical physiological functions, their dysregulations also participate in a series of diseases, including cancers. 5 Dozens of lncRNAs that are involved in the carcinogenic and pathological development of HCC have been identified, such as HOTTIP, 6 PXN-AS1, 7 HOTAIR, 8 and HNF1A-AS1. 9 Some of the lncRNAs might also have prognostic value in HCC. For example, higher lncRNA-ATB expression was an independent predictor of mortality and disease progression. 10 A risk core model based on 4 lncRNAs (RP11-322E11.5, RP11-150O12.3, AC093609.1, and CTC-297N7.9) might independently predict OS of HCC. 11
Pituitary tumor-transforming 3, PTTG3P, which maps to chromosome 8q13.1, is a novel lncRNA with oncogenic properties in cancers. Upregulated PTTG3P can stimulate gastric cancer cell proliferation, migration, and invasion both in vitro and in vivo. 12 One recent study reported that it promotes HCC cell growth and metastasis by targeting PTTG1 and activating the PI3K/AKT signaling pathway. 13 In this study, the authors also demonstrated that PTTG3P upregulation was an independent prognostic factor for unfavorable OS in patients with HCC. 13 However, the sample size of this study was relatively small (n = 90) and OS data beyond 5 years were not available. Therefore, although PTTG3P might serve as a potential prognostic biomarker, its prognostic value needs further validation. In this study, using data from the Cancer Genome Atlas–Liver and Hepatocellular Cancer (TCGA-LIHC) that has genomic and survival data from over 300 primary patients with HCC, we investigated the prognostic value of PTTG3P in terms of OS and recurrence-free survival (RFS) and its potential regulatory network and transcription pattern.
Materials and Methods
Data Analysis Based on TCGA-LIHC
The level 3 data of patients with primary HCC in TCGA-LIHC were downloaded from the UCSC Xena browser (https://xenabrowser.net/). 14 Only the proportion of patients without neoadjuvant therapy and who had intact OS and RNA-seq data were included. The screening process of the illegible patients was summarized in Supplementary Figure 1. The clinicopathological, genomic, and survival data, including age at diagnosis, gender, liver fibrosis, the presence of residual tumor, histological grade, pathologic stage, radiation therapy, postoperative drug therapy, recurrence status, RFS times, OS status, and OS times, were extracted for the following analysis.
In Silico Analysis of the Alternative Transcription of PTTG3
The alternative transcripts of PTTG3P and its exon usage in HCC and normal liver tissues were analyzed using TSVdb (http://www.tsvdb.com/plot.html), 15 which is a web tool for TCGA splicing variants analysis.
In Silico Analysis Using cBioPortal for Cancer Genomics and String
The genes strongly coexpressed with PTTG3P in HCC (Spearman r ≥ 0.6) were identified using cBioPortal for Cancer Genomics. 16 Then the potential molecular interactions between these genes and their enrichment in KEGG pathways were identified using String 10.5 (https://string-db.org/) by setting 0.9 (highest confidence) as the minimum required interaction score.
Statistical Analysis
Statistical analysis was performed using GraphPad Prism 7.04 (GraphPad Inc, La Jolla, California) and SPSS 25.0 software package (SPSS Inc, Chicago, Illinois). For multiple group comparison, 1-way analysis of variance with post hoc Tukey multiple comparisons test was performed. For 2-group comparison, Welch unequal variances t test was applied to detect the differences. Kaplan-Meier survival curves were generated using GraphPad Prism 7.04. Patients were separated into 2 groups according to the Youden Index of PTTG3P expression in the receiver operating characteristic (ROC) analysis for death or recurrence detection. Log-rank test was performed to determine the significance of the difference between the survival curves. Univariate and multivariate Cox regression models were used to analyze the prognostic significance of PTTG3P expression. Only those variables with P value ≤.10 in the univariate analysis were adjusted in multivariate analysis. P < .05 was considered to be statistically significant.
Results
PTTG3P Is Significantly Upregulated in HCC
After the screening process, a total of 353 primary HCC cases were identified as eligible research candidates (Supplementary Figure 1). Among the patients, 49 cases had matched adjacent normal tissues analyzed for gene expression. Using normalized RNA-seq data recorded in TCGA-LIHC, we compared PTTG3P expression in primary HCC tissues and the corresponding adjacent normal tissues. In the 49 paired tissues, PTTG3P expression was significantly higher in HCC tissues than in normal tissues (P < .001; Figure 1A). Then we examined its expression in different HCC subgroups. Results showed that PTTG3P expression was associated with the differentiation status of HCC tumors. The well-differentiated tumor (G1) had the lowest PTTG3P expression, while the poorly differentiated and the undifferentiated tumors (G3/G4) had the highest PTTG3P expression (Figure 1B). In addition, PTTG3P expression also significantly elevated in stage II tumors compared with stage I tumors (Figure 1C). But the differences among stage II/III/IV tumors were not significant (Figure 1C).
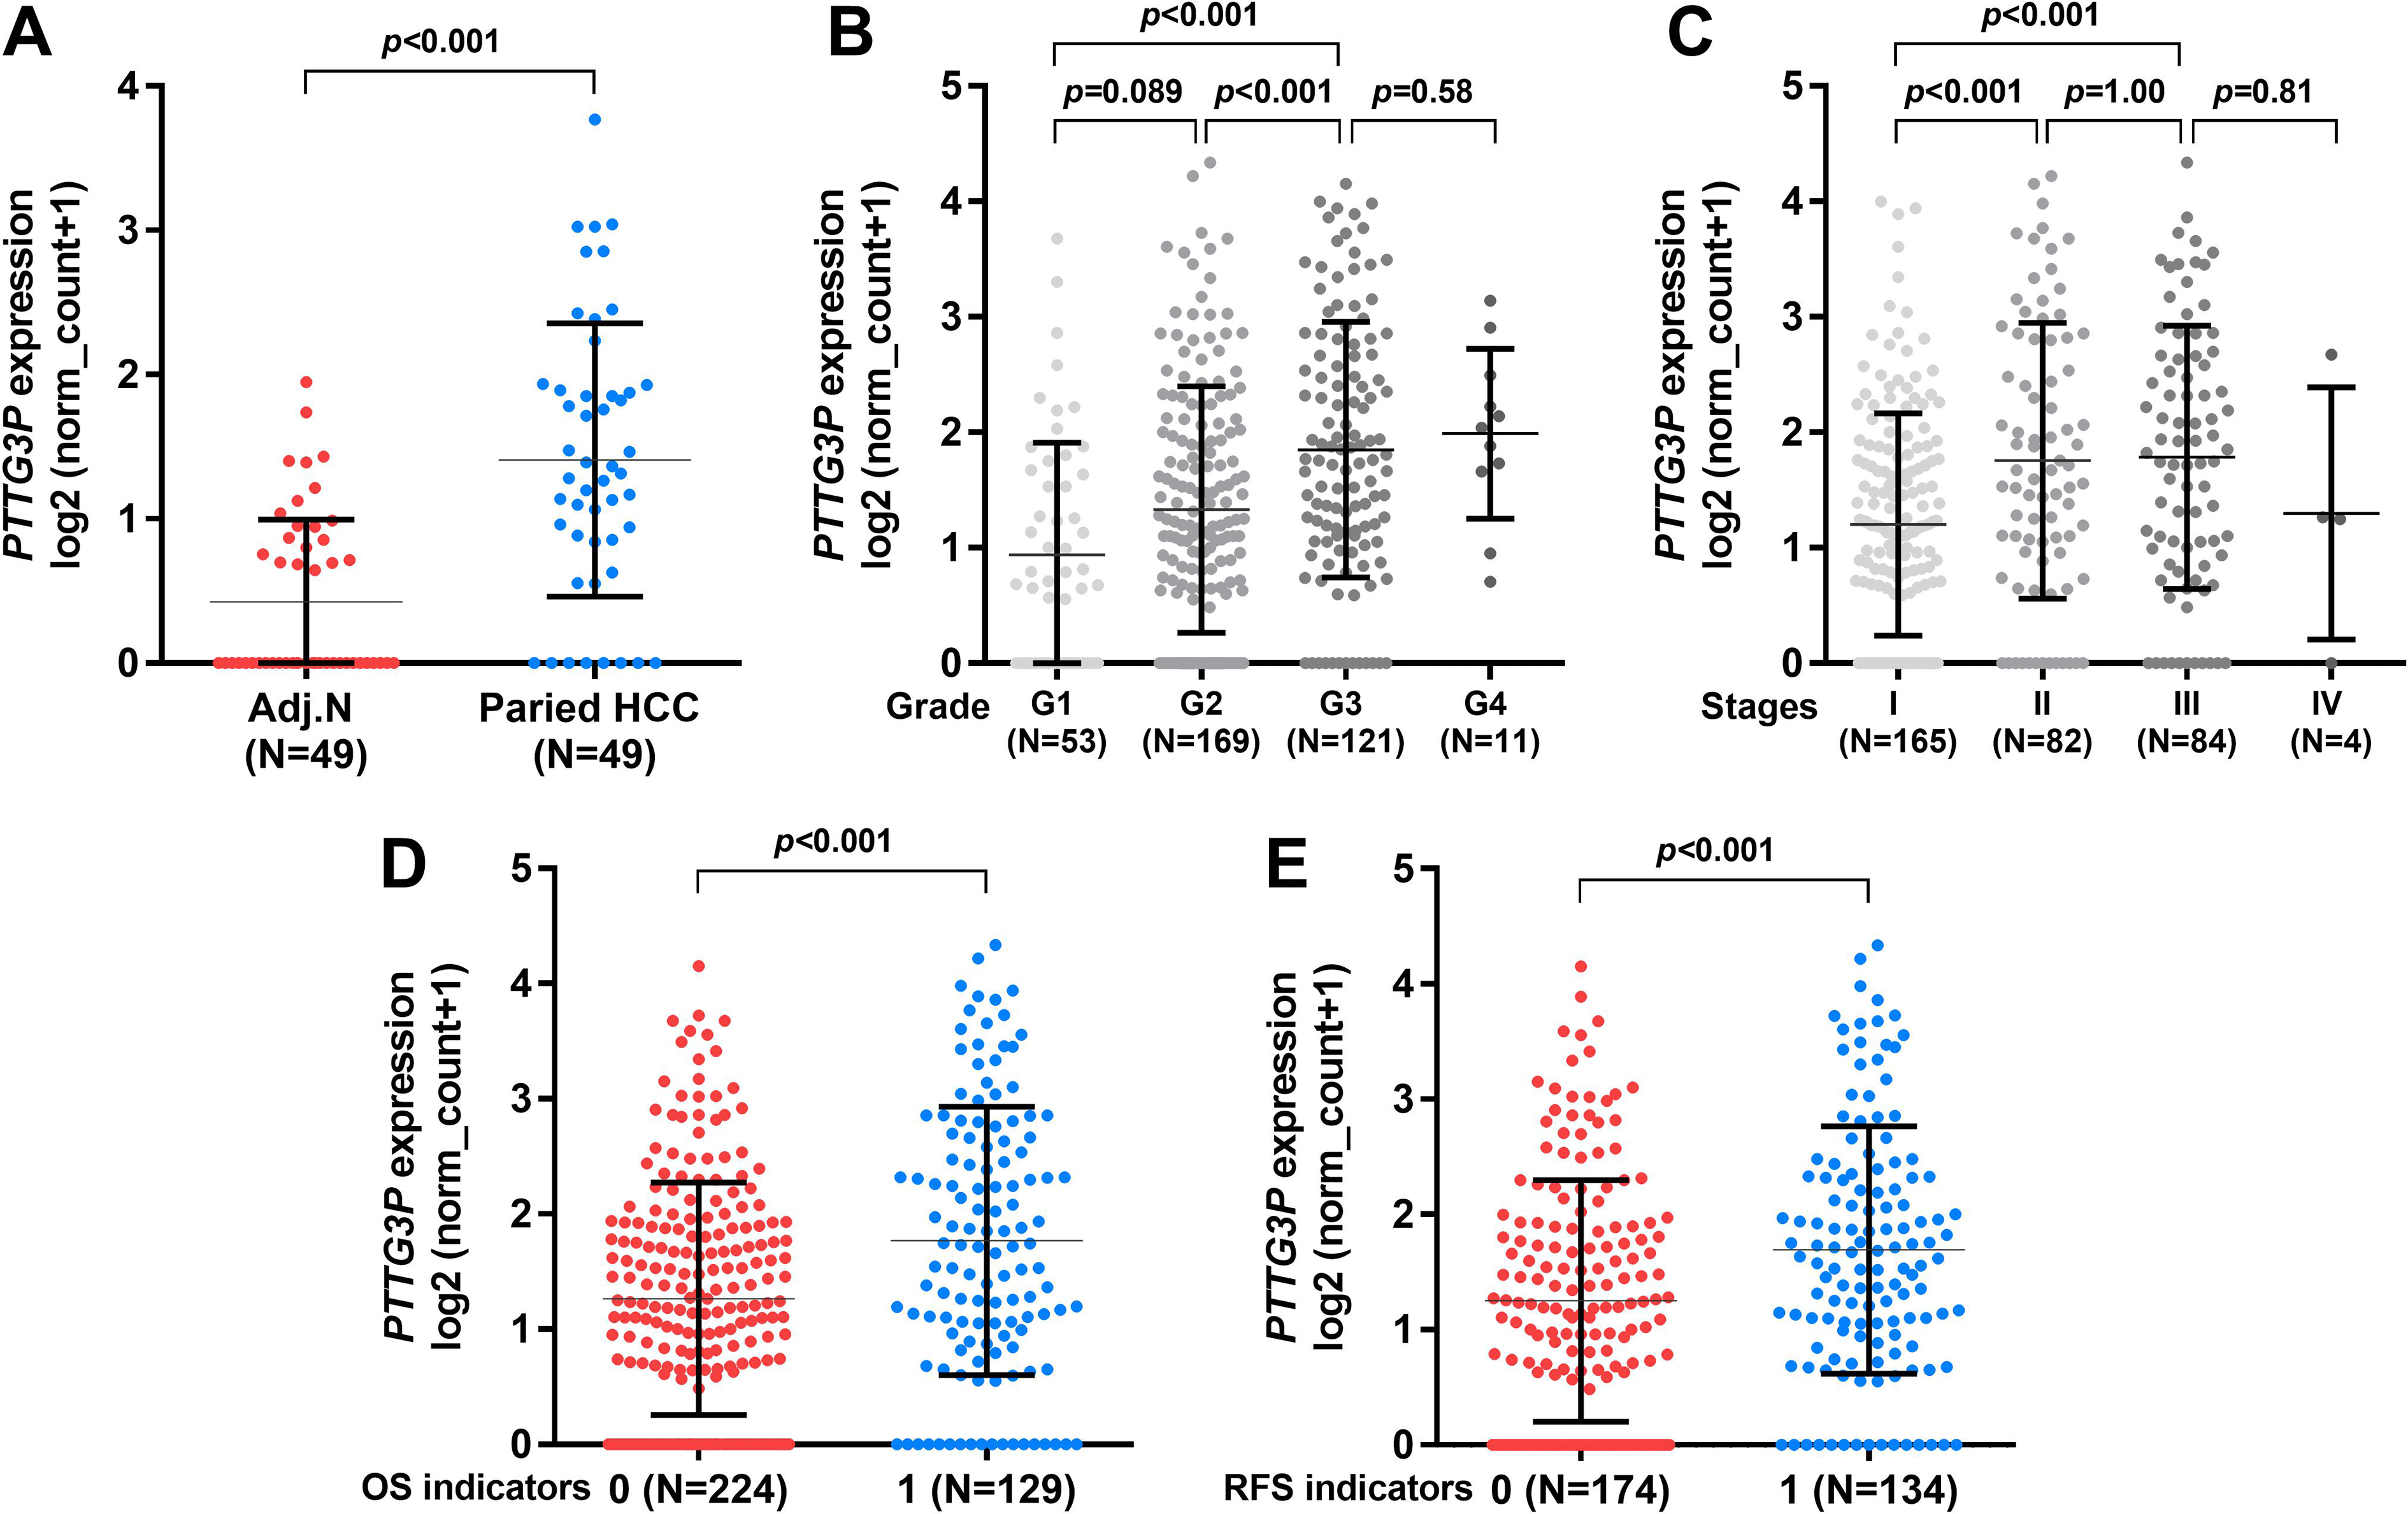
PTTG3P expression profile in hepatocellular carcinoma (HCC). (A-C) Comparison of PTTG3P expression between HCC tissues and the matched adjacent normal tissues (N = 49) (A), in different histological grade tumors (B) and in different pathological stages (C). The number of patients in each group was as indicated in the figures. (D) and (E) Comparison of PTTG3P expression in patients with primary HCC with different overall survival (OS) (D) and recurrence-free survival (RFS) (E) status. OS, 0: deceased cases, 1: living cases. RFS, 0: cases without recurrence; 1: cases with recurrence.
Since PTTG3P expression was associated with the malignant status of HCC tumors, we then examined whether its expression was related to survival outcomes among the patients. By grouping patients with HCC according to their survival indicators, we observed that the deceased cases and the cases with recurrence after primary therapy had significantly higher PTTG3P expression compared with their respective controls (P < .001; Figure 1D and E).
PTTG3P Upregulation Was Associated With Significantly Shorter OS and RFS in Patients With HCC
By generating Kaplan-Meier survival curves, we further studied the correlation between PTTG3P expression and OS/RFS in patients with HCC. Patients were separated into 2 groups according to the Youden Index of PTTG3P expression in ROC analysis of death and recurrence, respectively. Log-rank test showed that the high PTTG3P expression group had significantly shorter OS and RFS, compared with the respective low expression groups (P < .001; Figure 2A and B). The median OS of the high PTTG3P expression group was 601 days, while that of the low PTTG3P expression group was 2131 days (Figure 2A). Besides, the median RFS of the high and low PTTG3P expression groups were 561 and 2133 days, respectively (Figure 2B).

Kaplan-Meier survival curves in patients with hepatocellular carcinoma (HCC). (A) and (B) Kaplan-Meier curves of overall survival (OS) (A) and recurrence-free survival (RFS) (B) in patients with HCC. Patients were separated into 2 groups according to the Youden Index of PTTG3P expression in the receiver operating characteristic analysis of death and recurrence, respectively. Survival data (in days) were obtained from Cancer Genome Atlas–Liver and Hepatocellular Cancer.
Since PTTG3P varied significantly in different histological grades and pathological stages, we then performed subgroup analysis to examine the survival difference. Patients were further divided into early stage (stage I) and advanced stages (stage II/III/IV; Figure 3A-D) or low grade (G1/G2) and high grade (G3/G4) groups (Figure 3E-H). Subgroup analysis confirmed that the high PTTG3P expression group was consistently associated with shorter OS and RFS, regardless of pathological stages or tumor grade (Figure 3A-H).

Subgroup analysis of overall survival (OS) and recurrence-free survival (RFS) in patients with hepatocellular carcinoma (HCC). A-H, Subgroup Kaplan-Meier curves of OS (A, C, E, and G) and RFS (B, D, F, and H) in patients with HCC. Patients were divided into early stage (stage I) and advanced stages (stage II/III/IV) (A-D), or low grade (G1/G2) and high grade (G3/G4) subgroups (E-H).
Then we tried to assess the independent prognostic value of PTTG3P expression. The clinicopathological parameters in patients with high and low expression (separated by the cutoff in Figure 2A) were compared in Table 1. Results showed that the high PTTG3P expression group was significantly younger (57.27 ± 13.39 vs 60.64 ± 12.86, P = .036), had a higher proportion of tumors in advanced pathological stages (31/83 vs 54/246, P = 0009), and had high grade (45/88 vs 83/260, P = .002; Table 1). In univariate analysis, advanced pathological stages and high PTTG3P expression were risk factors for unfavorable OS (Table 2). Multivariate analysis confirmed that high PTTG3P expression was an independent indicator of shorter OS (hazard ratio [HR]: 2.177, 95% confidence interval [CI]: 1.519-3.121, P < .001; Table 2), after the adjustment of pathological stages. Regarding RFS, advanced pathological stages, with residual tumors, and high PTTG3P expression were associated with shorter RFS (Table 3). Multivariate analysis showed that high PTTG3P expression could independently predict shorter RFS (HR: 2.222, 95% CI: 1.503-3.283, P < .001; Table 3), after adjustment of the other 2 factors.
Comparison of Clinicopathological Parameters between Patients With HCC With High or Low PTTG3P Expression.a

Abbreviation: HCC, hepatocellular carcinoma.
a R0, no residual tumor; R1, microscopic residual tumor; R2, macroscopic residual tumor; RX: residual tumor cannot be assessed.
Univariate and Multivariate Analysis of OS in Patients With HCC.

Abbreviations: CI, confidence interval; HCC, hepatocellular carcinoma; HR, hazard ratio; OS, overall survival.
Univariate and Multivariate Analysis of RFS in Patients With HCC.

Abbreviations: CI, confidence interval; HCC, hepatocellular carcinoma; HR, hazard ratio; OS, overall survival.
In Silico Analysis of the Potential Regulatory Network and the Transcription Pattern of PTTG3P
To further explore the potential regulatory network of PTTG3P, we identified the genes that were strongly coexpressed (Spearman r ≥0.6) with it (n = 130, Supplementary Table 1). These genes have quite complex molecular interactions among each other (Figure 4A and B). Then these genes were subjected the analysis of their enrichment in Kyoto Encyclopedia of Genes and Genomes (KEGG) pathways. Results showed that BUB1, BUB1B, CCNA2, CCNB1, CCNB2, CDC20, CDC25A, CDC25C, CDC45, CDC6, E2F1, E2F2, MAD2L1, MCM2, MCM5, MCM6, MCM7, ORC1, ORC6, PKMYT1, PLK1, PTTG1, and TK are enriched in cell cycle pathway (red), FEN1, MCM2, MCM5, MCM6, MCM7, POLA2, POLD1, RFC4, and RNASEH2A are involved in DNA replication (dark blue), CDC25A, CDC25C, CDCA5, E2F1, E2F2, EZH2, KIF23, and STMN1 are enriched in microRNA in cancer (light green), EME1, POLD1, RAD51, and RAD54L are involved in homologous recombination (dark green), EXO1, POLD1, and RFC4 are enriched in mismatch repair (yellow), while CCNB1, CCNB2, GTSE1, and RRM2 are involved in p53 signaling pathway (pink) (Figure 4C). All these pathways are closely related to the carcinogenesis and pathological development of HCC.

The potential regulatory network of PTTG3P coexpressed genes. (A) A representative network of the molecular interactions of PTTG3P coexpressed genes. The image was generated using String 10.5 (https://string-db.org/). (B) Action type explanation in (A). (C) The enrichment of the genes in KEGG pathways. The cancer-related pathways were highlighted in colors.
By checking the alternative transcription data of PTTG3P in TCGA-LIHC, we found that PTTG3P only had one transcript in normal liver and HCC tissues (Figure 5). The cases with elevated PTTG3P expression had stronger exon usage (Figure 5, red frames) compared with cases with low PTTG3P expression.

PTTG3P transcription pattern in hepatocellular carcinoma (HCC) and normal liver tissues. The sample type, gene expression, and exon usage of PTTG3P in HCC tissues and adjacent normal tissues. Adjacent normal samples (dark blue) and HCC samples (orange) were presented in column and arranged according to the expression of PTTG3P from low to high in each group. The exons are arrayed in rows and are displayed on the right side and from the top down. The left side shows the gene transcriptional pattern. The red arrow indicates the transcription direction.
Discussion
In this study, using data from TCGA-LIHC, we confirmed a significant upregulation of PTTG3P in HCC tissues compared with adjacent normal tissues. In addition, we found that its upregulation was associated with poor differentiation and advanced stages of the tumors. High PTTG3P expression was generally associated with unfavorable OS and RFS in patients with HCC. The following subgroup analyses confirmed that high PTTG3P expression was consistently associated with shorter OS and RFS, regardless of pathological stages or tumor grade. By performing univariate and multivariate analysis, we confirmed that high PTTG3P expression was an independent indicator of shorter OS (HR: 2.177, 95% CI: 1.519-3.121, P < .001) and shorter RFS (HR: 2.222, 95% CI: 1.503-3.283, P < .001), after adjustment of the other confounding factors. These findings suggest that PTTG3P expression might serve as a valuable prognostic biomarker in HCC.
PTTG3P is a pseudogene with high homology of its parental gene PTTG1. In HCC, PTTG3P upregulation leads to the upregulation of PTTG1, while PTTG3P inhibition results in suppressed PTTG1 expression. 13 These findings suggest that PTTG3P might be an upstream regulator of PTTG1. However, another recent study failed to confirm this regulatory effect in gastric cancer. Weng et al reported that although PTTG3P expression has independent prognostic value in terms of OS and RFS in gastric cancer, its expression is independent of its parent genes PTTG1 and PTTG2 in both gastric cancer tissues and cells. 12 Therefore, we infer that the regulatory effect of PTTG3P might be cancer-specific.
In this study, we confirmed that PTTG1 was strongly coexpressed with PTTG3P in HCC (Spearman r = 0.80; Supplementary Table 1). PTTG1 upregulation leads to enhanced angiogenesis 17 in HCC and its inhibition results in retarded liver cancer cell growth both in vitro and in vivo. 18 Also, it acts as an activator of the PI3K/AKT signaling pathway, which contributes to facilitated cell cycle progression, epithelial to mesenchymal transition, and metastasis of HCC. 13,19,20 These mechanisms partly helped to explain the association between increased PTTG3P expression and the poor survival of patients with HCC. However, as a lncRNA, it may have quite complex regulatory effects. Besides PTTG1, over a hundred genes were strongly coexpressed with PTTG3P. More importantly, these genes were enriched in several KEGG pathways that are closely associated with the carcinogenesis and malignant transformation of HCC, such as cell cycle pathway, DNA replication, homologous recombination, mismatch repair, and p53 signaling pathway. Based on these findings, we hypothesized that besides the regulatory effect on PTTG1 expression, PTTG3P might also participate in other signaling pathways in HCC. In this study, we also preliminarily explored the potential mechanisms underlying the dysregulation of PTTG3P in HCC. Using RNA-seq data and alternative transcription data in TCGA-LIHC, we found that the PTTG3P only has one transcript in HCC and the cases with elevated PTTG3P expression had higher exon usage compared to the cases with low PTTG3P expression. These findings suggest that its upregulation is closely related to enhanced transcription.
This study also has some limitations. Firstly, this is an in silico analysis based on online databases. Although the sample size was large, no validation cohort was used. Secondly, although we identified the potential regulatory network of PTTG3P in HCC, no experimental validation was conducted. Therefore, it is meaningful to explore other regulatory mechanisms of PTTG3P in HCC in the future.
Conclusion
PTTG3P expression might serve as an independent prognostic biomarker in terms of OS and RFS in primary HCC.
Supplemental Material
Supplementary_figure_1 - Long Noncoding RNA PTTG3P Expression Is an Unfavorable Prognostic Marker for Patients With Hepatocellular Carcinoma
Supplementary_figure_1 for Long Noncoding RNA PTTG3P Expression Is an Unfavorable Prognostic Marker for Patients With Hepatocellular Carcinoma by Hansong Bai, Xing Luo, Dongxu Liao, Wei Xiong, Ming Zeng and Bo Zheng in Technology in Cancer Research & Treatment
Supplemental Material
Supplementary_table_1 - Long Noncoding RNA PTTG3P Expression Is an Unfavorable Prognostic Marker for Patients With Hepatocellular Carcinoma
Supplementary_table_1 for Long Noncoding RNA PTTG3P Expression Is an Unfavorable Prognostic Marker for Patients With Hepatocellular Carcinoma by Hansong Bai, Xing Luo, Dongxu Liao, Wei Xiong, Ming Zeng and Bo Zheng in Technology in Cancer Research & Treatment
Footnotes
Authors’ Note
This study was a secondary analysis based on online databases. No primary data were collected by any author of this study. No ethical approval is required.
Declaration of Conflicting Interests
The author(s) declared no potential conflicts of interest with respect to the research, authorship, and/or publication of this article.
Funding
The author(s) received no financial support for the research, authorship, and/or publication of this article.
Supplemental Material
Supplemental material for this article is available online.
Abbreviations
References
Supplementary Material
Please find the following supplemental material available below.
For Open Access articles published under a Creative Commons License, all supplemental material carries the same license as the article it is associated with.
For non-Open Access articles published, all supplemental material carries a non-exclusive license, and permission requests for re-use of supplemental material or any part of supplemental material shall be sent directly to the copyright owner as specified in the copyright notice associated with the article.