
Abstract
Objectives
Gastric cancer (GC) is a major global health concern and is difficult to diagnose in the early stage. Ferroptosis is an iron-dependent, novel form of non-apoptotic cell death. In recent years, inducing the upregulation of ferroptosis-related genes has become a promising therapeutic alternative for cancers, especially those resistant to traditional treatments. However, the relationship between ferroptosis-related genes and GC remains to be further elucidated.
Methods
In the present study, mRNA expression profiles and corresponding clinical data of patients with GC were retrieved from The Cancer Genome Atlas and used as test data. A multigene signature was constructed using the least absolute shrinkage and selection operator Cox regression model. Data of patients with GC from ‘GSE84426’ in the Gene Expression Omnibus database were used as Training data for validation.
Results
More than half ferroptosis-related genes were differentially expressed in GC tissues and adjacent normal tissue samples (58.43%) in the test data. Univariate Cox regression analysis showed that 16 differentially expressed genes were related to the prognosis of GC (all p < 0.05). Expression profiles of the 16 DGEs were analysed using LASSO Cox regression, and a prognostic model was established by selecting the 10 best genes for λ. These 10 genes were used to construct a 10-gene signature and stratify patients into two risk groups. Based on the median risk score in the test data, patients with GC were divided into high- and low-risk groups (p < 0.001). Risk score was an independent predictor for overall survival in multivariate Cox regression analyses (p < 0.001 and <0.01 in the test and training data, respectively; hazard ratio >1). Receiver operating characteristic curve analysis confirmed the predictive capacity of the 10-gene signature. Functional analysis revealed that tumour-infiltrating lymphocytes, antigen-presenting cell co-stimulation, and cytokine-cytokine receptors were enriched; however, the immune status differed between the two risk groups.
Conclusion
The novel ferroptosis-related gene signature can be used for GC prognosis. In addition, ferroptosis may provide a novel alternative for the diagnosis and treatment of GC.
Introduction
Gastric cancer (GC) is a major global health issue. Annually, there are more than 100 million people diagnosed with GC worldwide. 1 Although the incidence and mortality rates of GC have declined in the past 50 years, its incidence rate is ranked fifth among all cancers, with a high mortality rate (among first three ranks) in the global rankings of cancer-related deaths. 2 According to estimates from the International Agency for Research on Cancer’s GLOBOCAN project, there were 10,33,701 new cases of GC worldwide in 2018 (accounting for 5.7% of all confirmed cancer cases) and 7,82,685 deaths related to GC. 3 There have been significant advances in diagnosis and treatment of GC; however, lack of early diagnostic biomarkers and non-specific gastrointestinal symptoms result in a considerable number of patients being diagnosed late. In addition, its 5-years survival rate is estimated to be less than 20%. 4 Treatment of Late-stage GC mainly includes surgical procedures that has been developed in the context of multi-modal strategies (chemotherapy, radio chemotherapy, targeted therapy, and regional therapy) to improve prognosis. 5 Although, the current treatment plan for GC majorly relies on surgical resection and chemotherapy, patient response to these treatments is still inadequate. 6 Multiple risk factors, including genetic and epigenetic ones, are widely considered to be related to gastric cancer occurrence and development. 7 Therefore, it is imperative to discover novel and better targets for effective treatment as well as to explore the molecular mechanisms underlying the pathological processes of GC.
Ferroptosis is a regulated, non-apoptotic form of cell death that is iron and reactive oxygen species (ROS) dependent. 8 Tan S et al. described a unique oxidative stress-induced programmed cell death pathway called oxytosis in 2001. 9 Preliminary studies on oxytosis revealed that it is highly correlated with ferroptosis. 10 In recent years, inducing the upregulation of the ferroptosis-related genes has become a promising therapeutic alternative for cancers, especially those resistant to traditional treatments. 11 Studies have shown that cancer-associated fibroblasts secrete exosomal miR-522 and inhibit ferroptosis in cancer cells by targeting ALOX15 and blocking lipid-ROS accumulation. 12 However, it is still unclear if other ferroptosis-related genes are involved in the prognosis of GC.
In the present study, we retrieved clinical data of patients with GC from The Cancer Genome Atlas (TCGA) database. Subsequently, we screened a 10-gene signature from the ferroptosis-related differentially expressed genes (DEGs) that can influence GC prognosis; this was verified using data from Gene Expression Omnibus (GEO). Finally, we conducted a functional enrichment analysis to explore the potential mechanisms underlying the 10-gene signature. The novel ferroptosis-related gene signature reported in this work is a novel tool in GC prognosis.
Materials and Methods
Data collection
Training data
GC expression profile datasets and clinical pathology characteristic information were retrieved from the TCGA-GDC repository up to 26 September 2020 (https://portal.gdc.cancer.gov). Expression profile datasets were derived from 343 GC tissue and 30 normal tissue samples. Out of these samples, 370 completed clinical samples were used for constructing a new prognostic 10-gene signature. As we used TCGA data in this study while complying with TCGA’s publication guidelines (https://www.cancer.gov/about-nci/organization/ccg/research/structural-genomics/tcga/using-tcga/citing-tcga), approval from an ethics committee was not required.
Test data
GC expression profile datasets and pathological information of GSE84426 were retrieved from NCBI-GEO repository until 10 October 2020 (https://www.ncbi.nlm.nih.gov/geo/). These data were derived from 76 GC samples.
Ferroptosis-related genes
A total of 267 ferroptosis-related genes were retrieved from FerrDb 13 until 20 October 2020 (http://www.zhounan.org/ferrdb/operations/download.html) as well as from previous reports. 11
Identification of prognostic ferroptosis-related DEGs
The DEGs between tumour tissue and adjacent non-tumour/normal tissue samples, with a false discovery rate (FDR) < 0.05 in the training data, were identified using the ‘limma’ package in R. The ‘survival’ package in R was used to screen the ferroptosis-related genes with prognostic values using univariate Cox analysis of overall survival (OS).
The interaction network and correlation network for the overlapping prognostic DEGs were constructed using the STRING database (https://string-db.org) 14 and R packages, ‘igraph’ and ‘reshape2’.
Construction and validation of a prognostic ferroptosis-related gene signature
The ‘glmnet’ package in R was used with least absolute shrinkage and selection operator (LASSO) algorithm that can select and shrink both the independent and response variables. 15 The normalised expression matrices of candidate prognostic DEGs in training data were used as independent variables, and OS and patient status in training data were used as response variables in the regression. The patients were divided into high-risk and low-risk groups according to the median value of the risk score in the training data that was calculated based on the normalised expression of each gene and its corresponding regression coefficients. The ‘pheatmap’ R package was used for distribution and determining median value of risk scores. The ‘ggplot2’ and ‘Rtsne’ R packages were used to obtain PCA and t-SNE, respectively. The ‘survminer’, ‘survival’, and ‘timeROC’ (ROC; receiver operating characteristic) R packages were used to evaluate the predictive power of the gene signature by preforming a time-dependent ROC curve.
Functional enrichment analyses
The ‘clusterProfiler’, ‘enrichplot’, ‘org.Hs.eg.db’, and ‘ggplot2’ R packages were utilised to conduct Gene Ontology (GO) and Kyoto Encyclopedia of Genes and Genomes (KEGG) pathway analyses based on the DEGs (|log2FC| ≥ 1, FDR <0.05) between the high-risk and low-risk groups. 16 The ‘gsva’ and ‘limma’ R packages were used to perform single-sample gene set enrichment analysis (ssGSEA).
Statistical analysis
All statistical analyses were performed using R (v.4.0.2) and Perl strawberry (v.5.30.0.1). Kaplan-Meier curve was used to analyse the OS. Time-dependent ROC curve was used to evaluate the predictive effect of OS risk score.
Results
Summary of retrieved data
Figure 1 shows the flow chart of the present study. The complete clinicopathological characteristics of the 370 TCGA-GDC and 76 NCBI-GEO GC patients are summarised in Table 1. Flow chart of data collection and analysis. Clinical characteristics of the GC patients used in this study.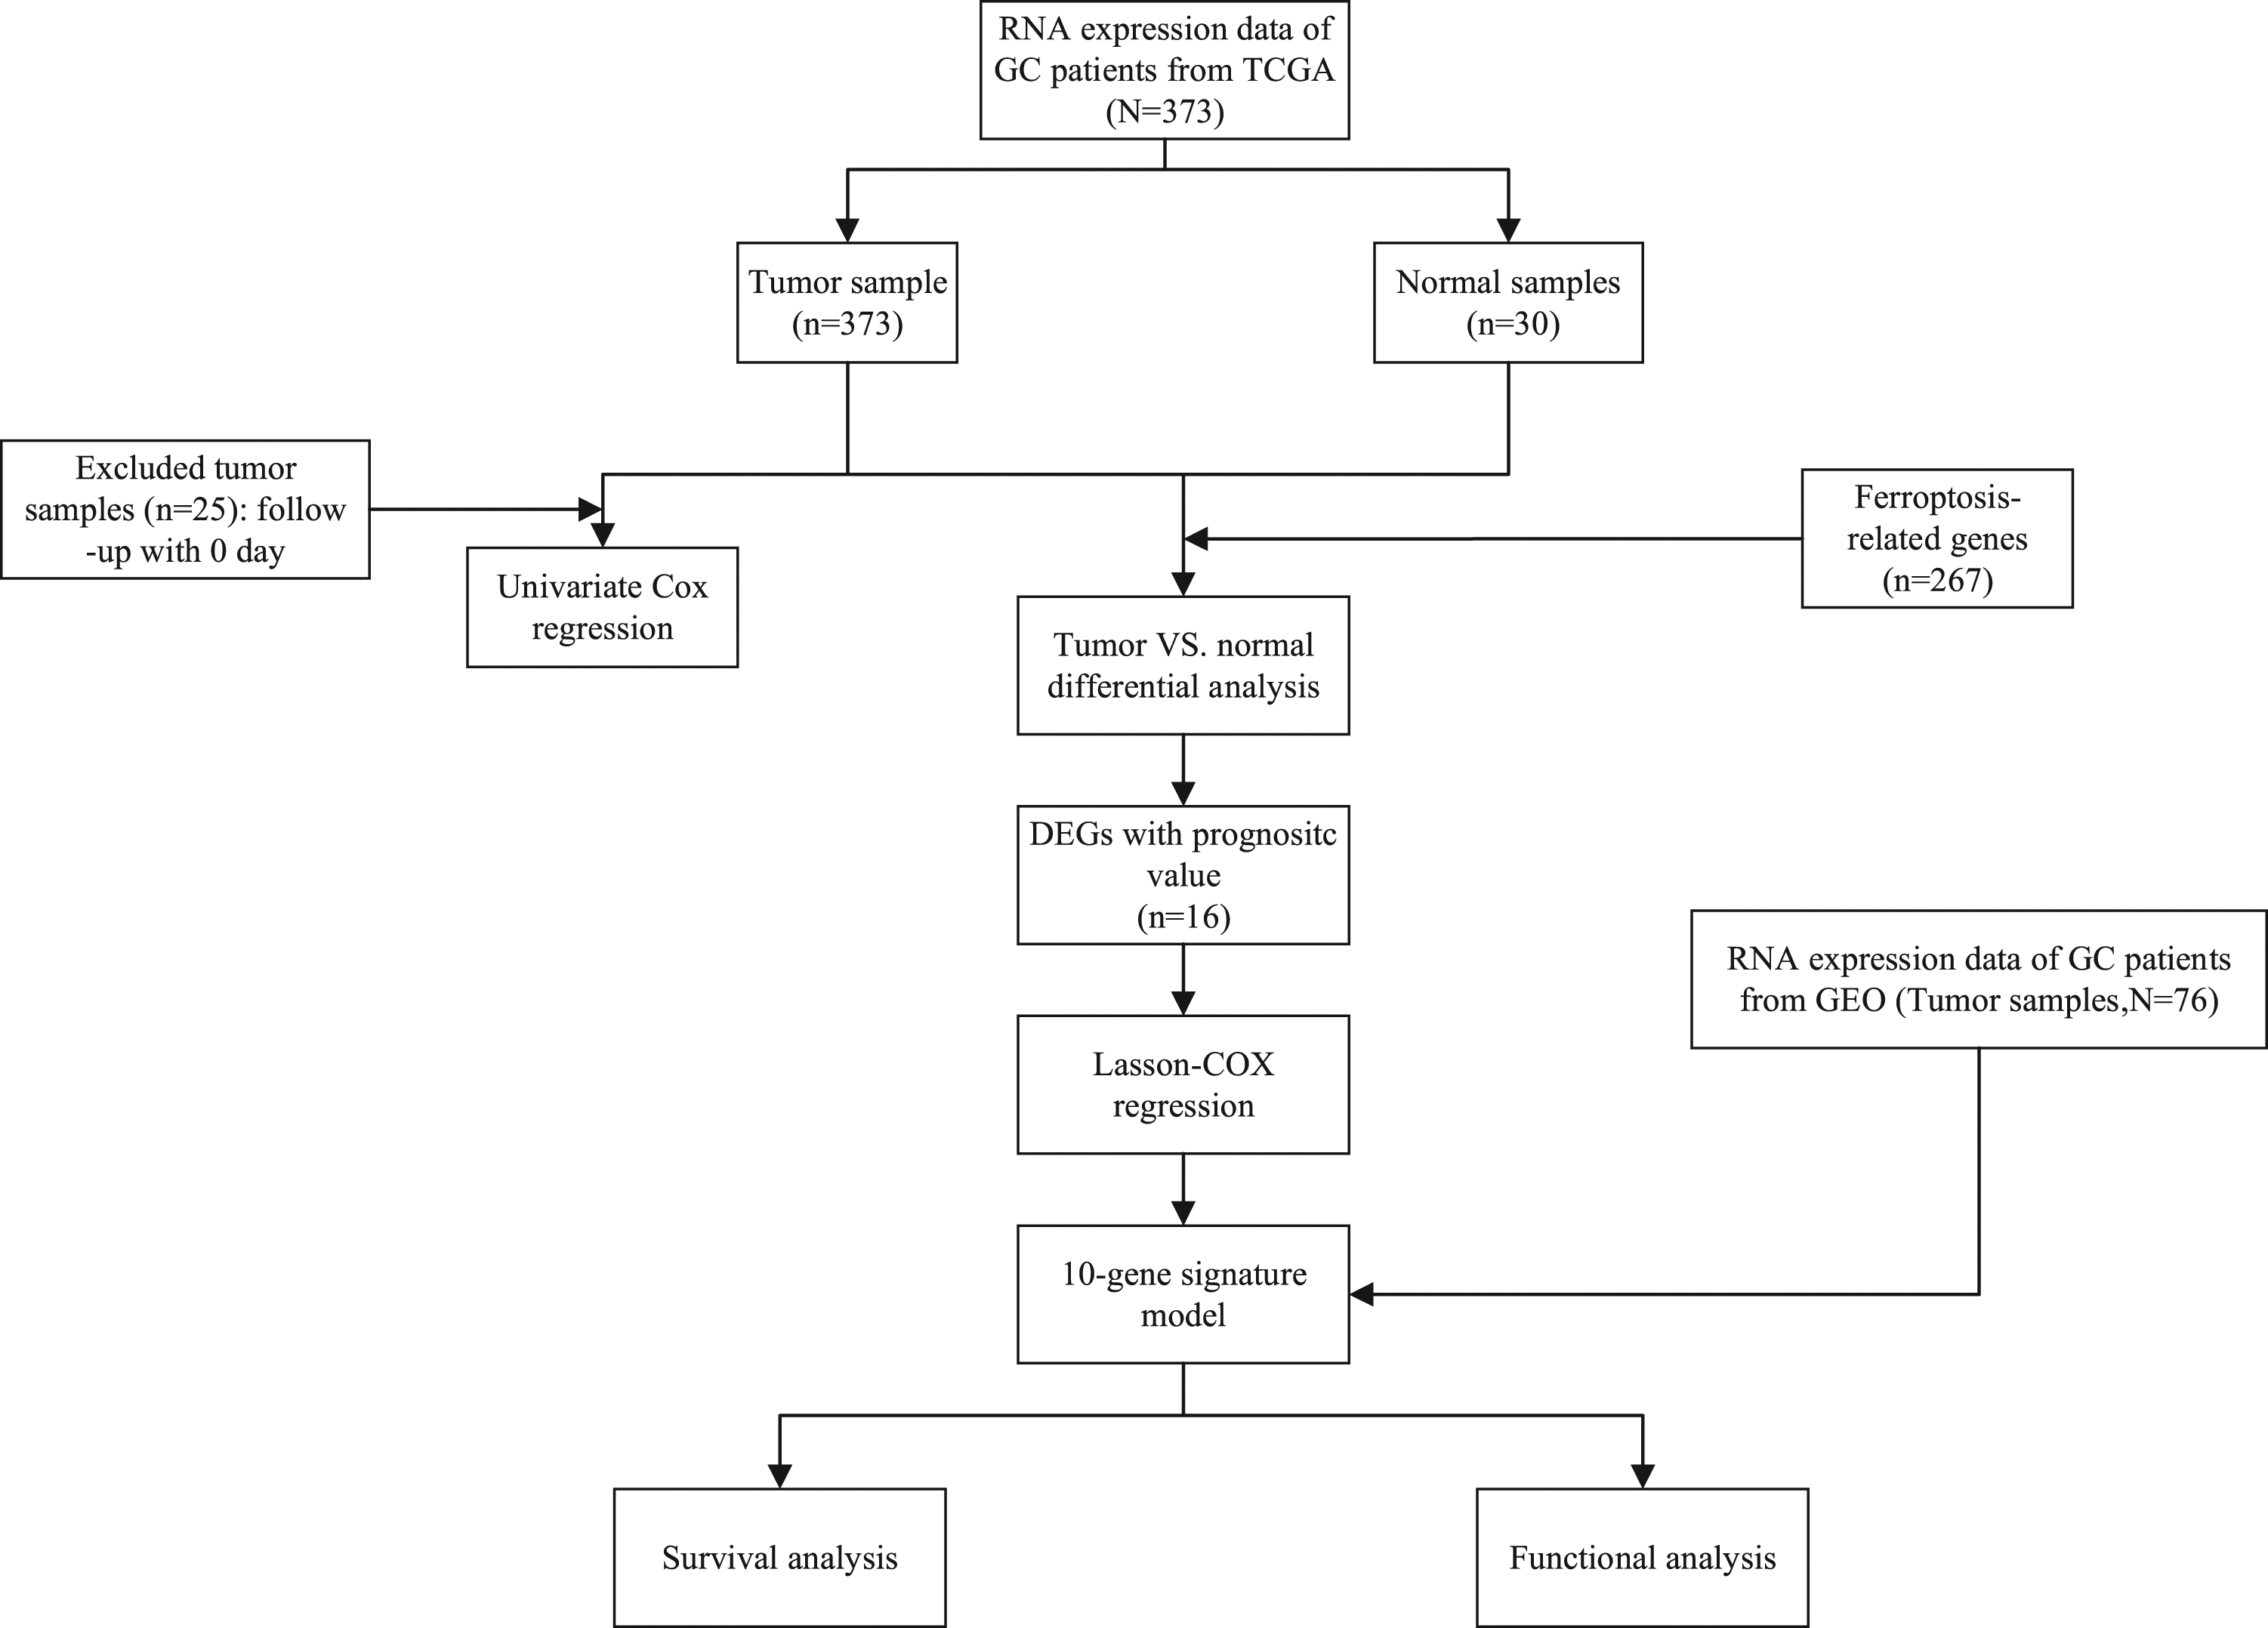

Identification of prognostic ferroptosis-related DEGs
More than half of the ferroptosis-related genes were differentially expressed in GC tumour tissue and adjacent normal tissue samples (156/267, 58.43%). Univariate Cox regression analysis showed that 16 DEGs were related to the prognosis of GC (all p < 0.05, all FDR <0.05, Figure 2 (a)). Expression profiles of the 16 DGEs were analysed using LASSO Cox regression (Figure 2 (c)). The interaction network and the correlation between these genes is shown in Figure 2 (b) and Figure 2 (d,e), respectively. Prognostic analysis of the 10-gene signature model in the test cohort. A. Venn diagram of Ferroptosis-related genes, DEGs and prognostic genes. B. Heatmap of the prognostic ferroptosis-related DEGs. C. Forest of the prognostic ferroptosis-related DEGs. d. The PPI network of the prognostic ferroptosis-related DEGs. E. The correlation network of the prognostic ferroptosis-related DEGs.
Construction of a prognostic ferroptosis-related gene signature
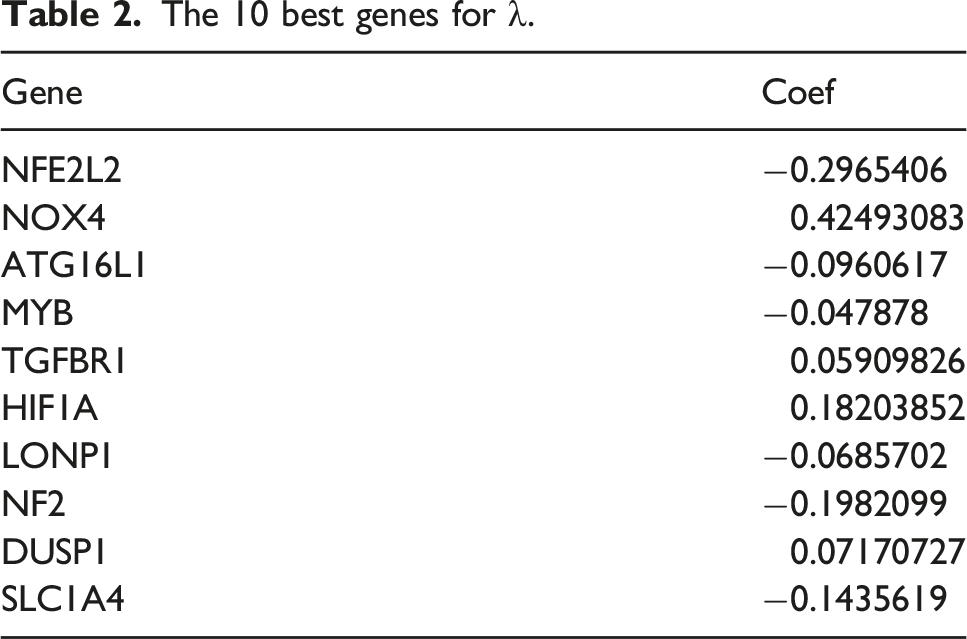
The 10 best genes for λ.

Construction of a prognostic ferroptosis-related gene signature and validation of the 10-gene signature. A/G. The distribution and median value of the risk scores in the test/train data. B/H. PCA plot of the test data. C/I. t-SNE analysis of the test data. D/J. The distributions of OS status, OS and risk score in the test data. E/K. Kaplan-Meier curves for the OS of patients in the high-risk group and low-risk group in the test data. F/L. AUC of time-dependent ROC curves verified the prognostic performance of the risk score in the test data.
Validation of the 10-gene signature
To verify the robustness of the model based on test data, NCBI-GEO patients were divided into high-risk (n = 34) and low-risk groups (n = 42) (Figure 3 (g)). Consistent with the model group, PCA and t-SNE analyses in the test group showed that patients in the two different risk groups were discretely distributed (Figures 3(h) to (j)). Compared with low-risk patients, high-risk patients were likely to die earlier and have a shorter survival time (p < 0.001, Figure 3 (k)). Area under the time-dependent ROC curve for 5 years was greater than 0.65 (Figure 3 (l)).
Independent prognostic value analysis of the 10-gene signature
To determine whether risk score is an independent prognostic factor of OS, univariate and multivariate Cox regression analyses were performed on complete clinical datasets. Single-factor Cox regression analysis showed that the risk scores in the experimental group and the test group were significantly related to OS (Figures 4(a) and (c)). In contrast, multivariate Cox regression analysis showed that risk score can be used as an independent predictor of OS (Figures 4(b) and (d)). Results of the univariate (A/C) and multivariate (B/D) Cox regression analyses regarding OS in the test/training data.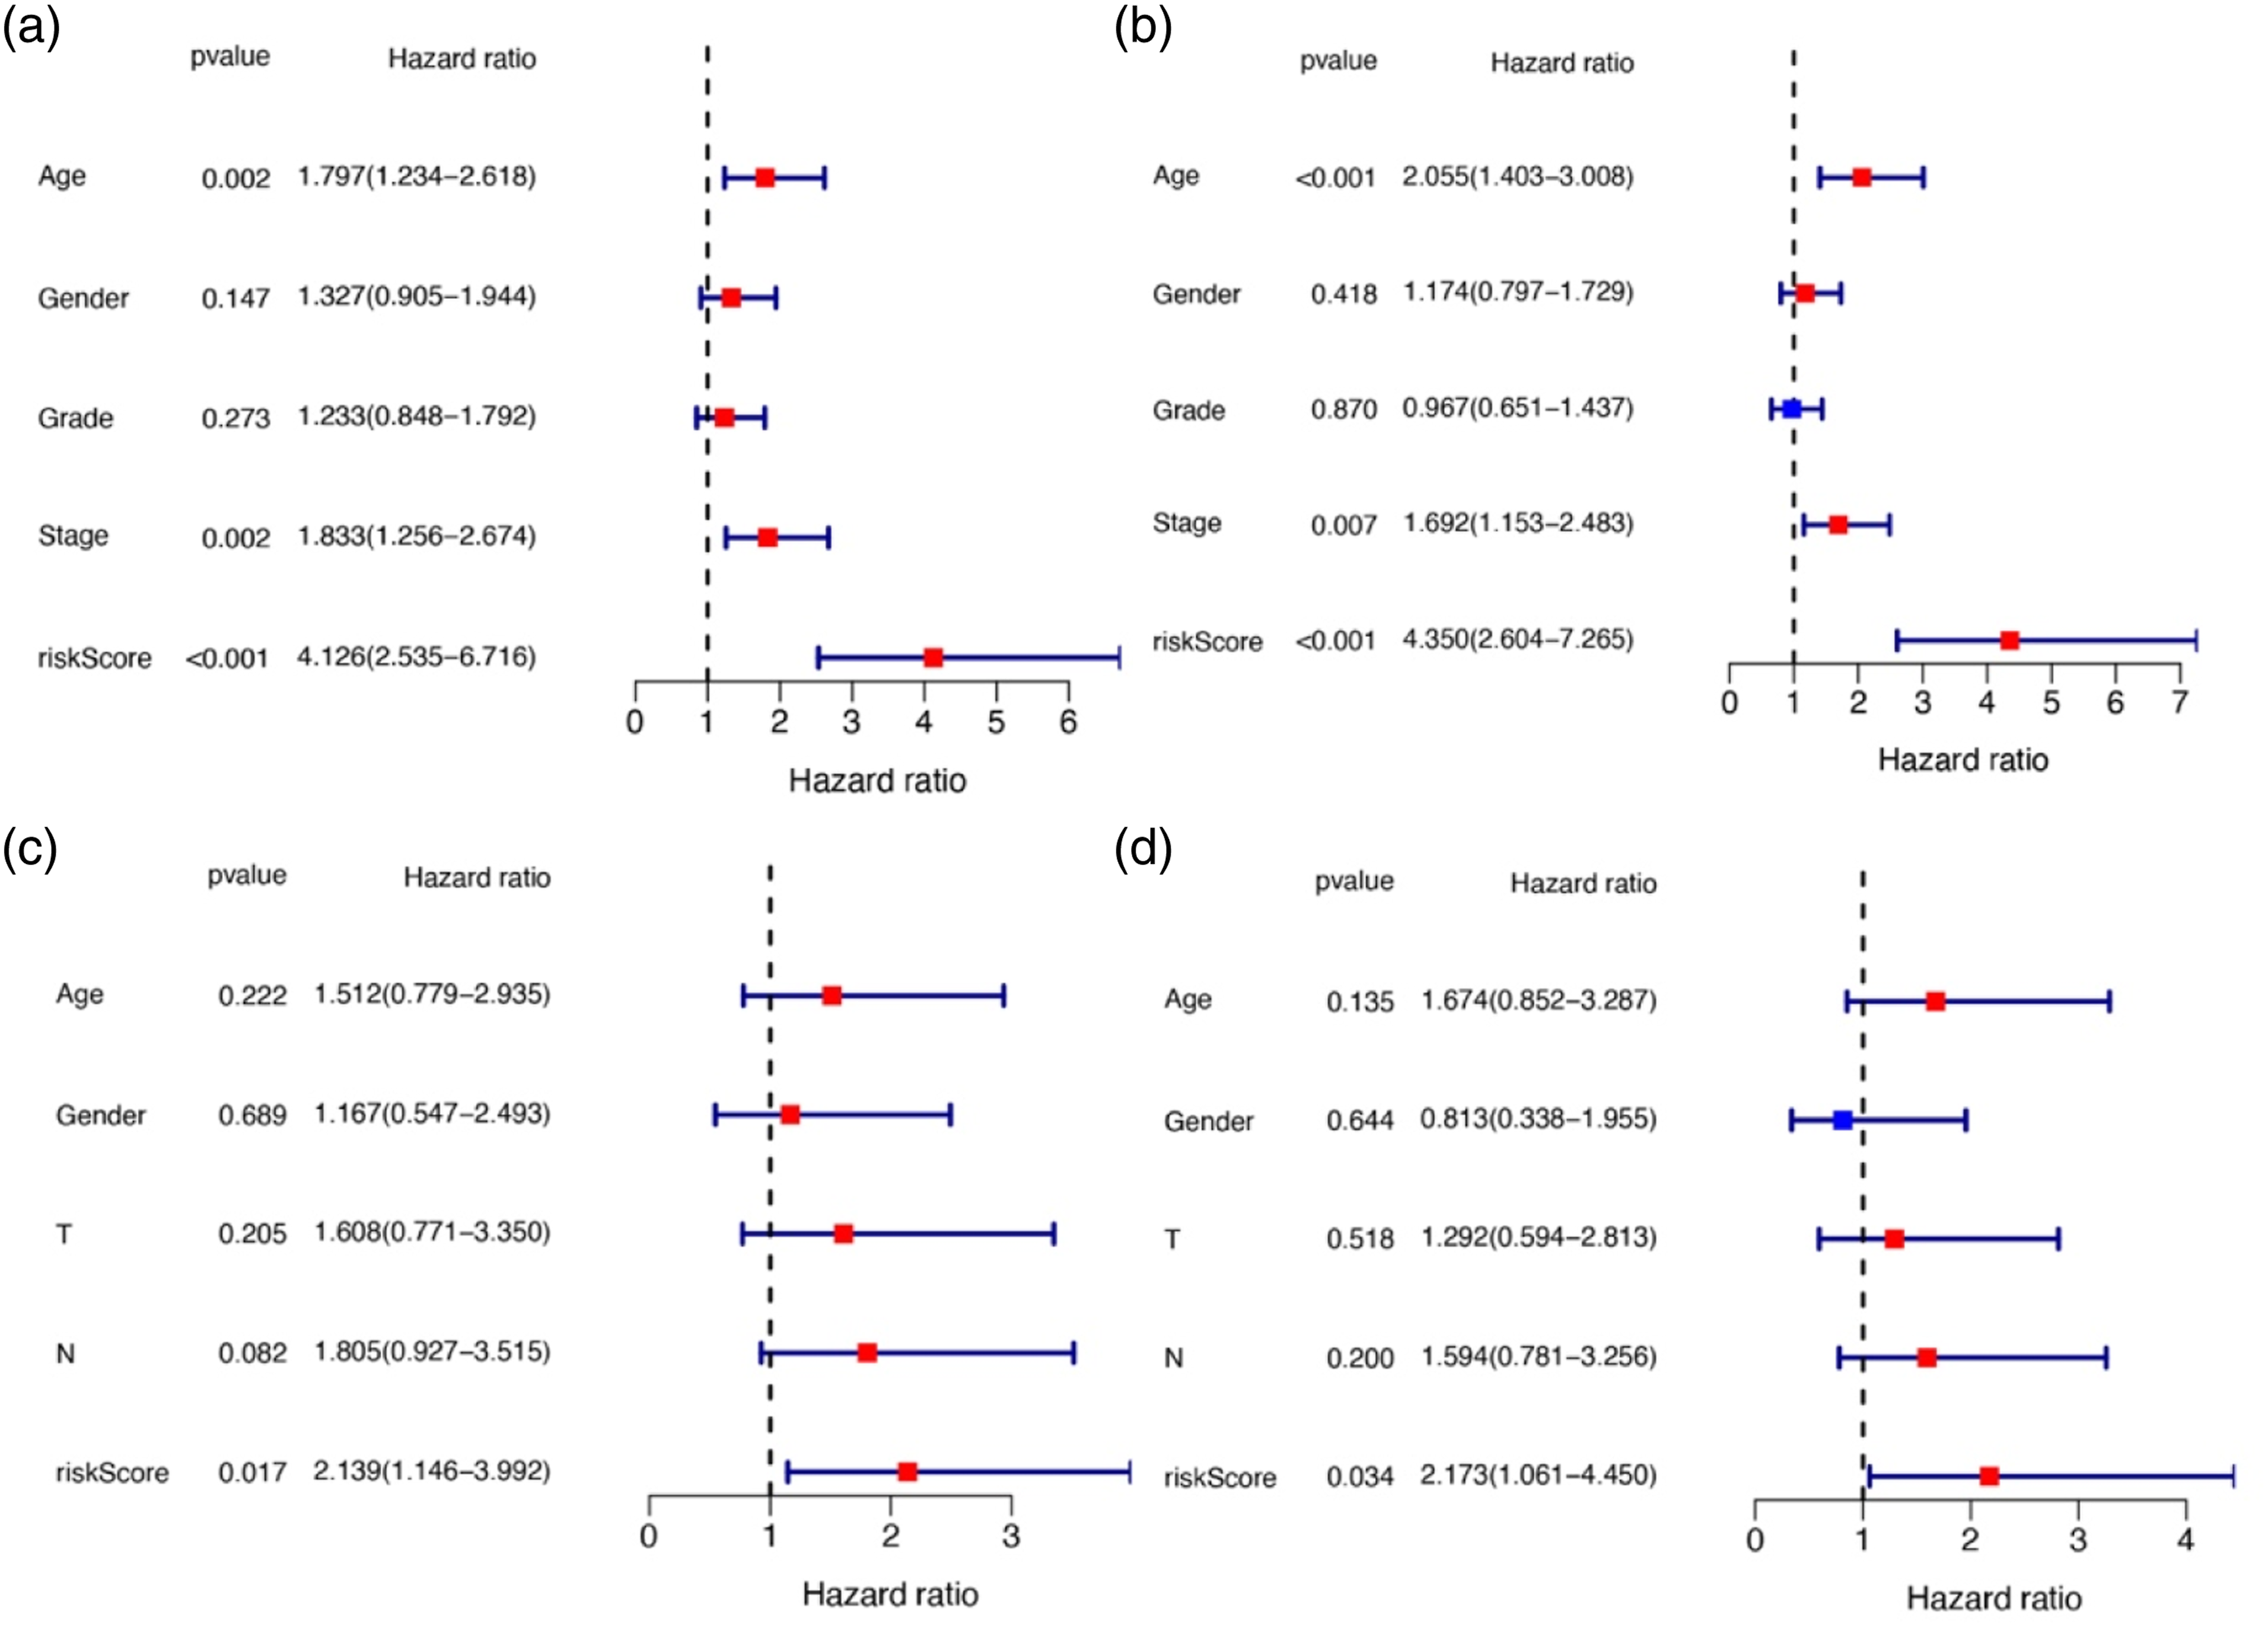
Functional enrichment analyses
GO enrichment of both test and training data showed that DEGs were significantly enriched (P adjust <0.05) in the organisation of extracellular matrix (ECM) and extracellular structure, ossification, collagen-containing ECM, ECM structural constituent, collagen binding, and integrin binding (Figures 5(a) and (c)). KEGG pathway analysis indicated that the ECM-receptor interaction pathway was enriched in both datasets (Figures 5(b) and (d)). Representative results of GO (A/C) and KEGG (B/D) analyses in the test/training data.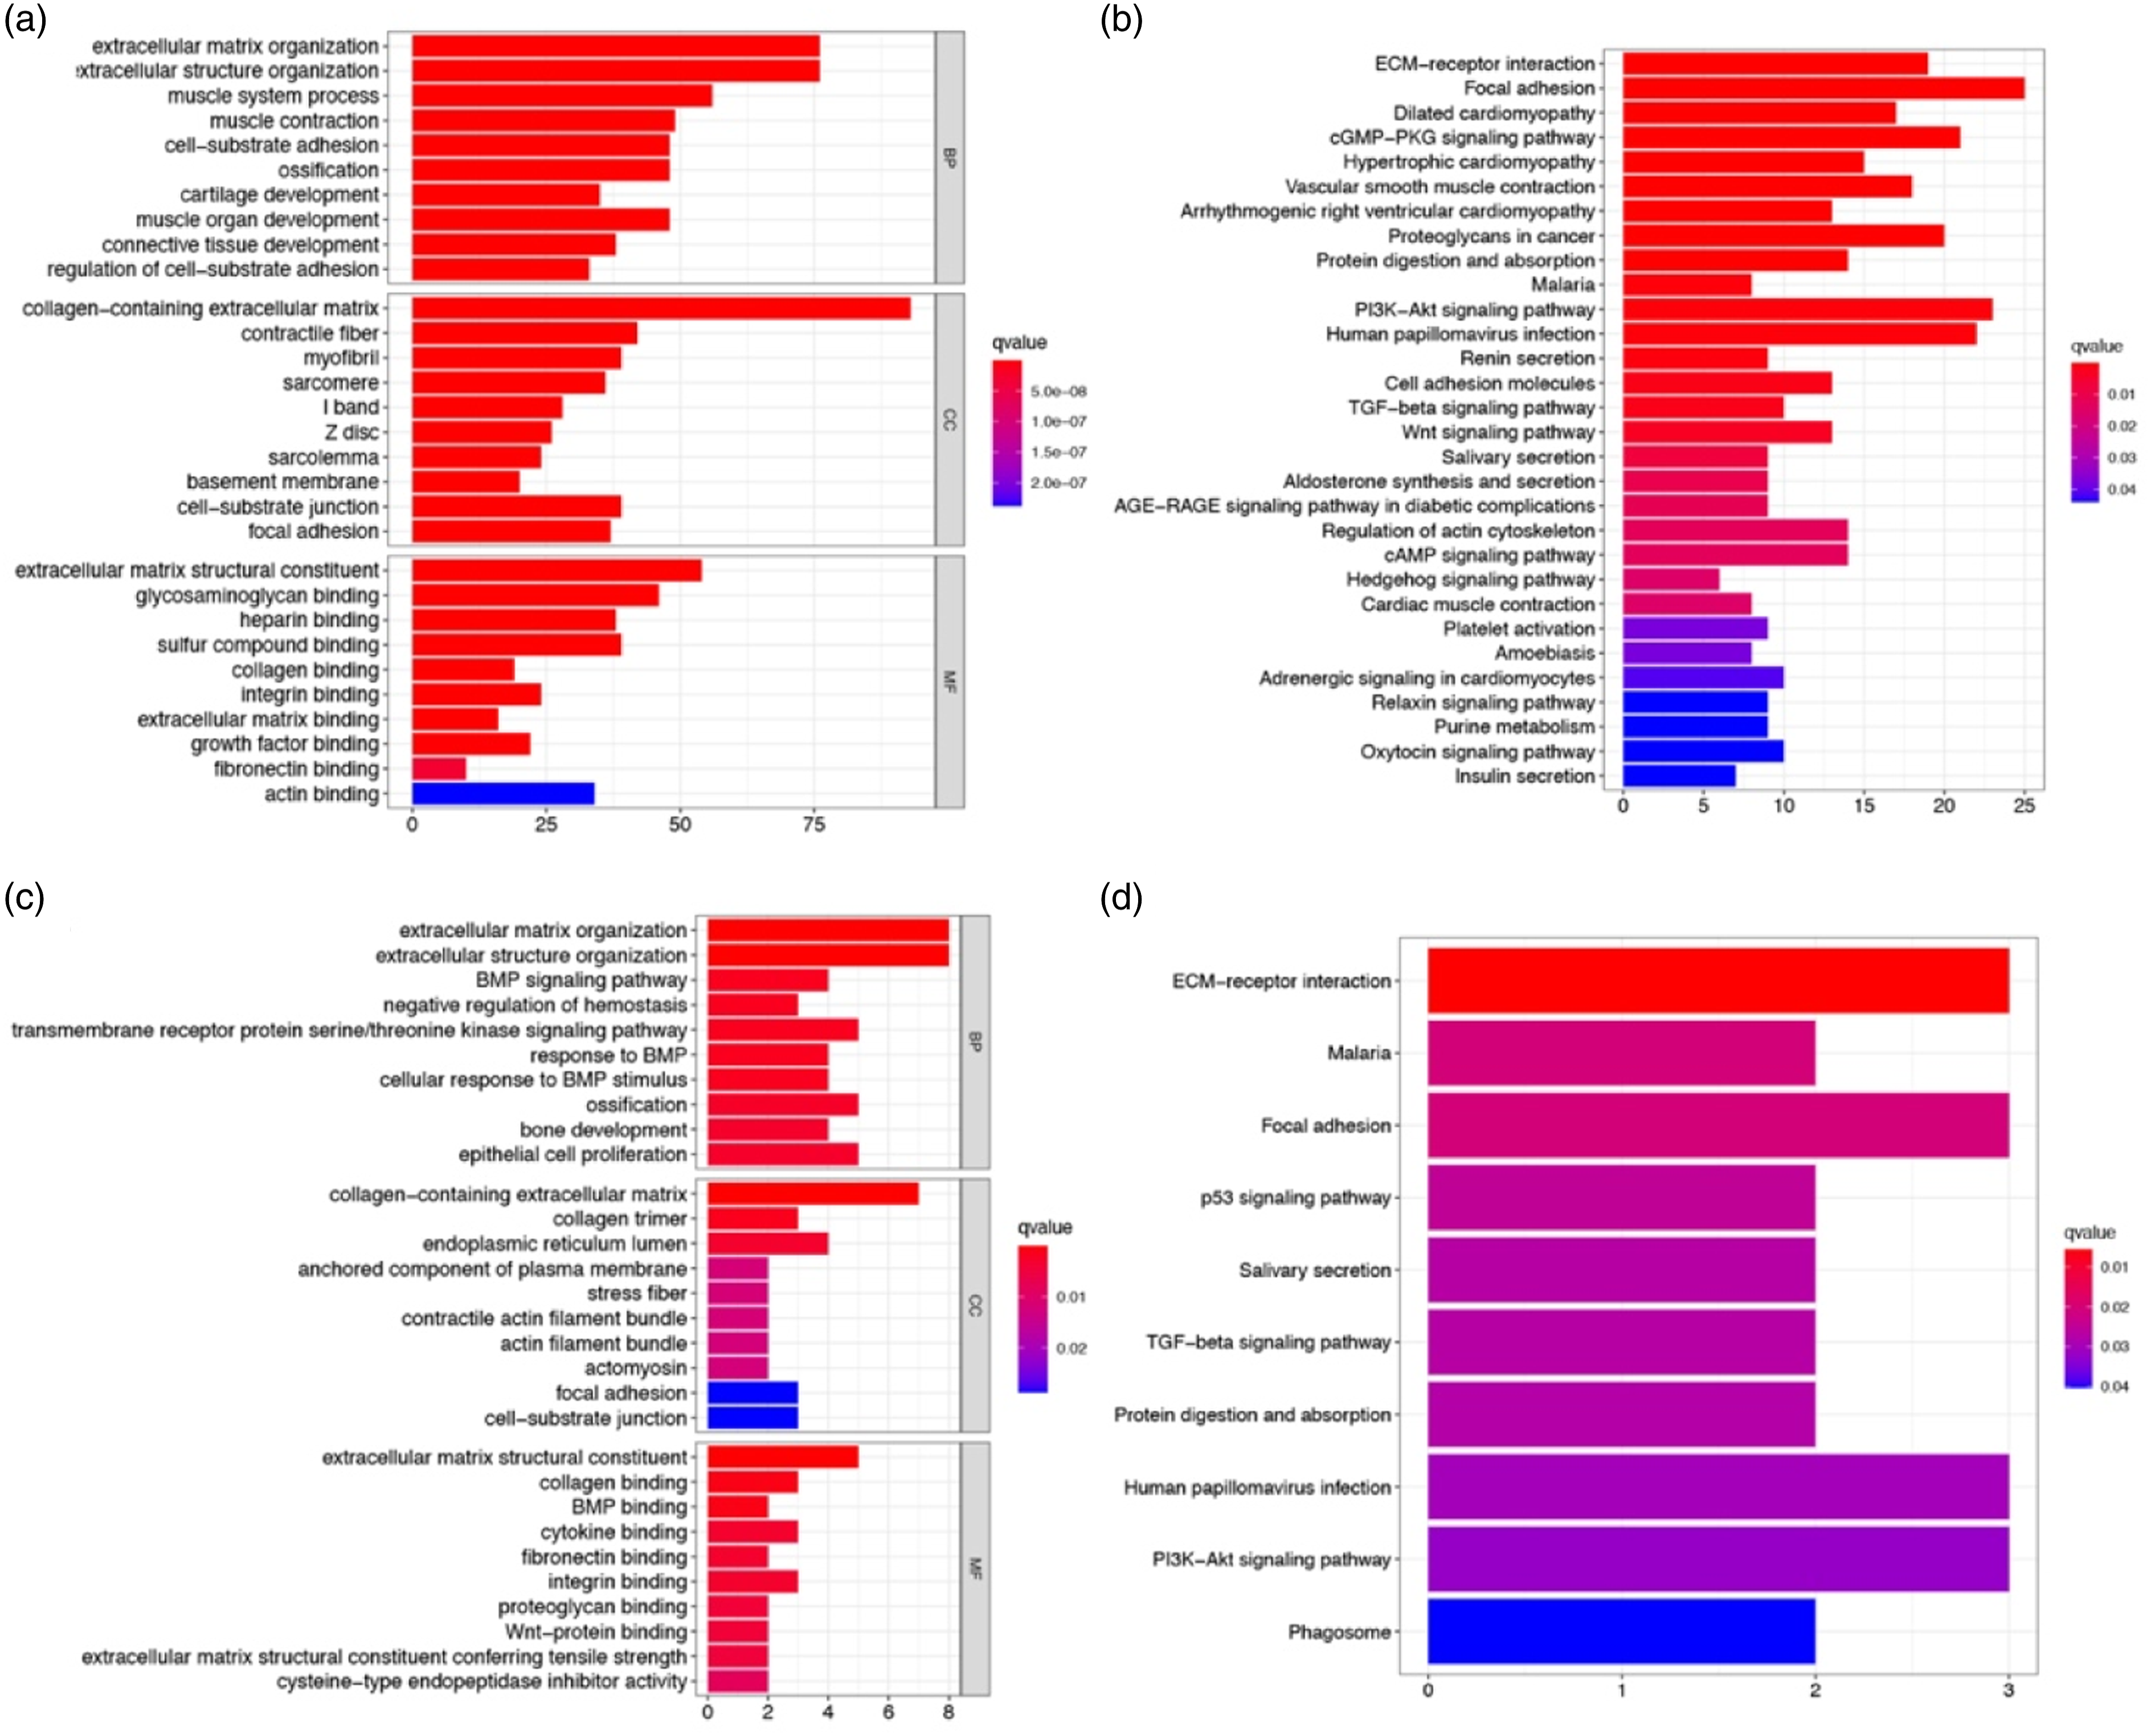
Further, we used ssGSEA to explore the correlation between risk scores and immune status. Accordingly, we quantified the enrichment scores of different immune cell subsets and related functions or pathways. The scores of B cells, macrophages, mast cells, neutrophils, pDCs, T helper cells, tumour-infiltrating lymphocytes (TILs), antigen-presenting cell (APC) co-stimulation, cytokine-cytokine receptor (CCR), and type II interferon response were significantly different between the two risk groups in the test data (all P adjusted <0.001, Figures 6(a) and (b)), with a higher score in the high-risk group. The scores of CD8+ T cells, iDCs, macrophages, TILs, Treg, APC co-stimulation, CCR, cytolytic activity, HLA, and para-inflammation were significantly different between the two risk groups in the training data (all P adjusted <0.05, Figures 6(c) and (d)), with a higher score in the high-risk group. In particular, the scores of TILs, APC co-stimulation, and CCR were the most significantly different between the two risk groups in both test and training data. Comparison of the ssGSEA scores between different risk groups in the test/training data. The scores of 16 immune cells (A/C) and 13 immune-related functions (B/D) are displayed in boxplots. CCR, cytokine-cytokine receptor. Adjusted p values were showed as: ns, not significant; *, p< 0.05; **, p< 0.01; ***, p< 0.001.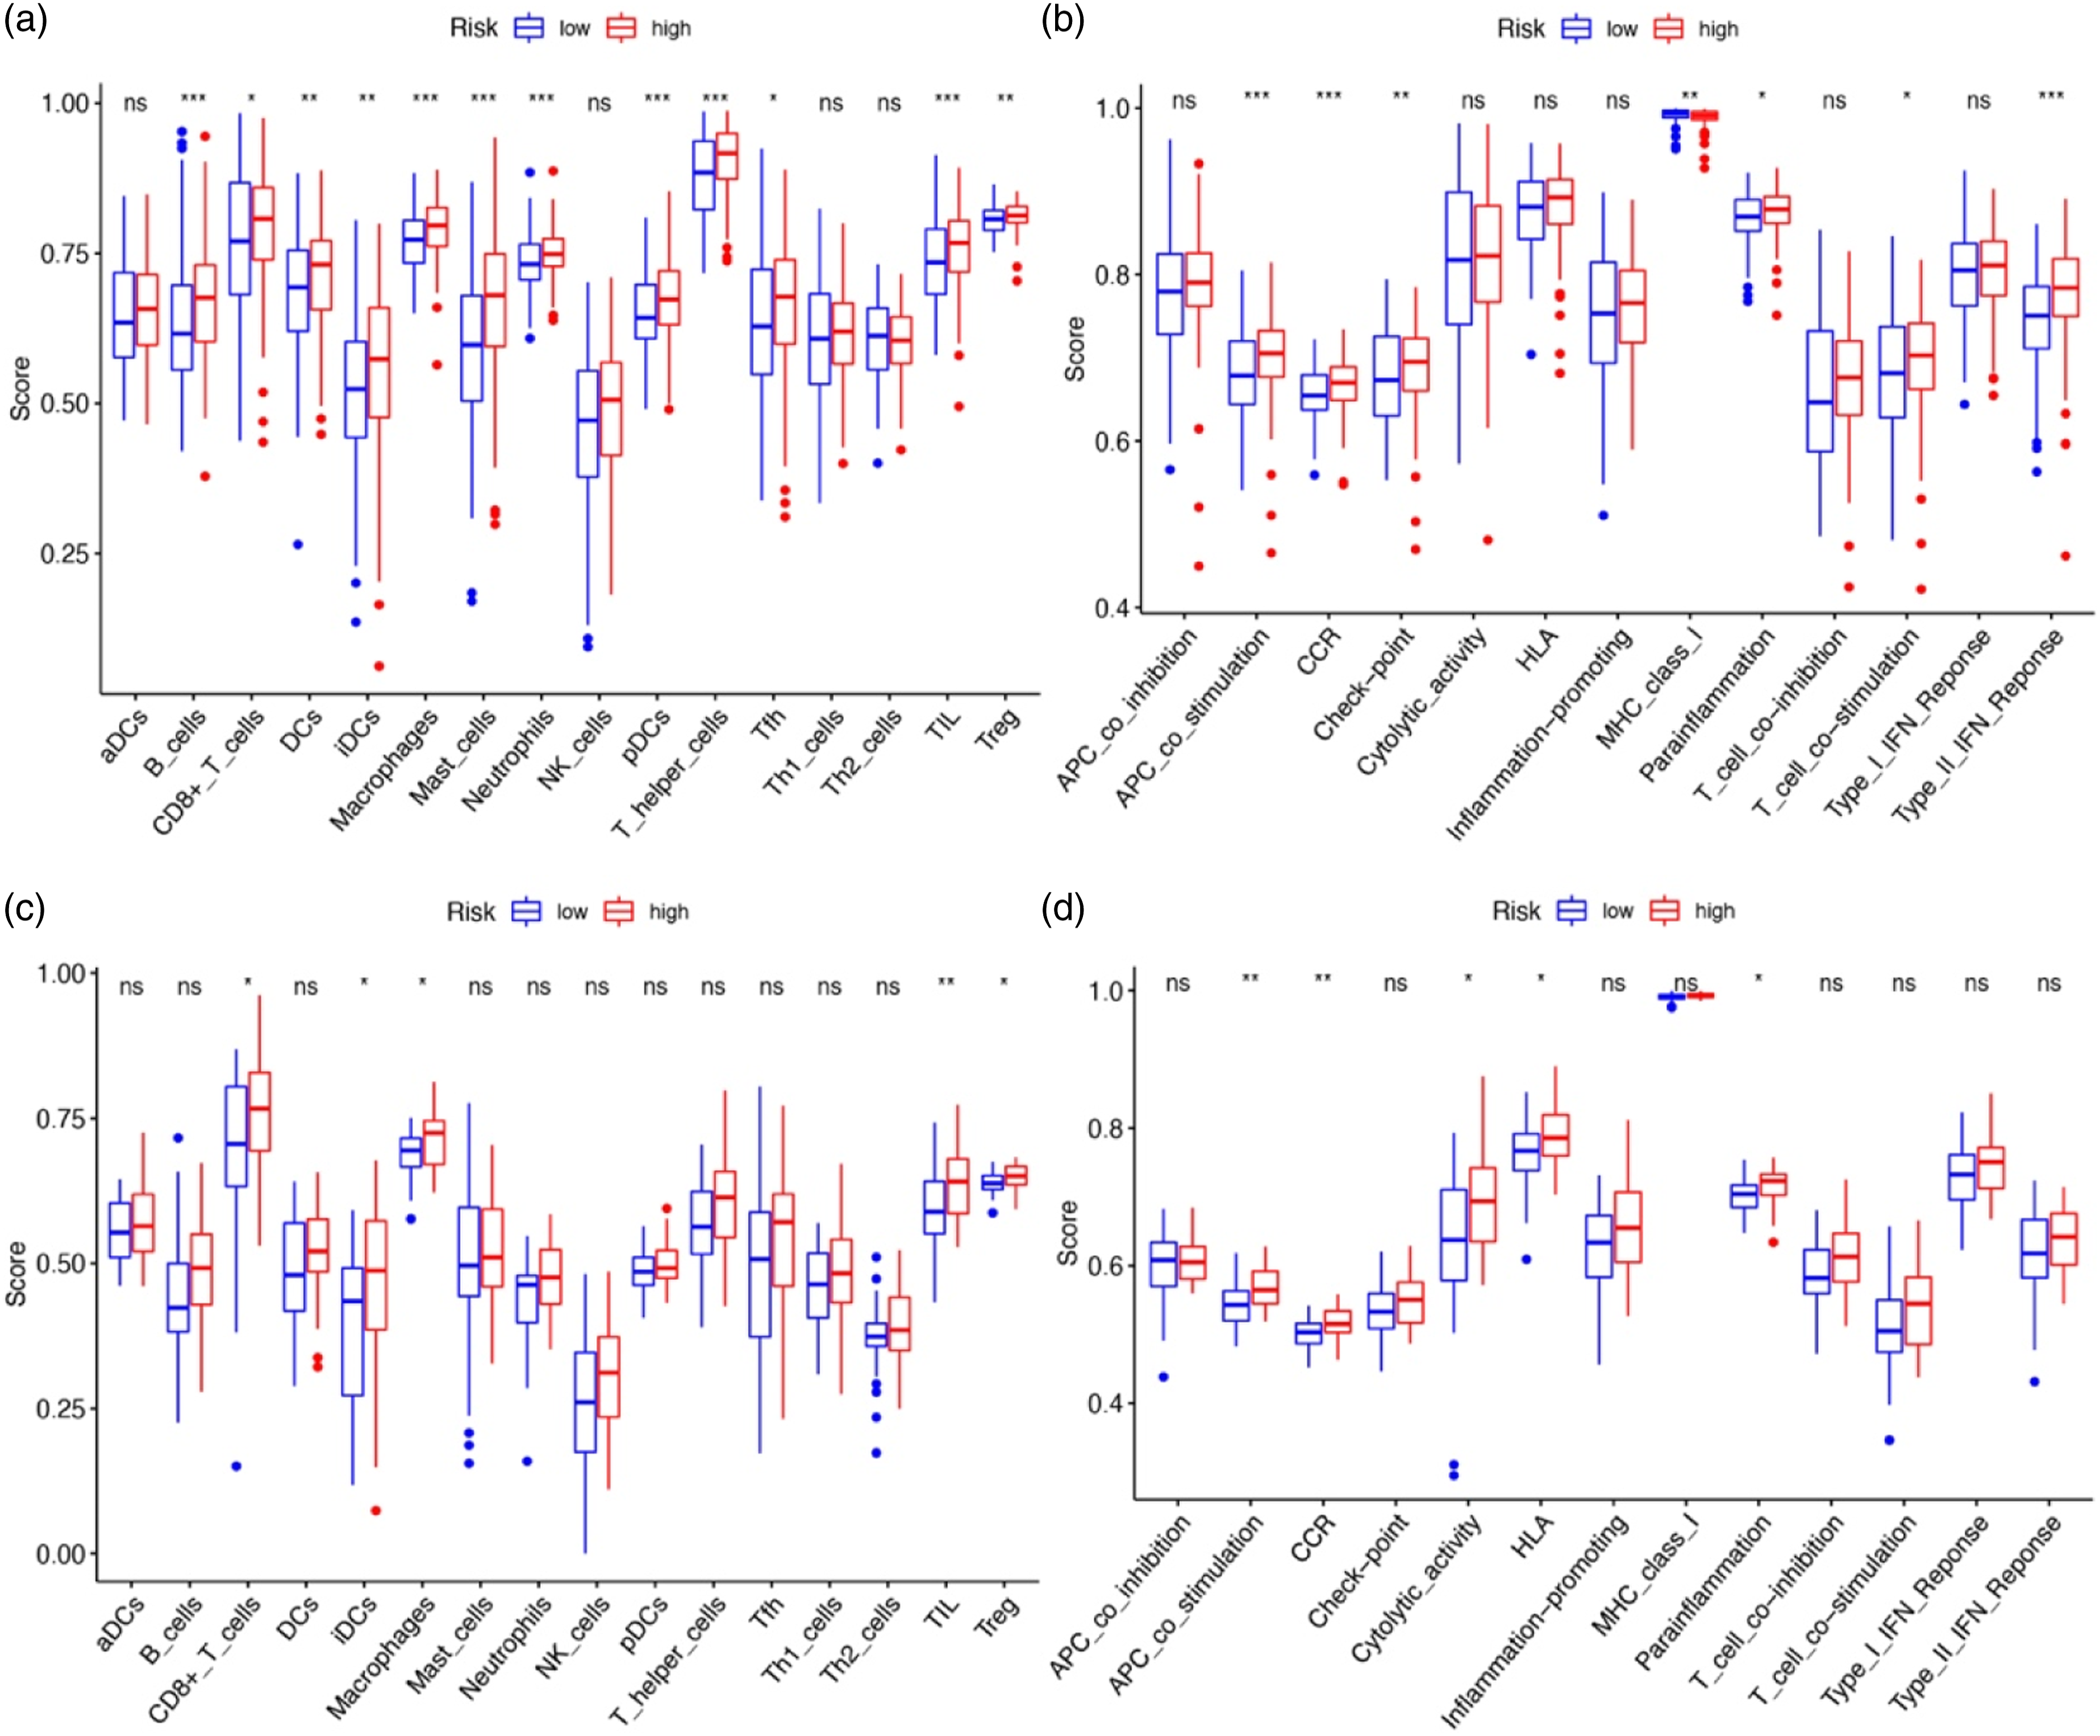
Discussion
GC has garnered much attention as a global public health concern. Despite advances in surgical procedures, chemotherapy, and radiotherapy, prognosis of advanced GC continues to remain poor. The early stages of GC are usually asymptomatic, leading to delayed diagnosis and missed opportunities for radical surgery. 17 Therefore, early diagnosis of GC is critical to improve long-term survival of patients. Additionally, discovery of new non-invasive biomarkers with high sensitivity and specificity for screening early GC is need of the hour.
Ferroptosis is a novel, regulated cell death pattern, which is iron and ROS dependent. Studies have outlined the blueprint of ferroptosis and regard it as a novel alternative for cancer therapy. 8 In the present study, we systematically studied the expression profiles of 267 ferroptosis-related genes in GC samples (data retrieved from TCGA) and their relationship with OS. First, a novel prognostic ferroptosis-related gene signature was established and verified in the test and train data. Subsequently, functional enrichment and immune-related pathway analyses were performed. Our findings indicate the potential role of ferroptosis in GC and the possibility of building a prognostic model with these ferroptosis-related genes.
The prognostic model proposed in the present study was composed of 10 ferroptosis-related genes (NFE2L2, NOX4, ATG16L1, MYB, TGFBR1, HIF1A, LONP1, NF2, DUSP1, SLC1A4). NFE2L2 (nuclear factor, erythroid 2 like 2) is a key regulator of the antioxidant response. 18 The activation of NFE2L2 can inhibit ferroptosis in hepatocellular carcinoma cells via the p62-Keap1-NFE2L2 pathway. 19 NADPH oxidase 4 isoform 4 (NOX4D) is an enzyme implicated in several pathologies, particularly idiopathic pulmonary fibrosis, a life-threatening and orphan disease. Inhibition of NOX4 could strongly suppress erastin-induced ferroptosis. 20 ATG16L1, which is an autophagy-related gene, counteracted the inhibitory action of ZFP36 plasmid on ferroptosis. 21 MYB (MYB proto-oncogene, transcription factor), 22 plays a crucial role in the regulation of haematopoiesis, suppression of which can decrease erastin-induced ferroptosis. 23 Transforming growth factor beta receptor 1 (TGFBR1) is involved in cell proliferation, differentiation, migration, and cell death. 24 TGFβ can increase the expression of NOX4. 25 HIF1A (hypoxia inducible factor 1 subunit alpha), which can mediate homeostatic responses to reduced oxygen availability in the microenvironment as a transcription factor, is a prosurvival factor in ferroptosis. 26 Lon peptidase 1, mitochondrial, (LONP1) is one of the main multi-functional enzymes in regulating mitochondrial function and cytological stability, inhibition of which could protect against erastin-induced ferroptosis in pancreatic ductal adenocarcinoma. 27 NF2, neurofibromin 2, rendered cancer cells more sensitive to ferroptosis as a frequent tumourigenic event in mesothelioma. 28 Dual specificity phosphatase 1 (DUSP1) dephosphorylates MAPKs, 29 expression of which is upregulated during ferroptosis. DUSP1 is additionally known as mitogen-activated protein kinase (MAPK) phosphatase-1 (MKP-1). 30 SLC1A4 (solute carrier family 1 member 4) encodes the alanine, serine, cysteine, and threonine exchanger 1 (ASCT1) 31 protein. It is a glutamine transporter 32 that is upregulated (≥2 fold) in erastin-treated samples. 33 In summary, eight genes (NOX4, ATG16L1, MYB, TGFBR1, LONP1, NF2, DUSP1, SLC1A4) in the prognostic model were overexpressed in ferroptosis, while the other two (NFE2L2, HIF1A) were not. However, in the context of GC, whether these genes play a role in its prognosis by influencing ferroptosis remains to be clarified, as only a few related studies have been reported in this regard.
The GO enrichment and KEGG pathway analyses were used to clarify the biological functions and pathways related to the risk score. ECM was most significantly enriched in both the test and the train data. ECM regulates tissue development and homeostasis 34 as well as contributes to neoplastic progression by providing critical biochemical and biomechanical cues that direct cell growth, survival, migration, differentiation, and modulate vascular development and immune function. 35
Although extensive research in elucidating the mechanism and relationship between cancer and ferroptosis has been conducted, the potential modulation between neoplastic immunity and ferroptosis is still elusive.
The ssGSEA showed that the scores of TIL, APC co-stimulation, and CCR were significantly different between the two risk groups in both the training and test data. In GC, TILs not only constitute immune-active principal cellular components of tumour microenvironment but also contribute to better prognosis. 36 APCs are attracted to the site of ferroptotic cells as they release the distinct ‘find me’ signals, similar to apoptosis. 37 Interestingly, CCR was significantly different between the two risk groups in this study. Further, links between the risk score and immune activity should be experimentally addressed to deduce the role of each participating immune subset.
Conclusion
We established a novel prognostic model of 10 ferroptosis-related genes that will render accurate GC prognosis. This model holds potential in providing a new diagnostic and therapeutic alternative for GC.
Limitations
The sample size of this study is limited. In future experimental research, we will expand the clinical sample size and study the specific ways of gene action at the molecular and animal levels. At the same time, further mechanism-related research is needed on the connection between the 10 ferroptosis-related genes in this manuscript, which will also be the future research direction of the team.
Footnotes
Acknowledgements
This research is part of a thesis by the first author, Ling song, with thanks to the experimental materials and sites provided by the people’s Hospital of Wuhan University. The authors wish to thank the reviewers for their careful, unbiased and constructive suggestions, which led to this revised manuscript.
Author Contributions
SL and ZH conceived the study, analysed and interpreted the data, and wrote the manuscript. FD and TJJ analysed the artificial dataset and assessed the results. All authors revised and approved the manuscript.
Declaration of conflicting interests
The author(s) declared no potential conflicts of interest with respect to the research, authorship, and/or publication of this article.
Funding
The author(s) received no financial support for the research, authorship, and/or publication of this article.
Data Availability Statement
The datasets presented in this study can be found in online repositories. The gastric cancer expression profile datasets and clinical pathology Characteristic information in test data were downloaded from the TCGA-GDC (https://portal.gdc.cancer.gov). The gastric cancer expression profile datasets and clinical pathology Characteristic information of GSE84426 in training data were downloaded from the NCBI-GEO website (![]() ).
).