
Abstract
Introduction
Colorectal cancer (CRC) has been identified as third most abundant carcinoma worldwide. CRC is associated with 12% of cancer occurrence and 9.5% of carcinoma related mortality throughout the world in 2020. 1 Huge population, 2 hereditary factors, smoking, and alcohol intake 3 is mainly responsible for the greatest number of recurrent cases and deaths in China. In order to eradicate the cancer, a number of strategies were implemented, but the occurrence of colon carcinoma increases gradually each year with limited efficiency. This further instigates the researchers to find out a new chemotherapeutic strategy to treat colon cancer effectively.
The herbal medicines are constantly being utilized in now days to treat a variety of diseases especially cancer, as they are cost effective, readily available and produce minimal side effects. The β-carboline alkaloids, a natural substance, have gain interest among the researchers for its diverse biological activities. Among the large variety of β-carboline alkaloids, harmol, a β-carboline has showed a wide spectrum of biological events especially on muscular, cardiovascular and central nervous systems (CNSs).4,5 Additionally, it also provides anxiolytic, tremorogenic and immunomodulatory effects.6,7 The marked anticancer potential of harmol was primarily linked with the inhibition of DNA topoisomerases, DNA synthesis and cyclin dependent kinases. 8 The scavenging activity of harmol against hydrogen peroxide and various oxidative agents is responsible for its antimutagenic and antigenotoxic effects. 9 Furthermore, harmol significantly reduced the cell proliferation and cell survival in breast cancer. 10 The drug screening process has identified the harmol as the potent inhibitor of androgen receptor in prostate cancer cells. 11
The development of aberrant crypt foci (ACF) in colon cancer is being recognized as primitive neoplastic abrasion. A minute segment of ACF could be malformed into the malignant phenotype by surpassing the polyp formation. 12 The histological variation often develop the aberrant crypt foci (ACF), a well-known indicator of colorectal cancer with distinct dysplastic features. 13 The chronic inflammation plays a significant role in the occurrence of colorectal cancer. A wide variety of inflammatory cytokines are produced form the gut immune cells in response to the localized inflammation in colon which leads to acute inflammation. Consequently, the chronic inflammation associated with genetic and epigenetic alterations, certainly leads to CRC. Among various inflammatory markers the IL-6 and TNF-α are primarily responsible for CRC. 14 Additionally, p53, a tumour suppressor protein and Bcl2, an anti-apoptotic protein, triggers cellular proliferation and growththrough the regulation of p53/Bcl2/Bax mediated intrinsic apoptotic pathway. Thus, any alteration of this signaling cascade due to epigenetic modification hampers the cell growth and survival machinery and leads to cancer. In this instance, the activation of p53/Bcl2 mediated intrinsic apoptotic pathway offers a potential chemotherapeutic strategy through the induction of apoptosis and the inhibition of pro-inflammatory cytokines which eradicate colon cancer progression via preventing cancer associated inflammation. 15
The combination of 1,2 dimethylhydrazine (DMH) and dextran sulfate sodium (DSS) was used for the induction of CRC in the rats. The DMH-induced colon cancer model of rat was used to study the anticancer efficacy of harmol through examining the p53/Bcl2/IL-6/TNF-α and cytokine signaling pathway associated with apoptotic events. The chemotherapeutic effect of harmol in HT-29 colon cancer cell line has also been assessed, which further correlates the in vivo and in vitro approach to establish the chemotherapeutic efficacy of harmol.
Materials and methods
Chemicals
All reagents were analytical grade reagent. The HPLC grade 98% pure harmol (#33844) was obtained from Cayman chemical (Ann Arbor, Michigan, USA). 1,2 dimithylhydrazine (1,2 DMH) (#D161802), Dextran sulfate sodium (DSS) (#75027), biotinylated goat anti-rabbit IgG (#20775), streptavidin peroxidase (#OR03L), 3,3′- diaminobenzidine (DAB) (#D12384) and proteinase K (#1.07393) were purchased from Sigma Aldrich Chemical Co. (St. Louis, MO, USA). Anti-mouse p53 (#GTX70214), anti-rabbit Bcl2 (#GTX100064), Ki-67 (#GTX16667), IL-6 (#GTX110527), TNF-α (#GTX110520) were procured from GeneTex (Irvine, California, United States). The apoptosis detection kit (#MK500) was procured from Takara Bio Inc. (Kusatsu, Japan). Other analytical grade reagents were purchased from the local facilities.
In vitro study
Cell culture
The colon cancer cell line HT-29 was obtained from ATCC (American Type Culture Collection), United States. The cells were supplemented with the DMEM growth media accompanied by 10% FBS (foetal bovine serum) and penicillin/streptomycin antibiotics. The cells were incubated at 5% CO2, 95% relative humidity at 37°C temperature.
Cell viability assay
The MTT assay was conducted through the metabolism of MTT (3-(4,5 dimethylthiozol-2-yl)-2,5-diphenyl tetrazolium bromide) by succinate dehydrogenase to form formazan crystals followed by the reduction of MTT reagent. The HT-29 cells were seeded for 24 h in incubator at 5% CO2 and 95% relative humidity. The cells were then treated with different concentrations of harmol and incubated for 24 h. After 24 h, the cells were supplemented with MTT solution and incubated for 3 h. The absorbance of solubilized formazan crystals was determined at 560 nm. % cell viability was calculated as:
% cell viability= [Mean absorbance of treated cells/Mean absorbance of untreated cells] × 100
The IC50 (Half-maximal inhibitory concentration) value was calculated from the equation y= mx+ c, where y=50, the value of m and c was determined from the viability graph.
DAPI staining protocol
The occurrence of nuclear blebbing and chromatin condensation was checked in the cells by staining them with fluorescent nuclear dye 4',6-diamidino-2-phenylindole dihydrochloride (DAPI). HT-29 cells were seeded in 6-well plate and incubated overnight. The cells were then treated with different concentrations of harmol (15, 30, and 45 μM) and incubated for 24 h. Subsequently, the cells were stained with DAPI and observed under fluorescent microscope. 16
Flow cytometric analysis
The detection of apoptotic cells in HT-29 cells was carried out by labeling the DNA with Annexin V-FITC and propidium iodide (PI). The cells were treated with different concentrations of harmol (15, 30, and 45 μM) and incubated for 24 h and simultaneously stained with FITC-conjugated Annexin V and PI at room temperature (25oC) for 15 min in dark condition. FACS (fluorescence-activated cell sorting) analysis was performed to detect the arrangement of nuclear DNA in the events of cell cycle. After conducting 10,000 events the flow-cytometric data was processed by Cell Quest Pro software (BD Biosciences, Shanghai, China). 16
In vivo study
Animals
Composition of food mixture.

aWheat flour, Bengal gram, maize and spray dried milk contain sufficient amount of vitamins and fatty acids and no extra vitamin mixtures were added to the food.
bMacromineral mix provided (g/kg food): CaCO3, 16.7; NaHPO4, NaCl, 6; KCl 12; MgO, 1.75.
cMicromineral mix provided (mg/kg food): FeSO4d 7. H2O, 216; CuSO4, 20; Ca(IO3)2, 1.3; MnO,5; CoCl2d.6H2O, 1.9; Na2SeO3, 0.30; CrCl3. 8H2O, 4; Na2Mo4d.2H2O, 15.
The endorsements by Ethics Committee of Animal and veterinary Sciences of Dongying People’s Hospital with Approval Number: JNME20210018 (2021.7–2021.11) were strictly abide by the national experiment ethics and protection regulations, and accept the supervision and inspection of the hospital medical ethics committee at any time.
In vivo study
For the carcinogenic study, 30 male Wistar rats of 5–7 weeks of age were divided into five groups of six animals. The colon cancer was developed in the rats (except group I) by the induction of DMH, 30 mg/kg in 0.9% saline via intraperitoneal (i.p.) injection. After 1 week, the tumor promoter DSS (2% w/v) in drinking water was given to the animals for 7 days18,19 The animals were treated with harmol by dissolving it in water followed by oral gavage. The treatment with harmol was continued for 4 months for chemotherapeutic study. As per the acute oral toxicity study the LD50 value of harmol was found to be 500 mg/kg for rats (data not shown). All the groups were classified as:
Group I: The normal control group was supplied with food and water. Group II: The carcinogen control group was treated with DMH and DSS in drinking water. Group III: The carcinogen induced animals were treated with 100 mg/kg harmol. Group IV: The carcinogen induced animals were treated with 200 mg/kg harmol. Group V: The carcinogen induced rats were treated with 400 mg/kg harmol.
After 18 weeks the animals were euthanized by decapitation under ether induced mild anesthesia and euthanasia was confirmed. The colonic tissues were excised and washed properly for further research.
ACF and histopathology
The distal section of excised colonic tissues were cleaned with 0.9% sodium chloride and segmented into two parts. One part was utilized to investigate ACF formation and the other part was assessed for histology and immunohistochemistry. The luminal surfaces of colon tissue were exposed on a filter paper and fixed by 10% formalin for 24 h. The staining of colon tissues was done by 0.25% of methylene blue in phosphate buffer saline (PBS) solution. 20 As per the process of Bird and Good the quantification of ACF were performed under light microscope (OLYMPUS CX 21i TR). 21 The colonic crypts were easily distinguished from normal crypts due to their intense stain, notable elliptical structure, broad epithelial lining and perycriptal area. Furthermore, the colonic tissues were kept in 10% neutral buffered formalin for fixation, followed by dehydration using a gradient of alcohol (70, 80 and 100%) and were embedded in paraffin wax. Tissue sections were cut at 5 μm thickness and mounted on glass slides. Subsequently, the slides were deparaffinized, rehydrated and stained by hematoxylin and eosin (H&E). The histopathological parameters were then investigated by light microscopy. 22
Immunohistochemistry
The slides were deparaffinized and deep into 3% H2O2 for 3 min to prevent endogenous peroxidase activity. Tissue sections were supplemented with protein blocking solution and then incubated with anti-mouse p53 (1:1000), anti-rabbit Bcl2 (1:500), IL-6 (1:500), TNF-α (1:500) antibodies for overnight at 4°C. The tissue sections were washed with PBS and treated with HRP conjugated secondary antibody for 30 min. The slides were then treated with 3,3′-diaminobenzidine (DAB) and stained with hematoxylin. The slides were placed under light microscope (OLYMPUS CX 21i TR) and images were captured followed by quantification of the immune-positive cells by ImageJ software (version 1.8.0).
Immunofluorescence assay
The slides were deparaffinized and deep into 3% H2O2 for 3 min to prevent endogenous peroxidase activity. Tissue sections were supplemented with protein blocking solution for 5–10 min at room temperature and then exposed to 1:500 diluted anti-mouse p53, anti-rabbit Bcl2, IL-6, TNF-α antibody for overnight at 4°C. The slides were washed with PBS and treated with DyLight 488 fluorescence secondary antibody at 1:100 dilutions for 30 min at room temperature. The slides were then incubated with DAPI solution for 2–3 min at room temperature and observed under fluorescence microscope.
Cellular proliferation assay
The tissue sections were treated with protein blocking solution for 1 h, and then supplemented with anti-rabbit Ki-67 antibodies diluted to 1:500 for overnight at 4°C temperature. The tissue sections were washed with PBS and treated with HRP conjugated secondary antibody for 30 min. The slides were then treated with DAB and stained with hematoxylin. The slides were placed under light microscope and images were captured followed by quantification of the Ki-67-positive cells.
TUNEL method for apoptosis
The poly-L-lysine coated slides of colon tissues were used for TUNEL assay. The slides were treated with 20 μg/mL proteinase-K in Tris-EDTA buffer and washed with distilled water. The sections were supplemented with 3% H2O2 for 3 min to block endogenous peroxidase activity. The slides were then treated with terminal deoxynucleotidyl transferase (TdT) buffer at 37°C for 90 min. The tissues were then treated with saline-citrate solution (Sigma-Aldrich) for 10 min to stop the reaction and incubated with antidigoxigenin peroxidase for 30 min. Tissue was treated with DAB and stained with hematoxylin. The slides were placed under light microscope and images were captured followed by quantification of the TUNEL-positive cells.
The labeling index (LI) was measured as the percentage of Ki-67-positive cells. The apoptotic index (AI) was determined by measuring the percentage of TUNEL-positive cells to the total number of cells.
Antioxidant activity
About 1 g of colonic sample was excised from individual animal, treated with 0.9% saline, dried and kept at −80°C. The colon tissues were homogenized by DaiHan HS-30E homogenizer (WiseStir, Republic of Korea) in a lysis buffer (250 mM sucrose, 1 mM EDTA, 1 mM DL-dithiothreitol, and 15 mMTris-HCl, pH 7.4) and the homogenate of colon tissue (1 g tissue/10 mL lysis buffer) was produced. It was then centrifuged at 800 × g for 30 min at 4°C and the supernatant was used for the antioxidant assay. 23 The activity of superoxide dismutase (SOD) was measured using the Kakkar et al. process. 24 The absorption was recorded spectrophotometrically at a wavelength of 560 nm (UV-1800; Shimadzu, Kyoto, Japan). The antioxidant activity of SOD was measured as a unit/mg supernatant. The activity of catalase (CAT) was investigated according to the process described by Narendhirakannan and his co-researchers. 25 0.2 mL of colon homogenate was thoroughly mixed with 1.2 mL 50 mM phosphate buffer (pH7.0) and 1 mL 30 mM H2O2 solution. The decrease in absorbance was recorded at 240 nm at a interval of 30 s for 3 min. The enzymatic activity was described as decomposed micromoles of H2O2/min/mg protein. The process of Seyyedi et al. was utilized to detect the activity of Glutathione S-transferase (GST) spectrophotometrically at 25°C. 26 The absorbance was recorded at 340 nm at an interval of 60 s for 3 min. The blank sample was prepared with 100 μL of PBS in 900 μL cocktail.
Statistical analysis
The statistical data were expressed as mean ± SD. The normality of distribution has not performed due to small sample size. Statistical analysis was performed by variance analysis (ANOVA), accompanied with Tukey’s multiple comparison test via Graph Pad Prism (Version 5). The differences were considered as statistically significant at p < .05.
Results
In vitro study
Harmol inhibits viability of HT-29 cells
The MTT assay demonstrated that treatment with harmol caused a dose dependent inhibition of cell viability of HT-29 cells [Figure 1(a)]. Following the treatment the viability of the HT-29 cells tends to decrease to 91.62%, 72.31%, 51.05%, 24.63% and 11.04% at concentrations of 5, 15, 30, 45 and 60 μM respectively. Subsequently the IC25, IC50 and IC75 doses of harmol were calculated which were found to be 15, 30 and 45 μM respectively. (a) Effects of harmol on cell viability of HT-29 cells at 24 hours where * represented p < .05 as compared to untreated group. Similarly # represented p < .05 as compared to 5 μm concentration. $ represented p < .05 as compared to 15 μm concentration, α p < .05 as compared to 30 μm concentration, β p < .05 as compared to 45 μm concentration (b) DAPI stained HT-29 cells after 24 hours of treatment with harmol, white arrows represented nuclear fragmentations and white arrowhead represented membrane blebbing (c) detection of apoptosis in HT-29 cells by Flow cytometry after treatment with harmol (d) percentage of apoptotic cells versus concentration in HT-29 cells where * represented p < .05 as compared to control. Similarly # represented p < .05 as compared to 15 μm concentration, $ p < .05 as compared to 30 μm concentration (e) percentage of apoptotic cells in early and late apoptosis stage in HT-29 cells. * represented p < .05 as compared to control. Similarly # represented p < .05 as compared to 15 μm concentration, $ p < .05 as compared to 30 μm concentration (f) analysis of cell cycle phase distribution of HT-29 cells after the treatment with harmol (g) quantitative of distribution of HT-29 cells in different phases of cell cycle. Data represent means ± SD from three different experiments in triplicate. The results were compared using ANOVA, followed by a Tukey’s multiple comparison post-hoc analysis.
Harmol causes chromatin condensation within HT-29 cells
Figure 1(b) exhibited the nucleosomal fragmentation of HT-29 colon cancer cell due to harmol therapy. The harmol treatment at different concentrations (15, 30 45 μM) caused nucleosomal fragmentation and formation of apoptotic bodies in cytoplasm but the maximum chromatin condensation was observed in 45 μM harmol treated group, after 24 h of incubation.
Effect harmol in cell cycle and apoptosis
The induction of apoptosis in HT-29 cells, due to harmol treatment at different concentrations for 24 h has been depicted in [Figure 1(c)]. The percentages of apoptotic cell are 15.93%, 39.16% and 44.8% followed by the treatment with 15, 30, and 45 μM of harmol in HT-29 cells [Figure 1(d)]. Moreover, the harmol treated cells also showed an increase of cell population in early apoptotic stage after 24 h of incubation [Figure 1(e)].
According to the cell cycle analysis the apoptotic cells were represented as sub diploid cells in [Figure 1(f)]. Treatment of the HT-29 cells with 15, 30 and 45 μM of harmol denoted 64.69%, 62.14% and 51.45% cells in the G0/G1 phase. Along with that, harmol treatment showcased an increased cell population in the S-phase in HT-29 cell [Figure 1(g)].
In vivo carcinogenesis study
Counting of ACF
The animals belongs to normal control group was not associated with any formation of ACF, but a significant amount of ACF was recorded in the animals of carcinogen treated group. The colonic crypts were easily distinguished from normal crypts due to their intense stain, notable elliptical structure, broad epithelial lining and perycriptal area. A significant reduction of ACF multiplicity was denoted in the harmol treated group as compared to carcinogen control group (p < .05). The most significant suppression of the ACF was exhibited in the 400 mg/kg harmol treated group as compared to the carcinogen control group (p < .05) [Figure 2]. (i) Effect of harmol on ACF. Topographical view of colon mucosa after staining the tissue with methylene blue. ACF were observed and distinguished from the surrounding normal crypts due to their intense stain, notable elliptical structure, broad epithelial lining, increased size, distance from the lamina to basal cell surfaces and pericryptal zone at 10X magnification. (a) colon mucosa of normal control group (b) the dimethylhydrazine + dextran sulfate sodium control group (c) 100 mg/kg of harmol treated group (d) 200 mg/kg of harmol treated group (e) 400 mg/kg of harmol treated group. The arrows show the crypts (ii) Effect of harmol on number of crypts per ACF (iii) Effect of harmol on total number of ACF. * represented p <0.05 as compared to normal control. Similarly # represented p < .05 as compared to carcinogen control group, $ p < .05 as compared to harmol 100 mg/kg group, α p < .05 as compared to harmol 200 mg/kg group. All the data are expressed as mean ± SD (n = 6). Results were analyzed by one-way ANOVA and confirmed by Tukey’s multiple comparison tests. ACF = aberrant crypt foci.
Histopathological analysis
In carcinogen control group the histological analysis of the colon tissues exhibited non-invasive carcinoma with mucosal lesions [Figure 3]. The hyperplasia and severe mucosal dysplasia was also associated with amplified ACF. The hyperplastic mucosal region was composed of goblet cells and absorptive cells with partial mucin diminution. The colonic lumen of the carcinogen control group is much protruding and extended in comparison to the normal lumen [Figure 3(a)]. Figure 3(b) denoted the dysplastic ACF with mucosal proliferation, complete mucin depletion and loss of goblet cells. The reduction in adenoma formation was observed in the harmol treated group [Figure 3(c)–(e)]. In 100 and 200 mg/kg harmol treated group did not show any epithelial sloughing in the colonic tissue, but a minor hyperplasia was noted in epithelial layer. The formation of ACF and the occurrence of mucin depletion was also reduced [Figures 3(c) and (d)]. The 400 mg/kg harmol treated group demonstrated the occurrence of goblet cells in the colon tissue, along with a substantial decrease in ACF multiplicity. Moreover, absence of mucin depletion was recorded in the 400 mg/kg of harmol treated groups [Figure 3(e)]. Histological study of colon mucosa of rats at 10X and 40X magnification. (a) the mucosa of normal control group denoting mucosa (M), submucosa (Sm), muscularis mucosa (Mm), Columnar absorptive cells (CAC), Lamina propia, crypts (C), Absorption cells (Ac) and distinct goblet cells (Gc) (b) the colon tissue of dimethylhydrazine + dextran sulfate sodium control groups showing depletion of mucin (DM), hyperplasia (Hyp), dysplasia (Dys) (c) the colon mucosa of animals treated with 100 mg/kg of harmol depicting dilation of Column (Dc), discontinuation of absorption cells denoted by arrowhead and loss of goblet cells (c), depletion of mucin (DM) (d) the colon mucosa of animals treated with 200 mg/kg of harmol depicting hyperplasia (Hyp) and neutrophil infiltration (Nu inf) (E) the colon mucosa of animals treated with 400 mg/kg of harmol depicting goblet cells (Gc), newly formed crypts (C) and no depletion of mucin.
Antioxidant activity
A reduced level of SOD, CAT and reduced glutathione were observed in colon tissue of carcinogen control group as compared to the normal control group (p < .05). However, the noticeable upregulation in the SOD, CAT and glutathione levels was observed in the 400 mg/kg harmol treated group as compared to the carcinogen control animals (p < .05) [Figure 4]. Effect of harmol on in vivo antioxidant enzymes SOD (superoxide dismutase) and CAT (catalase), (glutathione) GST.* Significant difference as compared to carcinogen control group (p < .05). # Significant difference as compared to 100 mg/kg group(p < .05). $ Significant difference as compared to 200 mg/kg group (p < .05).
Immunohistochemical analysis
The immunohistochemical profiling of p53, Bcl2, IL-6 and TNF-α on colon tissue was demonstrated in [Figure 5(i)–(iv)] respectively. The carcinogen control group significantly (p < .05) decreased the expression of p53 [Figure 5(i)(b)] but an upregulation in Bcl2, IL-6 and TNF-α [Figure 5 (ii)(b), (iii)(b) and (iv)(b)] expression was denoted in the colonic mucosa and in goblet cells as compared to the normal control group [Figure 5(i)(a)–(iv)(a)]. A significant (p < .05) upregulation in the expression of p53 in the goblet cells and colonic mucosal area was observed in harmol treated group [Figure 5(i)(c)–(e)] as compared to carcinogen control group. Whereas, the expressions of Bcl2, IL-6 and TNF-α were decreased significantly (p < .05) in harmol treated group [Figure 5(ii)(c)–(e), (iii)(c)–(e) and (iv)(C)–(E)] in comparison to carcinogen control group. The 400 mg/kg harmol treated group was significantly (p<0.05) more efficient in the upregulation of p53 expression [Figure 5 (i)(e)] while significantly (p<0.05) suppressed the expression of Bcl2, IL-6 and TNF-α [Figure 5(ii)(e), (iii)(e) and (iv)(e)] as compared to the carcinogen treated groups [Figure 5(v)]. [i] The immunohistochemical analysis of the p53 expression in the colon tissues of different groups of rats at 40X magnification. (a) the normal control group showing standard expression of p53 (b) the DMH + DSS treated group showing fewer expression of p53 as compared to the normal control (c) & (d) the 100 mg/kg and 200 mg/kg harmol treated animals showing mild to moderate expression of p53, represented by white arrows (e) the 400 mg/kg harmol treated animals showing significant expressions of p53. [ii] The immunohistochemical analysis of the Bcl2 expression in the colon tissues of different groups of rats at 40X magnification. (a) the normal control group showing standard expression of Bcl2 (b) the DMH + DSS treated group showing significant expression of Bcl2 protein, represented by white arrows (c) the 100 mg/kg treated animals depicting less expression of Bcl2 as compared to the carcinogen control group (d) & (e) the 200 and 400 mg/kg harmol treated animals showing mild to moderate expression of Bcl2. [iii] The immunohistochemical analysis of the IL-6 expression in the colon tissues of different groups of rats at 40X magnification. (a) the normal control group showing standard expression of IL-6 (b) the DMH + DSS treated group showing significant expression of IL-6 as compared to the normal control, represented by white arrows (c) the 100 mg/kg treated animals depicting fewer expression of IL-6 as compared to the carcinogen control group (d) & (e) the 200 and 400 mg/kg harmol treated animals showing mild to moderate expression of IL-6. [iv] The immunohistochemical analysis of the TNF-α expression in the colon tissues of different groups of rats at 40X magnification. (a) the normal control group showing standard expression of TNF-α (b) the DMH+DSS treated group showing significant expression of TNF-α as compared to the normal control, represented by white arrows (c) the 100 mg/kg treated animals depicting fewer expression of TNF-α as compared to the carcinogen control group, represented by white arrows (d) & (e) the 200 and 400 mg/kg harmol treated animals showing mild to moderate expression of TNF-α. [v] Effect of harmol on the expression of p53, TNF-α, Bcl2 and IL-6 in colon tissues. * represented p < .05 as compared to normal control. Similarly # represented p < .05 as compared to carcinogen control group, $ p < .05 as compared to harmol 100 mg/kg group, α p < .05 as compared to harmol 200 mg/kg group. All the data are expressed as mean ± SD (n = 6). Results were analyzed by one-way ANOVA and confirmed by Tukey’s multiple comparison tests. DMH + DSS = dimethylhydrazine + dextran sulfate sodium.
Immunofluorescence analysis
The immunofluorescence analysis of p53, Bcl2, IL-6 and TNF-α on colon tissue was demonstrated in [Figure 6(i)–(iv) ] respectively. The carcinogen control group significantly (p < 0.05) decreased the expression of p53 [Figure 6(i)(b)] whereas an upregulation in Bcl2, IL-6 and TNF-α [Figure 6(ii)(b), (iii)(b) and (iv)(b)] expression was denoted in the colonic mucosa and in goblet cells in comparison to the normal control group [Figure 6(i)(a)–(iv)(a)]. A significant (p < .05) upregulation in the p53 expression in goblet cells and colonic mucosal area was observed in harmol treated group [Figure 6(i)(c)–(e)] as compared to carcinogen control group. Whereas, the expressions of Bcl2, IL-6 and TNF-α were significantly (p < .05) decreased in harmol treated group [Figure 6(ii)(c)–(e), (iii)(c)–(e) and (iv)(c)–(e)] in comparison to carcinogen control groups. The 400 mg/kg harmol treated group was significantly (p < .05) more efficient in the upregulation of p53 expression [Figure 6(i)(e)] while significantly (p < .05) suppressed the expression of Bcl2, IL-6 and TNF-α [Figure 6(ii)(e), (iii)(e) and (iv)(e)] as compared to the carcinogen treated groups [Figure 6(v)]. [i] The immunofluorescence analysis of the p53 expression in the colon tissues of different groups of rats at 40X magnification. (a) the normal control group showing standard expression of p53 (b) the DMH+DSS treated group showing fewer expression of p53 as compared to the normal control (c) & (d) the 100 mg/kg and 200 mg/kg harmol treated animals showing mild expression of p53 (e) the 400 mg/kg harmol treated animals showing significant expressions of p53, represented by white arrows. [ii] The immunofluorescence analysis of the Bcl2 expression in the colon tissues of different groups of rats at 40X magnification. (a) the normal control group showing standard expression of Bcl2 (b) the DMH+DSS treated group showing significant expression of Bcl2 protein, represented by white arrows (c) the 100 mg/kg treated animals depicting less expression of Bcl2 as compared to the carcinogen control group, represented by white arrows (d) & (e) the 200 and 400 mg/kg harmol treated animals showing mild expression of Bcl2. [iii] The immunofluorescence analysis of the IL-6 expression in the colon tissues of different groups of rats at 40X magnification. (A) the normal control group showing standard expression of IL-6 (B) the DMH+DSS treated group showing significant expression of IL-6 as compared to the normal control, represented by white arrows (C) the 100 mg/kg treated animals depicting fewer expression of IL-6 as compared to the carcinogen control group, represented by white arrows (d) & (e) the 200 and 400 mg/kg harmol treated animals showing mild expression of IL-6. [iv] The immunofluorescence analysis of the TNF-α expression in the colon tissues of different groups of rats at 40X magnification. (A) the normal control group showing standard expression of TNF-α (B) the DMH+DSS treated group showing significant expression of TNF-α as compared to the normal control, represented by white arrows (C) the 100 mg/kg treated animals depicting fewer expression of TNF-α as compared to the carcinogen control group, represented by white arrows (D) & (E) the 200 and 400 mg/kg harmol treated animals showing mild expression of TNF-α [v] Effect of harmol on the expression of p53, TNF-α, Bcl2 and IL-6 in colon tissues. * represented p < .05 as compared to normal control. Similarly # represented p < .05 as compared to carcinogen control group, $ p < .05 as compared to harmol 100 mg/kg group, α p < .05 as compared to harmol 200 mg/kg group. All the data are expressed as mean ± SD (n = 6). Results were analyzed by one-way ANOVA and confirmed by Tukey’s multiple comparison tests. DMH + DSS = dimethylhydrazine + dextran sulfate sodium.
Harmol causes suppression of Ki-67
The Ki-67 labeled cells can be distinguished due to its intense nuclear localization with DAB, producing a brown stain which enables them quantifiable. The Labeling index (LI), percentage of Ki-67 labeled cells, has been represented in [Figure 7(iii)]. The expression profile of Ki-67 in normal control group was demonstrated in [Figure 7(i)(a)]. Significantly increased amount of Ki-67 labeled cells were found in colonic mucosa and in lamina propria of carcinogen control group as compared to normal control group [Figure 7(i)(b)]. A significant decrease (p < .05) in the Ki-67 labeled cells were observed in the harmol (100, 200, 400 mg/kg) treated group [Figure 7(i)(C)–(E)] in comparison to carcinogen treated group. [i] The immunohistochemical analysis of expression of Ki-67 of different group of rats at 40X magnification. (a) the normal control group showing regular expressions of Ki-67 (b) the DMH+DSS treated group showing strong expression of Ki-67, represented by white arrowheads; (c) & (d) the 100 and 200 mg/kg harmol treated groups showing mild Ki-67 expression respectively (e) the 400 mg/kg harmol treated groups showing significant reduction in Ki-67 expression. [ii] The immunohistochemistry of TUNEL apoptotic cells at 40X magnification. (a) the normal control group showing normal apoptosis (b) the dimethylhydrazine + dextran sulfate sodium treated group showing weak apoptosis (c) & (d) the 100 and 200 mg/kg harmol treated groups showing moderate apoptosis respectively (e) the 400 mg/kg harmol treated group showing significant increase in apoptosis, represented by white arrowheads. Approximately 700 cells were counted per field, 10 fields were examined per slide and 10 slides were examined per group. [iii] Effect of harmol on cell proliferation [iv] Effect of harmol on apoptosis [v] Effect of harmol on R value (R denoted Ki-67-LI/AI). * represented p < .05 as compared to normal control. Similarly # represented p<0.05 as compared to carcinogen control group, $ p < .05 as compared to harmol 100 mg/kg group, α p < .05 as compared to harmol 200 mg/kg group. All the data are expressed as mean ± SD (n = 6). Results were analyzed by one-way ANOVA and confirmed by Tukey’s multiple comparison tests.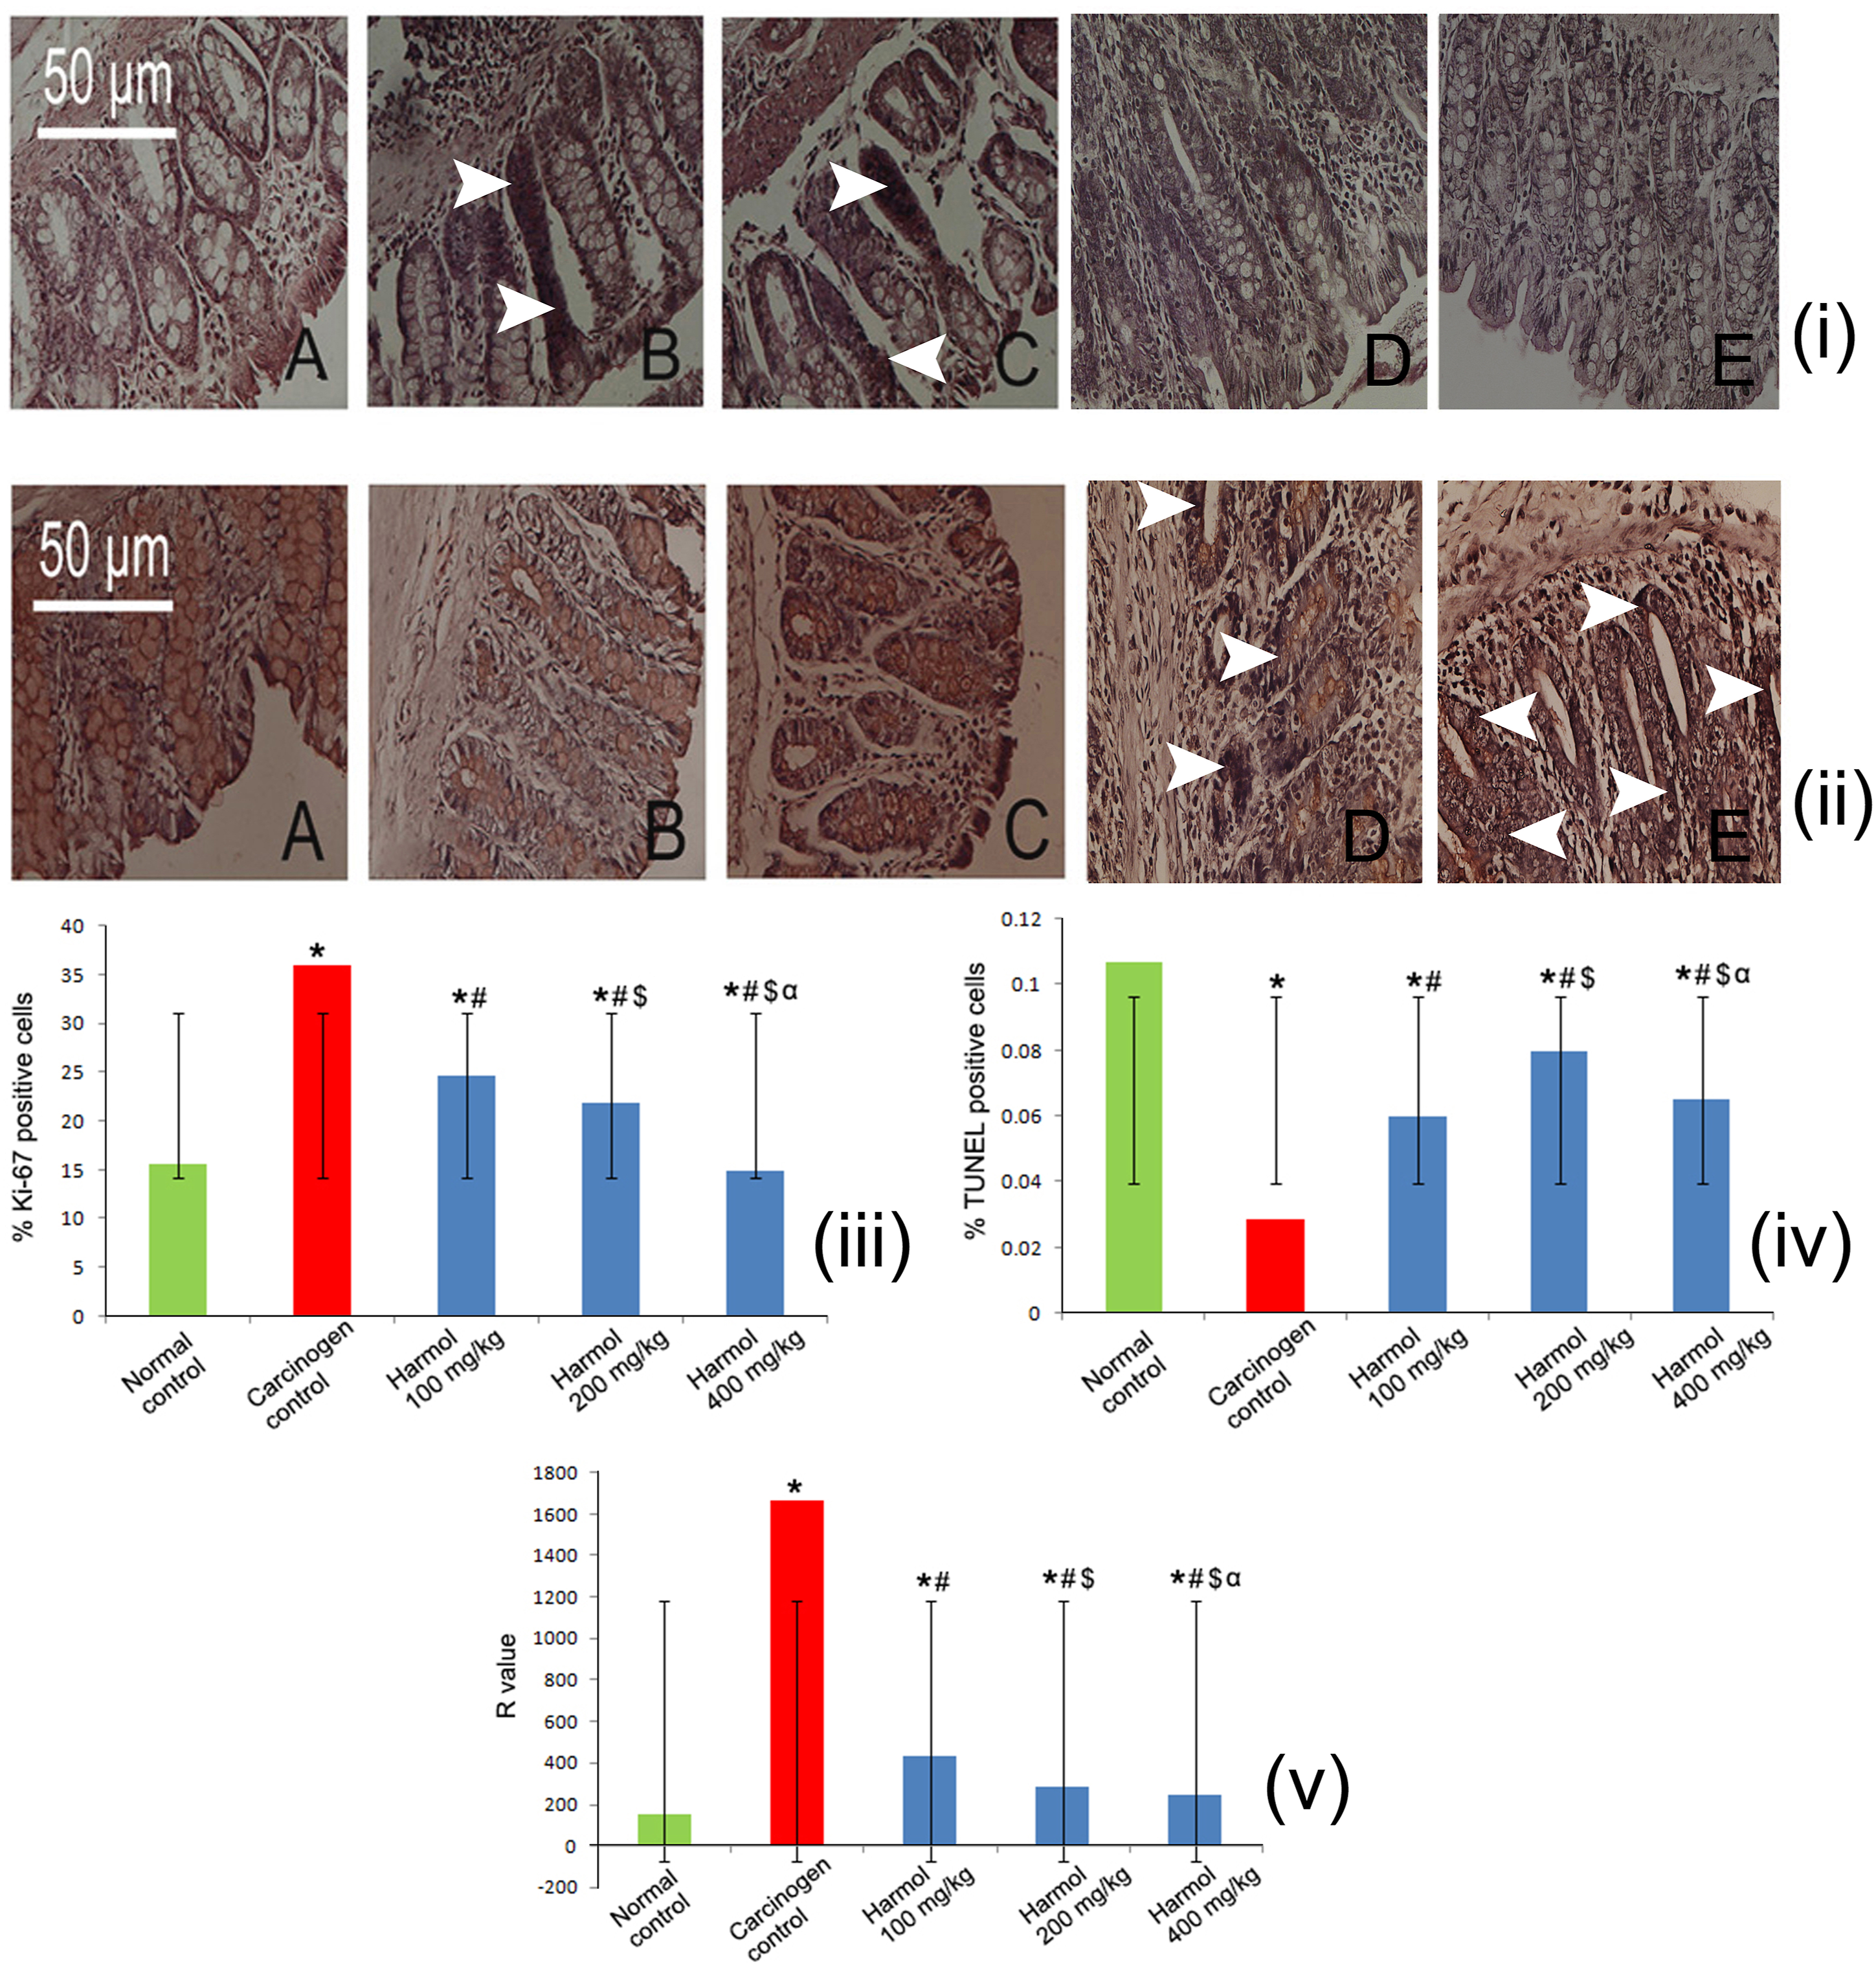
Harmol induces apoptosis
The TUNEL positive cells were distinguished due to intense brown staining that overlay the chromatin condensation of apoptotic bodies produced by DAB. A moderated amount of TUNEL positive cells were identified in normal control group [Figure 7(ii)(a)]. On the other hand, a significant (p < .05) decrease in the TUNEL positive cells were denoted in the carcinogen control group as compared to normal control group [Figure 7(ii)(b)]. A minimum of 3 to 5 TUNEL positive cells were distinguished in a field of 700 cells in carcinogen control group. The rate of apoptosis was significantly (p < .05) augmented in the goblet cells and mucosal area in the harmol treated group as compared to carcinogen control group [Figure 7(ii)(c)–(e)]. An average of 10–15 TUNEL positive cells were distinguished in 400 mg/kg harmol treated group [Figure 7(ii)(e)]. The apoptotic index (AI) was depicted in [Figure 7(iv)]. The R value denoted the ratio of cell proliferation to apoptosis. The research findings suggested that upregulated R value of the carcinogen treated group depicted increased proliferative activity and the minimized R value in the harmol treated groups showcased increased events of apoptosis with decreased cell proliferation [Figure 7(v)].
Discussion
The rapid increase of colon cancer incidences are associated with limited therapeutic strategies and diagnostic failure at progressive stages. 27 The increased side effects of anticancer drugs leads to worse clinical outcome. As a result, drug resistance and increased adverse effects remain the most significant impediment to effective CRC treatment. 28 Thus, in this research the significant chemotherapeutic impact of harmol as a new anticancer drug with minimal adverse effects has been explored.
The chemotherapeutic efficacy of harmol against coloncarcinoma as well as its putative underlying mechanism of action has yet to be determined. So, the current study designed to establish the anticancer effect of harmol in HT-29 colon cancer cell and a rat model of DMH induced colon cancer. Studies suggested that, harmol triggers apoptosis in the human lung carcinoma cell through the activation of caspase-8 29 and downregulates survivin in human glioma cells thus induces autophagy and apoptosis. 30 In this study, MTT analysis of HT-29 cells indicated that harmol therapy significantly decreased the cell viability and cell proliferation through the induction of apoptotic events. The apoptotic events initiated by harmol was further observed by flow cytometric analysis which indicated a significant percentage of early apoptotic events in HT-29 cells. Additionally, the regulation of cell cycle in cancers cell has already been demonstrated as a potential approach for cancer cell regulation. 31 It was observed that, the regulators of cell cycle are often mutated in cancer microenvironment. 32 In this context, our study demonstrated that treatment with harmol significantly halted the cells in G0/G1 phase, that ultimately lead to apoptosis.
The histological analysis of the colon tissue exhibited the hyperplastic lesion on the colonic mucosa in the animals of carcinogen control group. Additionally, the carcinogen control group was also associated with increased ACF multiplicity and complete mucosal dysplasia. The treatment with harmol causes a significant decrease in the ACF multiplicity was observed in the harmol treated group. Along with that, normal cellular morphology of colon tissue was restored with substantial decrease of hyperplastic lesion. These evidences strongly suggested the anticancer activity of harmol.
The immunohistochemical profiling of p53, Bcl2, TNF-α and IL-6 in the colon tissues has been carried out which portraying a broad overview into the mechanistic approach of harmol against colon cancer. There is a vivid correlation between the chronic inflammation and the induction of cancer. The chronic inflammation is mainly mediated through the pro-inflammatory cytokines such as TNF-α and IL-6, which also promote the epigenetic alterations in the promoter regions of the tumor suppressor proteins and cell cycle regulatory genes. Thus causes inactivation of p53, a tumor suppressor protein. The previous research findings suggested that the methylation of p53 at the promoter region by IL-6 is one of the key mechanisms which inactivates p53 and promotes the cellular proliferation and cell survival of the cancer cells. 33 Additionally, IL-6 is also capable of activating the c-myc messenger RNA (mRNA) translation, which induces mouse double minute 2 homolog (MDM2)-mediated proteasomal degradation of p53 and results in the downregulation of p53 expression. 34 Taken together, IL-6 mediated downregulation of p53 expression associated with reduced apoptosis of the cancer cells which certainly promotes the survival of cancer cells and triggers inflammation.
In carcinogenic progression, the inflammatory marker like TNF-α (tumor necrosis factor), plays a crucial role. 35 The dual role of TNF-α has been found in cancer progression. In inflammation-associated carcinogenesis the involvement of TNF-α has been identified which supports tumor growth, cancer cell survival, metastasis and destabilize the immune responses. 36 The elevated serum levels of TNF-α is also associated with several malignancies, with significant pre-neoplastic and neoplastic tissues. IL-6, a pro-inflammatory cytokine, exhibits similar effects as TNF-α-induced inflammation. 37 In large number of clinical trials with various malignancies, the increased serum levels of IL-6 showcased tumor-type-independent systemic phenomenon. Furthermore, the elevated serum levels of IL-6 are directly associated with severity of cancer and poor therapeutic management in cancer patients. 38 As per the animal experimentation an upregulation of TNF-α and IL-6 expression was observed in the carcinogen treated group but the treatment with harmol significantly decreased TNF-α and IL-6 expressions which clearly suggested that harmol therapy has a advantageous outcome against colon cancer.
The increased expression of Ki-67 serves as an indicator of abnormal epithelial cell proliferation and pre-neoplasia. 39 Research finding suggested that p53 regulates the DNA replication via altering the levels of Ki-67. 40 Thus, the induction of DMH and DSS caused a significant increase in Ki-67 labeled cells with reduced AI value. As a result, the increased R value directly leads to uncontrolled cell proliferation with increased multiplication of ACF in the colonic mucosa. Treatment with harmol significantly decreased the LI value and subsequently increased AI value which in turn, increased p53 mediated intrinsic apoptotic events in the cancer cells and eradicates multiplication of ACF and hyperplastic lesions. In spite of that, some limitations has been came forward that need to be reconsidered such as evaluations of power analysis, expression profile of several inflammatory markers which increases the acceptance of this molecule in clinical settings.
Conclusion
Taking together, our approach towards chemotherapeutic efficacy of harmol against colon carcinoma exhibited remarkable efficacy at different doses. The chemotherapeutic efficacy of harmol against colon carcinoma was exhibited through the induction of p53/Bcl2 mediated intrinsic apoptosis in the cancer cells with significant downregulation of inflammatory markers such as IL-6, TNF-α which are responsible for the initiation and progression of colon cancer [Figure 8]. Moreover, the correlation between in vitro and in vivo studies presented undeniable proof that harmol treatment can interrupt the development of colorectal cancer and it may serve as a potential drug candidate against colorectal cancer in clinical aspect in the immediate future. The possible anticancer mechanism of harmol against colon carcinoma.
Footnotes
Acknowledgements
The authors are grateful to Department of Gastroenterology, Dongying People’s Hospital for their constant support throughout the research.
Author contributions
Guo N designed, planned and executed the experiments. Gao J analyzed the data and wrote the manuscript.
Declaration of conflicting interests
The author(s) declared no potential conflicts of interest with respect to the research, authorship, and/or publication of this article.
Funding
The author(s) received no financial support for the research, authorship, and/or publication of this article.
Ethical approval
The endorsements by Ethics Committee of Animal and veterinary Sciences of Dongying People's Hospital with Approval Number:JNME20210018 (2021.7-2021.11) were strictly abide by the national experiment ethics and protection regulations, and accept the supervision and inspection of the hospital medical ethics committee at any time.