
Abstract
Introduction
Colorectal cancer is the third most common malignancy and the second most deadly cancer worldwide. In 2020, colorectal cancer (CRC) accounts for 10% of global cancer incidence and 9.4% of cancer deaths. 1 China had the highest number of prevalent cases, new cases, and deaths, which may be due to large population, 2 genetic factors, ethnicity, obesity and physical inactivity, smoking and alcohol consumption, and other related risk factors. 3 In attempts to cure the disease, a variety of approaches have been taken, but the prevalence of colon cancer continues to rise exponentially every year due to numerous side effects, which in turn limit its efficacy. So the scenario has come to look for the novel chemotherapeutic approach.
In the development of colorectal carcinoma, aberrant crypt foci (ACF) are being considered as the most primitive neoplastic lesions. Only a tiny fraction of ACF can be transformed into the malignant phenotype and initiates CRC, without attaining the polyp formation.4–6 The histopathological alteration due to the changes in various signaling pathway leads to the formation of aberrant crypt foci (ACF). ACFs, particularly those with dysplastic characteristics, are biomarkers of increased colorectal cancer risk. 7
Eupafolin can be obtained from Eupatorium perfoliatum L., as an active component, a traditional herbal medicine from China and India.8,9 Eupafolin demonstrates a number of biological activities such as anti-inflammatory, anti-oxidant, and anti-tumor effects.10–12 According to the recent studies, eupafolin also shown to have a variety of pathological outcome including anti-inflammatory action in acute renal injury, triggering apoptosis in cervical cancer, and stimulating mitochondrial metabolism.10,13,14 Besides that, eupafolin also shows a number of anticancer activities which includes suppression of esophageal cancer growth by targeting T-LAK cell-originated protein kinase, 15 induction of apoptosis in human cervical adenocarcinoma HeLa cells, 13 demonstrating strong anti-angiogenic and anticancer activity in hepatocellular carcinoma, 16 and suppression of prostate cancer through the modulation of phosphatidylinositol 3-kinase-mediated Akt signaling. 12 Along with that eupafolin also ameliorates lipopolysaccharide-induced cardiomyocyte autophagy via PI3K/AKT/mTOR signaling pathway. 17 But till now, no evidence of the anti-cancer ability of eupafolin for colon cancer has been identified.
In intrinsic apoptotic pathway, p53/bcl2/bax signaling plays an important role. In hematopoietic cancers, a significant overexpression of Bcl-2 was found, while in solid tumors, p53 mutations were primarily found. Over the last 15 years, it has been shown that there is a strong genetic and biochemical interaction between these two proteins and the relation between p53 and Bcl-2 signaling possesses a significant role in cancer biology. In this context, p53 is the tumor suppressor protein and bcl2 is anti-apoptotic protein which in turn also induces the cellular proliferation and cellular growth in response to the carcinogenic influence and genetic alterations; thus, in certain cases, p53 loss and Bcl-2 overexpression may have nearly similar effects on tumor pathology. 18 Apparently, encouraging the interaction between p53 and Bcl-2 offers a perfect approach for anticancer therapies.
Colorectal cancer can be induced in rodents by administration of 1,2 dimethylhydrazine (DMH) together with the tumor promoter, dextran sulfate sodium (DSS).19,20 This model of DMH-induced colon carcinoma combined with inflammation can be used to investigate the anticancer potential of eupafolin by modulating the P53/Bcl2/Bax signaling pathway that is closely associated with apoptosis.
Materials and methods
Chemicals
All reagents were analytical reagent grade. The HPLC grade 97% purity eupafolin (2-(3,4-dihydroxyphenyl)-5,7-dihydroxy-6-methoxy-4H-chromen-4-one), 1,2 Dimithylhydrazine (1,2 DMH), Dextran sulfate sodium (DSS), biotinylated goat anti-rabbit IgG, streptavidin peroxidase, 3,3′-diaminobenzidine (DAB), and proteinase K were purchased from Sigma Aldrich Chemical Co. (St Louis, MO, USA). Rabbit anti-rat p53, Bax, Bcl2, proliferating cell nuclear antigen (PCNA), and IL-6 were procured from ANASPEC Inc. (San Jose, CA). The apoptosis detection kit was obtained from Takara Bio Inc. (Kusatsu, Japan). Other reagents were obtained in the purest form from local firms.
Animals
Composition of food mixture.

aWheat flour, Bengal gram, maize and spray dried milk contain sufficient amount of vitamins and fatty acids and no extra vitamin mixtures were added to the food.
bMacromineral mix provided (g/kg food): CaCO3, 16.7; NaHPO4, NaCl, 6; KCl 12; MgO, 1.75.
cMicromineral mix provided (mg/kg food): FeSO4d 7. H2O, 216; CuSO4, 20; Ca(IO3)2, 1.3; MnO,5; CoCl2d.6H2O, 1.9; Na2SeO3, 0.30; CrCl3. 8H2O, 4; Na2Mo4d.2H2O, 15.
The recommendations by Ethics Committee of Animal Sciences of Xijing Hospital, Fourth Military Medical University with Approval Number: 2021086567 were strictly maintained during the entire animal experimentation.
Acute oral toxicity (LD50) study
The acute oral toxicity of eupafolin has been determined with slight modifications with the recommendations of the Organization for Economic Cooperation and Development (OECD) for the Testing of Chemicals, TG 420 (adopted December 2001). The toxicity study was performed with 30 Balb/c mice of both sexes (females were nulliparous) which were randomly allocated to five groups of six, three of each sex, to define the lethal dose (LD50) of eupafolin, and the animals were fasted for 18 h. The animals were divided into control group (water-treated) and four test groups (treated with eupafolin at 2000, 500, 400, and 200 mg/kg). After drug treatment, food and water were supplied to the animals immediately and were observed for 3 days after treatment with medications. 22
Sub-Acute oral toxicity study (28 days)
Fifty healthy adult Balb/c mice (both sexes) were randomly divided into five groups: eupafolin treated (50 mg/kg, 100 mg/kg, 200 mg/kg, and 400 mg/kg) and a control group. Every group was made up of 10 mice in total having five of each sex. Clinical manifestation and signs of mortality of all animals were monitored on day-to-day basis. Body weights and consumption of food and water of all the animals were also noted on 7-day interval. After 28 days of treatment, euthanization was done by decapitation using mild anesthetic ether and were evaluated for organ weight, serum biochemistry, hematology, and histopathological studies. 22
Experiments in vivo in rats
To evaluate the chemotherapeutic activity of eupafolin, 30 male Wistar rats were split into five groups of six animals. The CRC was induced in the animals (except group I) through the administration of DMH of 30 mg/kg in 0.9% saline through a single intraperitoneal (i.p) injection accompanied by 2% (w/v) DSS in drinking water for 7 days beginning 1 week after the injection.23,24 The eupafolin was dissolved in distilled water and administered through oral gavage. The treatment was continued for 18 weeks for chemotherapeutic study, and the amount of water consumption by the animals was recorded throughout the experiment. The groups are followed as:
Group I: The normal control group only received food and water.
Group II: The carcinogen control group received only DMH along with DSS in drinking water.
Group III: Animals were treated with DMH + DSS accompanied by administration of 50 mg/kg eupafolin.
Group IV: Animals were treated with DMH + DSS accompanied by administration of 100 mg/kg eupafolin.
Group V: Animals were treated with DMH + DSS accompanied by administration of 200 mg/kg eupafolin.
The euthanization was done by decapitation using mild anesthetic ether after 18 weeks and checked for loss of breathing for >1 min to confirm euthanasia. For further research, colon tissue samples were removed and washed thoroughly.
Aberrant crypt foci and histopathology of rat colon tissue
The distal part of colon tissues were washed carefully with 0.9% NaCl and divided into two segments. One segment was used for the evaluation of ACF and the other was used for the histopathology and immunohistochemical analysis. The luminal surfaces of the organs were revealed on a filter paper through a longitudinal cut upon the organ. The colonic tissues were then fixed in 10% formalin for 24 h, and 0.2% methylene blue solution in phosphate buffer saline (PBS) was used for the staining of the tissue samples. 25 ACF were counted using a light microscope (Olympus Corp., Tokyo, Japan) according to the process performed by Bird and Good. 26 The findings for each group were recorded as the average of five separate observations. After that, colon specimens were fixed with 10% neutral buffered formalin, then 70, 90, and 100% alcohol was used to dehydrate the tissue and was embedded in paraffin wax of low melting point. Tissue sections were cut at 5 μm thickness and mounted on glass slides, followed by deparaffinization in xylene and rehydration by 100, 90, and 70% alcohol. The staining was done using hematoxylin and eosin (H&E) and observed for histological parameters using light microscopy. 27
Immunohistochemistry
The colon sections were deparaffinized in xylene and then immersed in 3% H2O2 for 3 min to inhibit the activity of endogenous peroxidase. Tissue sections were treated for 1 h with goat serum, accompanied by exposure to 1:200 diluted anti-mouse p53, Bcl2, Bax, or IL-6 antibodies followed by overnight incubation at 4°C. The sections were going through PBS wash and treated with streptavidin-biotin horseradish peroxidase complex biotinylated secondary antibody for 30 min. Then, they were treated with 3,3′-diaminobenzidine as chromogen and counterstained with hematoxylin.
Cell proliferation assay
The samples were supplemented with goat serum for 1 h and then washed with PBS. Tissue sections were supplemented with anti-mouse PCNA (Proliferating cell nuclear antigen) antibodies for overnight at 4°C temperature. Then followed by PBS wash, the slides were incubated with streptavidin-biotin-horseradish peroxidase complex for 30 min at room temperature. Tissues were treated with 3,3′-diaminobenzidine as chromogen and hematoxylin was used for counterstaining.
TUNEL method for apoptosis
For TUNEL method, colon sections were placed on poly-L-lysine slides for 15 min at room temperature. Then, 20 μg/mL proteinase-K in PBS were added to the sections to digest nonspecific proteins, and the sections were washed with double distilled water. In order to block endogenous peroxidase activity, sections were immersed in 3% H2O2 for 3 min, washed with PBS to eliminate excess peroxide, and then treated with terminal deoxynucleotidyl transferase (TdT) buffer (30 mM Trizma base, pH 7.2, 140 mM sodium cacodylate, 1 mM cobalt chloride) at 37°C for 90 min. To stop the reaction, regular saline citrate (Sigma-Aldrich) was added to the tissues for 10 min. The sections were incubated with antidigoxigenin peroxidase for 30 min after washing with PBS. Tissue was treated with3, 3′-diaminobenzidine as chromogen and counterstained with hematoxylin.
The labeling index (LI) was measured as the percentage of cells with PCNA-positive nuclei counted. The apoptotic index (AI) was calculated by evaluating the percentage of TUNEL-positive cells among the total number of cells.
Antioxidant activity
One gram of colon tissue was collected from each animal, washed with 0.9% ice-cold saline, immediately dried on filter paper, and then stored at −80°C. To achieve a concentration of 1g tissue/10 mL lysis buffer, tissue samples were homogenized using an HS-30E homogenizer (WiseStir, Republic of Korea) in a lysis buffer containing 250 mM sucrose, 1 mM EDTA, 1 mM DL-dithiothreitol, and 15 mM Tris-HCl, pH 7.4. Each homogenate was centrifuged at 800 × g for 30 min at 4°C. For the antioxidant assay, the supernatant was used. 28
Using the Kakkar et al. process, superoxide dismutase (SOD) was calculated. 29 The test solution contained 1.2 mL of 0.052 M sodium pyrophosphate buffer, pH 8.3, 0.1 mL of 186 μM phenazinemethosulphate, 0.3 mL of 300 μM of nitroblue tetrazolium, 0.2 mL of NADH (780 μM), and 3 mL of water. The solution was reduced by adding NADH. The reaction was prevented by the addition of 1 mL of glacial acetic acid after incubation at 30°C for 90 s. It was vigorously stirred and then shaken with 4 mL of n-butanol. The mixture was permitted to stand for 10 min, centrifuged for 5 min at 2500 × g at 24 ± 2°C, and removed the butanol layer. Chromogen absorption was detected using a spectrophotometer at 560 nm (UV-1800; Shimadzu, Kyoto, Japan). The basic activity of SOD was expressed as a unit/mg supernatant.
Using the Narendhirakannan et al. process, catalase (CAT) behavior was calculated. 30 The colon homogenate supernatant of 0.2 mL was thoroughly mixed with a 1.2 mL 50 mM phosphate buffer, pH 7.0, and a 1.0 mL 30 mM H2O2 solution was applied to the enzyme reaction. At 240 nm at 30 s intervals for 3 min, the decrease in absorbance was assessed. The enzymatic activity was denoted as decomposed micromoles of H2O2/min/mg protein.
Glutathione S-transferase behavior with reduced glutathione and 1-chloro-2, 4-dinitrobenzene (CDNB) as substrates was assessed spectrophotometrically at 25°C using the Seyyedi et al. process. 31 At room temperature, CDNB, 100 mM, and 100 mM glutathione (GSH) were allowed to thaw, then incubated in a water bath at 30°C. A 1 mL assay cocktail (980 μL PBS, pH 6.5, 10 μL 100 mM CDNB, and 10 μL 100 mM GSH) was prepared for each assay. The 1.5 mL cuvette contained 100 μL of colon tissue homogenate supernatant and 900 μL of cocktail. We used 1 mL of distilled water to set the spectrophotometer to zero. The absorbance was calculated at 340 nm for every 3 min. There was blank cuvette containing 100 μL of PBS in 900 μL cocktail.
Statistical analysis
Data are expressed as means ± SEM. Statistical analysis was conducted using variance analysis (ANOVA), accompanied by Dunnet’s post-hoc test using Graph Pad Prism (Version 5). The differences were considered statistically significant at p ≤ 0.05.
Results
Toxicity study
Acute and sub-acute toxicity study
The LD50 dose of eupafolin was evaluated to be 500 mg/kg body weight. There was no sign of mortality at the dose level of 50, 100, 200, and 400 mg/kg of eupafolin after 28 days sub-acute toxicity study period.
Hematological and serum biochemical analysis
Hematological findings in male rats treated with eupafolin for 28 days.

Standard error mean = standard deviation (SD)/√Total subject. Results were analyzed by one-way ANOVA and confirmed by Dunett’s multiple comparison tests. MCV: mean corpuscle value; MCH: mean corpuscle hemoglobin; MCHC: mean corpuscle hemoglobin concentration; RBC- red blood cell; WBC: white blood cell.
*p < 0.05 significant difference when compared to the control group.
Hematological findings in female rats treated with eupafolin for 28 days.

Standard error mean = standard deviation (SD)/√Total subject. Results were analyzed by one-way ANOVA and confirmed by Dunett’s multiple comparison tests. MCV- mean corpuscle value, MCH- mean corpuscle hemoglobin, MCHC- mean corpuscle hemoglobin concentration, RBC- red blood cell, WBC- white blood cell.
*p < 0.05 significant difference when compared to the control group.
Serum biochemical findings in male rats treated with eupafolin for 28 days.

Standard error of mean (SEM)=standard deviation (SD)/√Total subject. Results are analyzed by one-way ANOVA and confirmed by Dunnett’s multiple comparison tests.
*p < 0.01, significant difference when compared with the control group; #p < 0.05, significant difference when compared with the control group.
Serum biochemical findings in female rats treated with eupafolin for 28 days.

Standard error of mean (SEM) = standard deviation (SD)/√Total subject. Results are analyzed by one-way ANOVA and confirmed by Dunnett’s multiple comparison tests.
*p < 0.01, significant difference when compared with the control group; #p < 0.05, significant difference when compared with the control group.
At the end of sub-acute toxicity study, the serum levels of total bilirubin, ALT, alkaline phosphatase (ALP), Aspartate aminotransferase (AST), and blood urea nitrogen (BUN) were found to be enhanced significantly (p < 0.01) for 400 mg/kg dose of eupafolin as compared to the control group. The serum creatinine level was also upregulated (p < 0.05) in the animals of 400 mg/kg dose group of eupafolin (Tables 4 and 5).
Histopathological analysis
After completion of sub-acute toxicity study, the vital organs of animals such as kidney, liver stomach, and testis were excised and evaluated histopathologically. The architecture of kidney tissue in the animals of control group showed glomerulus, Bowman’s capsule, proximal tubule, and distal tubule (Figure 1(i)(a)). Thickening of the basement membrane, pyknotic nuclei, ruptures in the tissues, cytoplasmic debris, and vacuolizations were detected in the kidney tissue of 400 mg/kg eupafolin-treated animals as compared to other group of animals (Figure 1(i)(e)). The kidney tissues of the animals did not show any significant alterations at the dose level of 50, 100, and 200 mg/kg of eupafolin (Figure 1(i)(b)–(d)). The liver tissue of control animals showed normal histological structures like portal vein, bile duct, hepatic artery, hepatocytes, sinusoids, and the kupffer cells (Figure 1(ii)(a)). The 400 mg/kg eupafolin-treated liver tissues denoted focal inflammation and degeneration of hepatocytes (Figure 1(ii)(e)). No changes were noticed in the histology of liver tissues treated with 50, 100, and 200 mg/kg of eupafolin (Figure 1(ii)(b)–(d)). The histology of the stomach tissues of control group animals and the animals treated with 50, 100, and 200 mg/kg of eupafolin (Figure 1(iii)(a)–(d)) showed the normal architecture of sub-mucosa, muscularis mucosa, and mucosal layers with distinct gastric pits, chief cells, parietal cells, mucosal cells, and surface epithelial cells. The 400 mg/kg of eupafolin-treated stomach tissue indicated profound hemorrhages, hyperplasia, and marked sloughing of epithelial cells in the mucosal layer (Figure 1(iii)(e)). The normal architecture of testis was detected in the normal control animals and in the animals treated with 50, 100, and 200 mg/kg of eupafolin (Figure 1(iv)(a)–(d)). The 400 mg/kg eupafolin-treated animals indicated damaged sertoli cells and spermatozoa with no visible tails and no visible sperm development (Figure 1(iv)(e)). (i) Representative histopathological picture of balb/c mice kidney. (a) Normal histological appearance of kidney tissue of control rats showing bowman’s capsule (bc), glomerulus (g), proximal convoluted tubule (pct) and distal tubule (dct) (H&E) 10X and 40X respectively. (b) Histological appearance of kidney tissue of eupafolin (50 mg/kg) treated mice, (c) (100 mg/kg) treated mice, (d) (200 mg/kg) treated mice. (e) eupafolin (400 mg/kg) treated mice showing thickening of glomerular basement membrane (tbm), pyknotic nuclei (pn), ruptures (r), vacuolization (v) and cytoplasmic debris (cd). (ii) Representative histopathological picture of balb/c mice liver. (a) Normal histological appearance of livertissue of control mice showing portal vein (pv), bile duct (bd), hepatic artery (ha), hepatocytes (h), sinusoids (s) and kuffer cells (kc), (H&E) 10X and 40X. (b) Eupafolin (50 mg/kg) treated mice hepatocytes (hep). (c) Eupafolin (100 mg/kg) treated mice. (d) Eupafolin (200 mg/kg) treated mice. (e) Eupafolin (400 mg/kg) treated mice showing periportal infiltrates (pmi), degeneration of hepatocytes (hd). (iii) Representative histopathological picture of balb/c mice stomach. (a) Normal histological appearance of stomach tissue of control mice muscularis externa (me), muscularis mucosa (mm), gastric pits (gp), chief cells (cc), parietal cells (pc), (H&E) 10X and 40X. (b) Eupafolin (50 mg/kg) treated mice showing submucosa (sm). (c) Eupafolin (100 mg/kg) treated mice stomach tissue denoting the gastric pits (gp). (d) Stomach tissue of eupafolin (200 mg/kg) treated mice showing hyperplasia (hyp). (e) Eupafolin (400 mg/kg) treated mice showing hyperplasia (hyp), sloughing of epithelial layers (s) in the mucosal membrane and haemorrhages (h). (iv) Representative histopathological picture of balb/c micetestis. (a) Normal histological appearance of testis tissue of control rats showing spermatogonia (Sg), sertoli cells (sc), seminiferous tubule (s), interstitial cells (i) (H&E) 10X and 40X respectively. (b) Histological appearance of testis tissue of eupafolin (50 mg/kg) treated mice. (c) Eupafolin (100 mg/kg) treated mice showing cells of leydig (ld). (d) Eupafolin (200 mg/kg) treated mice. (e) Histological appearance of testis tissue of eupafolin (400 mg/kg) treated mice showing no hyperplasia (hyp), spermatozoa with no visible tails (sz) and degeneration of sertoli cells (dsc).
In vivo carcinogenesis study
Study of water consumption
Significant alterations in the water consumption by the animals were noted during the experimental study (Figure 2). For the carcinogen control group, the water consumption was drastically lower as compared to the normal control group. However, the water consumption was significantly increased for eupafolin-treated group (50, 100, and 200 mg/kg) as compared to the carcinogen control group. Furthermore, during the DSS treatment in the first week, no such changes in the water consumption have been observed. Mean water consumption (ml/animal/day) of male Wistar rat for carcinogenic study.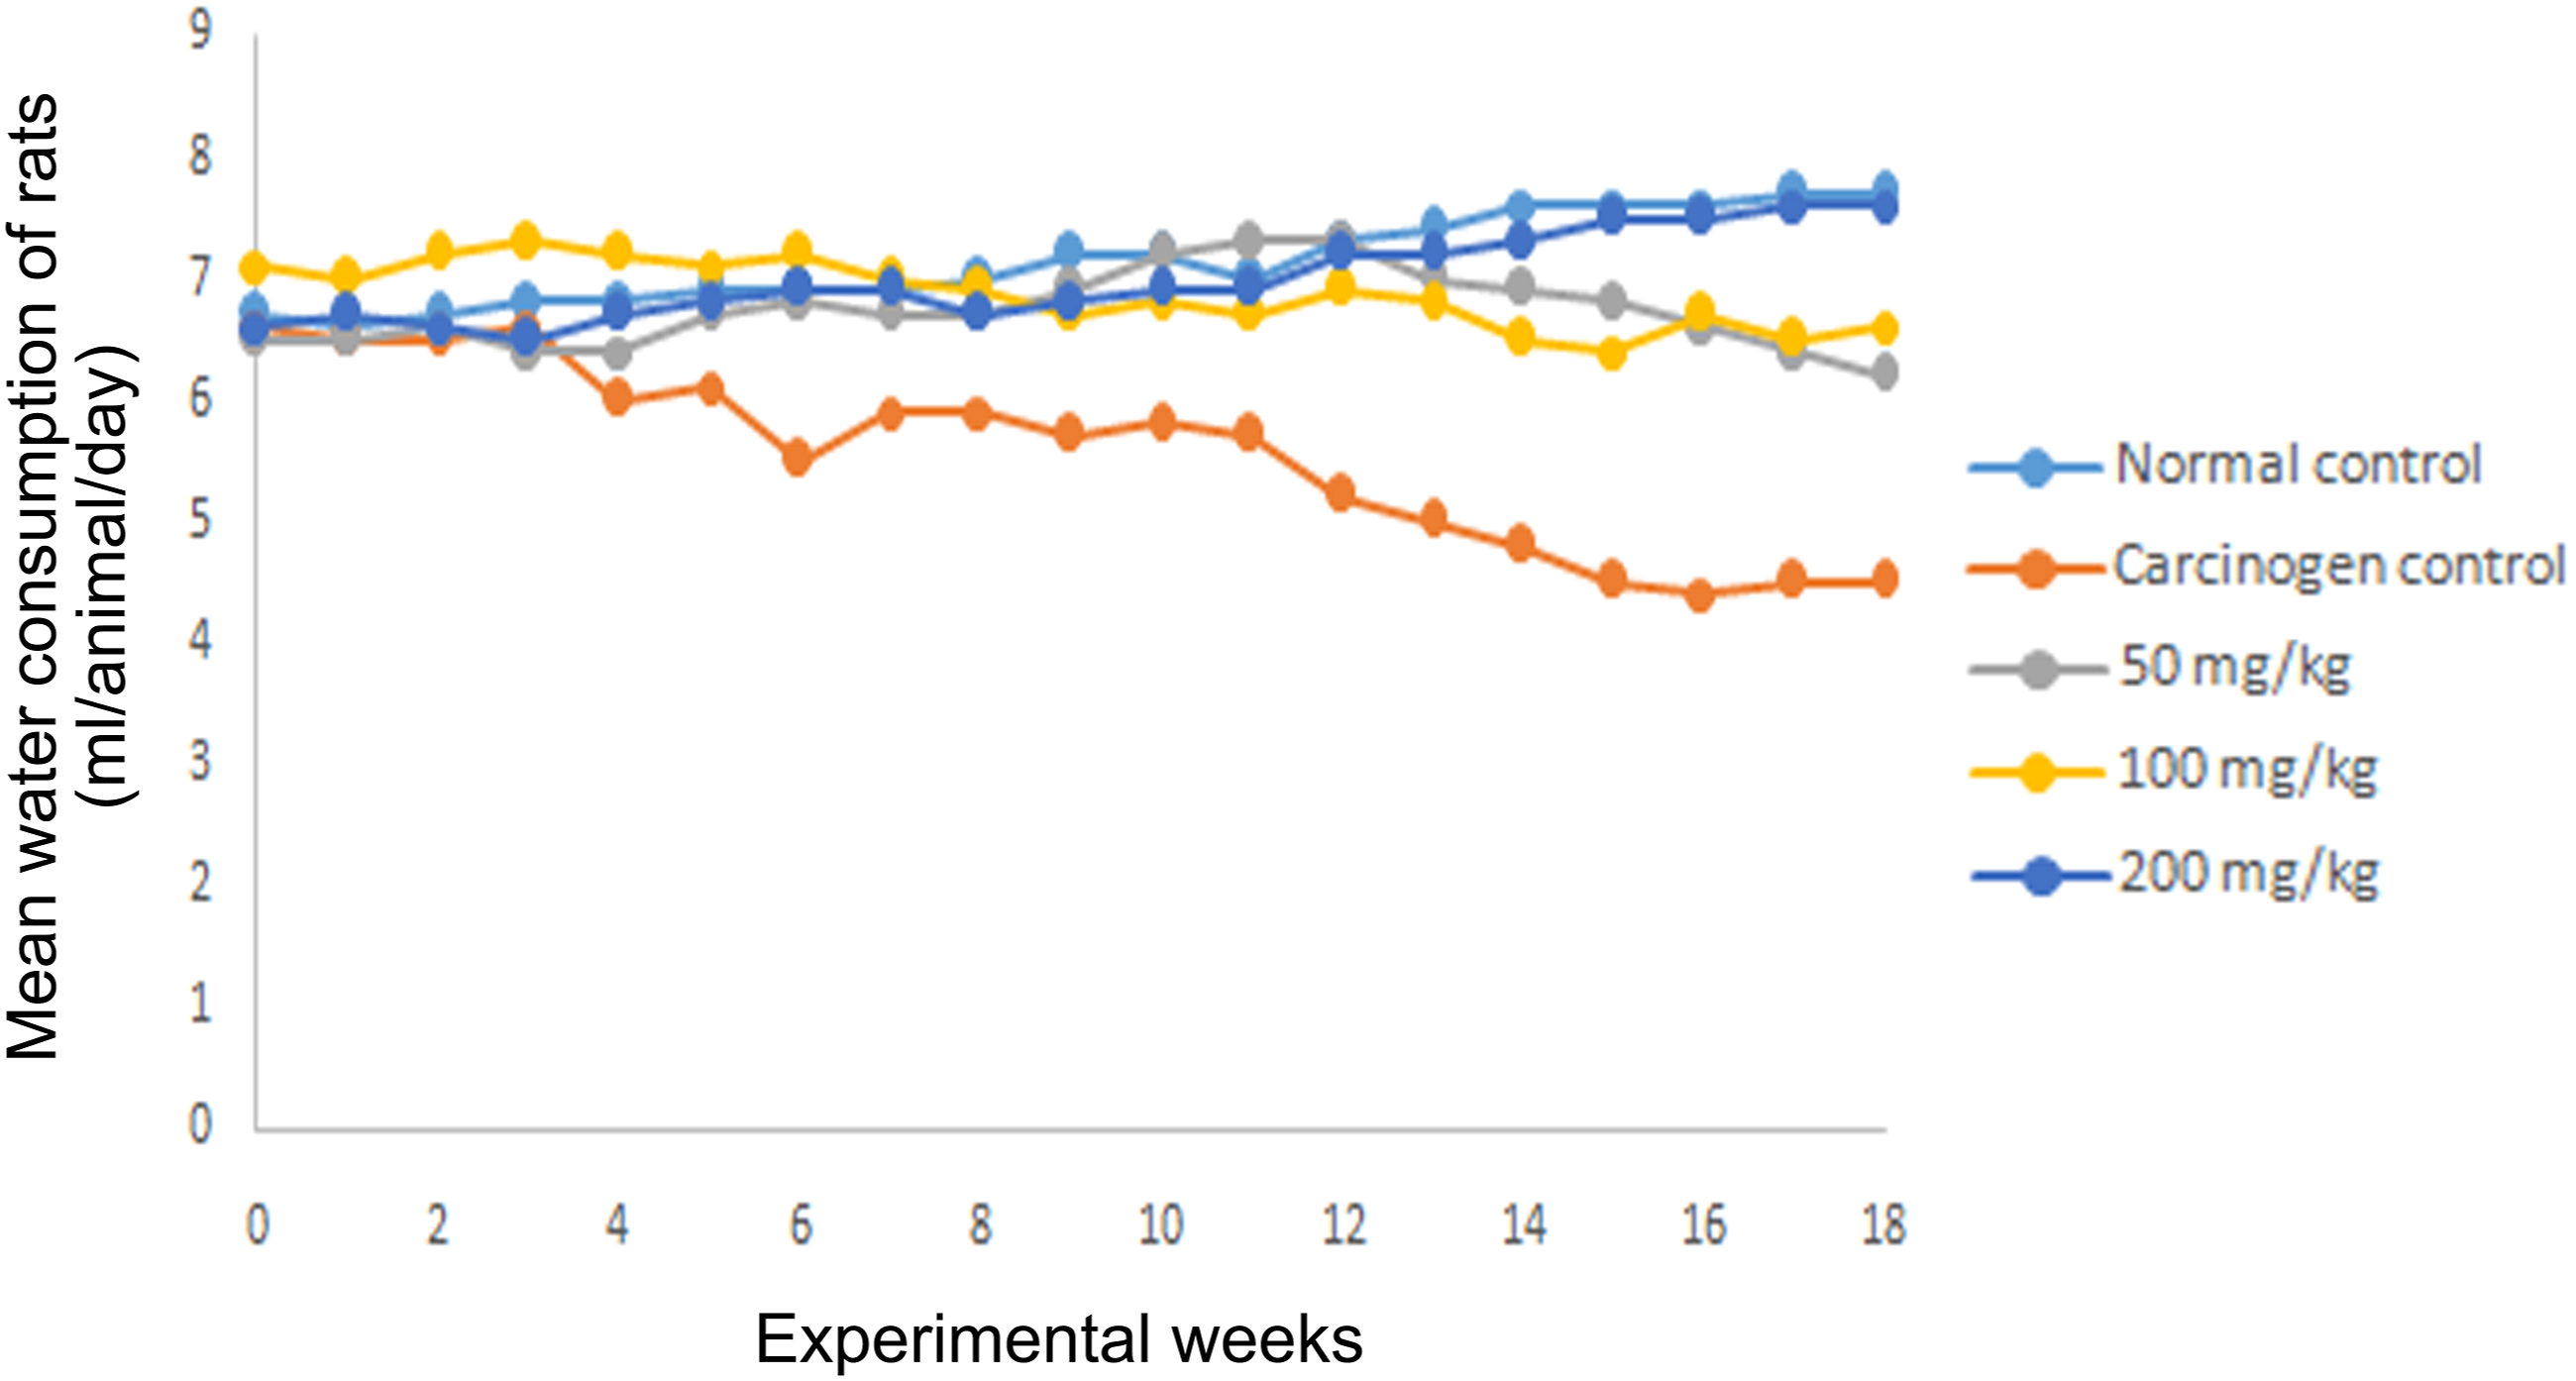
Counting of aberrant crypt foci
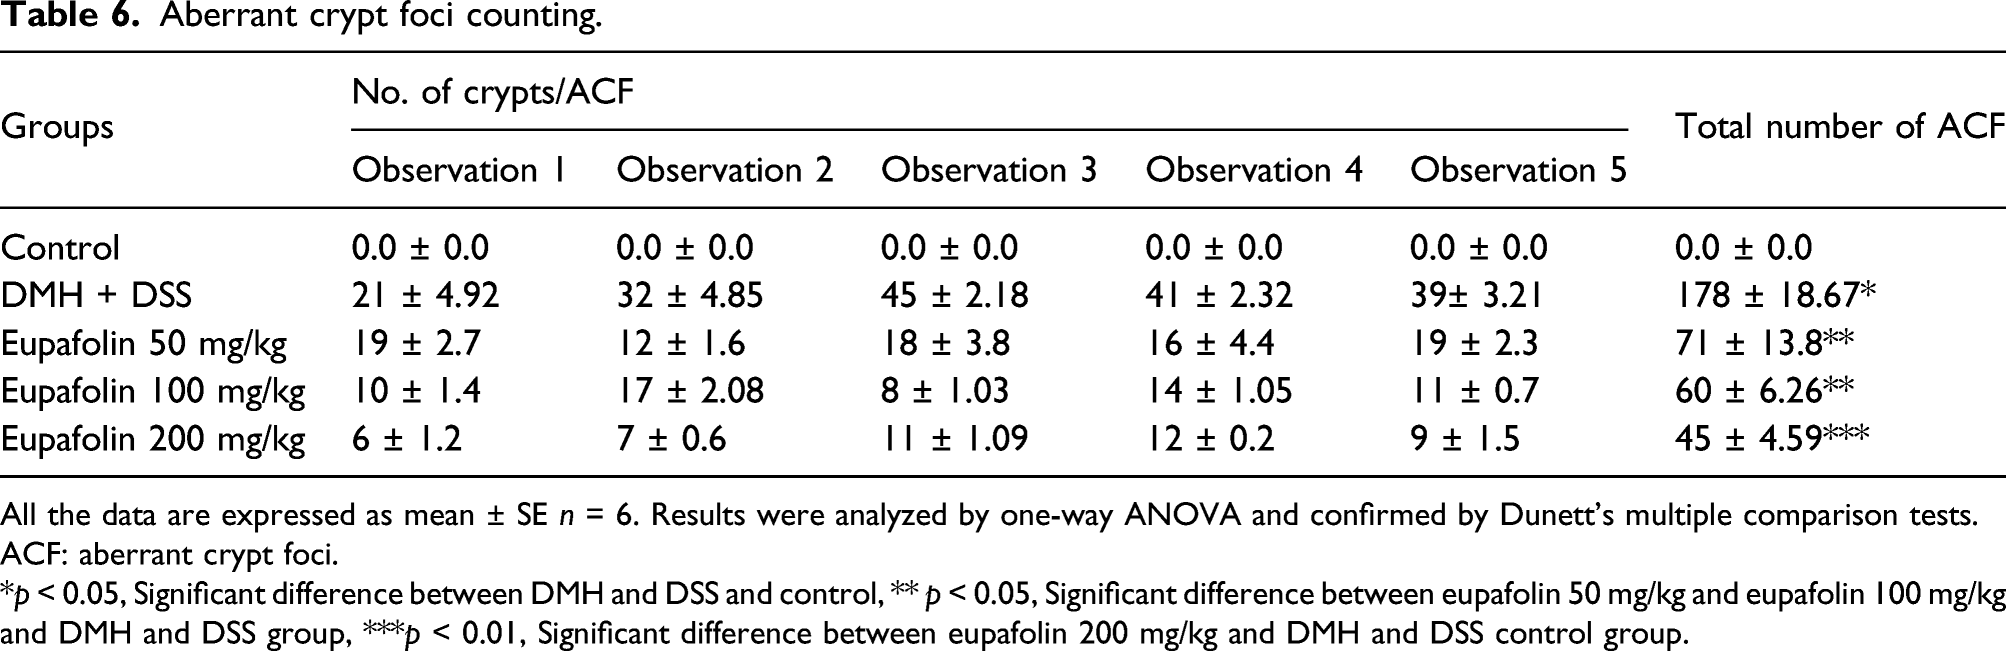
The colon tissue samples of the animals of normal control group did not shows any visible ACF, whereas animals treated with DMH and DSS revealed the appearance of ACF which were distinguished as colonic mucosal lesions. These crypts were differentiated from the normal crypts through their dark stain, distinguished elliptical shape, thick epithelial lining, and perycriptal zone. In the animals treated with DMH and DSS followed by eupafolin treatment, the ACF multiplicity was significantly less (p < 0.05). The 200 mg/kg of eupafolin-treated group denoted the severe suppression of the ACF in comparison to the other treated animals of different doses (p < 0.01) (Figure 3 Table 6). Effect of eupafolin on ACF. Topographical view of colon mucosa after staining the tissue with methylene blue. ACF were observed and distinguished from the surrounding normal crypts by their increased size, distance from the lamina to basal cell surfaces and pericryptal zone at 10X magnification. (a) colon mucosa of normal control group, (b) the DMH and DSS control group, (c) 50 mg/kg of eupafolin treated group, (d) and (e) are the colon mucosa of animals treated with 100 mg/kg and 200 mg/kg of eupafolin respectively. The arrows show the crypts. ACF: aberrant crypt foci. Aberrant crypt foci counting. All the data are expressed as mean ± SE n = 6. Results were analyzed by one-way ANOVA and confirmed by Dunett’s multiple comparison tests. ACF: aberrant crypt foci. *p < 0.05, Significant difference between DMH and DSS and control, ** p < 0.05, Significant difference between eupafolin 50 mg/kg and eupafolin 100 mg/kg and DMH and DSS group, ***p < 0.01, Significant difference between eupafolin 200 mg/kg and DMH and DSS control group.
Histological analysis
The histopathological findings of the colon tissues of the animals from carcinogen control group showed the non-invasive carcinoma development with lesions on the mucosal layers (Figure 4). The increment in the ACF multiplicity presented hyperplasia along with severe mucosal dysplasia. The hyperplastic colon mucosa showed was a mixture of goblet and absorptive cells with partial mucin depletion. The lumen of the colon tissue bearing ACF is more prominent and elongated as compared to the normal colonic mucosa (Figure 4(a)). In (Figure 4(b)), the dysplastic ACF shows proliferation of mucosal layer going through mitosis with complete mucin depletion and loss of goblet cells. Treatment with eupafolin to DMH and DSS-exposed animals resulted in reduced incidences of adenoma formation (Figure 4(c)–(e)). Animals treated with 50 and 100 mg/kg of eupafolin did not develop epithelial sloughing in the colonic tissue; however, minor hyperplasia in the epithelial layer was noted. Also, ACF in the lumen were less elevated with no incidence of mucin depletion (Figure 4(c) and (d)). The group of animals that were administered 200 mg/kg of eupafolin showed the presence of goblet cells in the colon tissue accompanied by a substantial decline in the formation of ACF. Furthermore, no mucin depletion was observed in the colonic mucosa of the 200 mg/kg of eupafolin-treated groups (Figure 4(e)). Histological study of colon mucosa of rats at 10X and 40X magnification. (a) the mucosa of normal control group denoting mucosa (M), submucosa (Sm), muscularis mucosa (Mm), Columnar absorptive cells (CAC), Lamina propia, crypts (C), Absorption cells (Ac) and distinct goblet cells (Gc), (b) the colon tissue of DMH and DSS control groups showing depletion of mucin (DM), hyperplasia (Hyp), dysplasia (Dys) arrow head showing lack of goblet cells. (c) the colon mucosa of animals treated with 50 mg/kg of eupafolin depicting dilation of Column (Dc), discontinuation of absorption cells denoted by arrowhead and loss of goblet cells (c), depletion of mucin (DM) (d) the colon mucosa of animals treated with 100 mg/kg of eupafolin depicting hyperplasia (Hyp) and neutrophil infiltration (Nu inf) (e) the colon mucosa of animals treated with 200 mg/kg of eupafolin depicting goblet cells (Gc), newly formed crypts (C) and no depletion of mucin.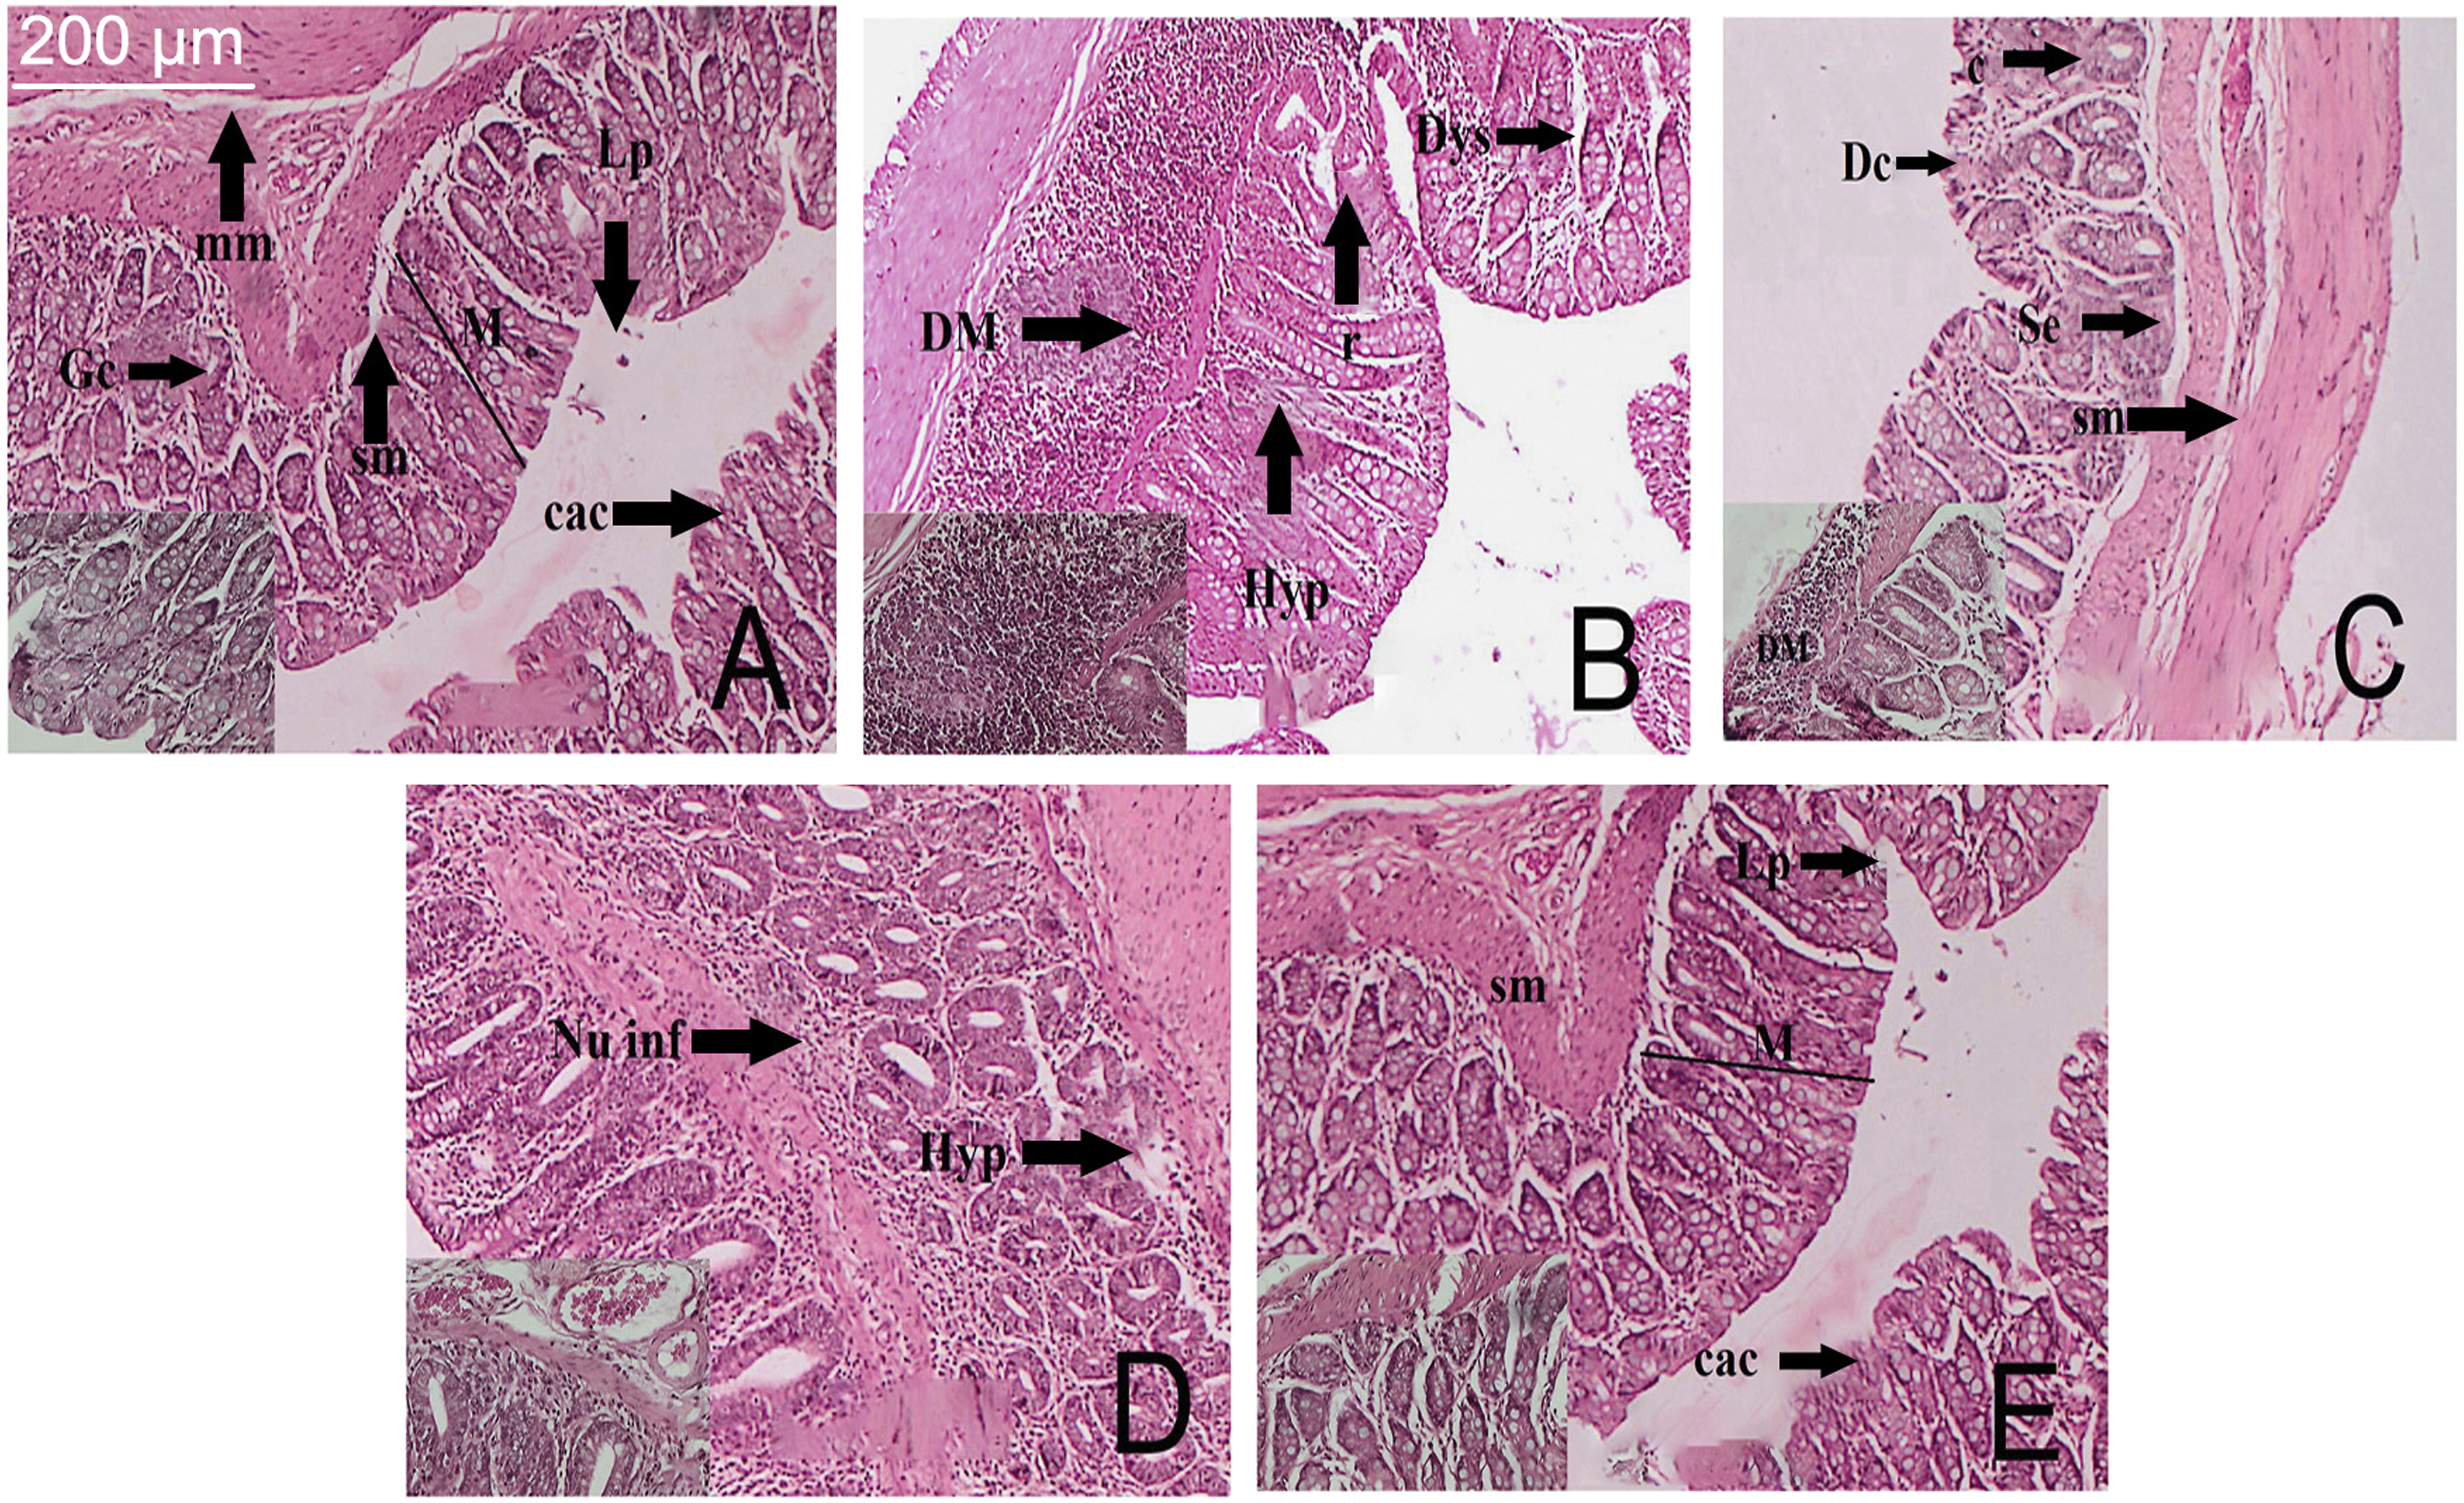
Antioxidant activity
The levels of SOD, CAT, and reduced glutathione were found to be reduced in the DMH and DSS-treated colon tissue. However, the 200 mg/kg treated groups of animals denoted marked elevation in the SOD, CAT, and glutathione levels in comparison to the carcinogen control animals (p < 0.01) (Figure 5). Effect of eupafolin on in vivo antioxidant enzymes SOD (superoxide dismutase) and CAT (catalase), (glutathione) GST. * p< 0.05 as compared to the carcinogen control, # p<0.01 as compared to the carcinogen control.
Immunohistochemical analysis
The immunohistochemical evaluation of the colon tissues was conducted and the effect of eupafolin was studied on the expressions of tumor suppression protein p53, pro-apoptotic protein Bax, anti-apoptotic protein Bcl2, and on the pro-inflammatory cytokine IL-6 (Figure 6(i)–(iv)), respectively. The expression of the all associated proteins in the normal control group has been depicted in (Figure 6(i)(a)–(iv)(a)). The introduction of DMH and DSS effectively minimized the expression of the p53 and Bax (Figure 6(i)(b) and (iii)(b)), but an elevation in the expressions of Bcl2 and IL-6 was observed in the mucosal region and in goblet cells as represented by white arrows in (Figure 6(ii)(b) and (iv)(b)), in comparison to the normal control rats (p < 0.05). Following treatment with eupafolin, a significant increment was noted in the expression of the p53 and Bax proteins in the goblet cells and mucosal region of colon as represented by white arrows in (Figure 6(i)(c)–(e) and (iii)(c)–(e)), whereas the expressions of Bcl2 and IL-6 were notably decreased (Figure 6(ii)(c)–(e) and (iv)(c)–(e)) compared to the carcinogen control groups (p < 0.05). Eupafolin at a dose of 200 mg/kg was found to be significantly more successful in increasing p53 and Bax expressions, (Figure 5(i)(e) and (iii)(e)) while effectively suppressing Bcl2 and IL-6 expressions (Figure 6(ii)(e) and (iv)(e)), in comparison to the carcinogen and control groups (p < 0.01) (Table 7). (i) the immunohistochemical analysis of the p53 expression in the colon tissues of different groups of rats at 40X magnification. (a) The normal control group showing standard expression of p53, (b) the DMH and DSS-treated group showing fewer expression of p53 as compared to the normal control, (c) and (d) the 50 mg/kg and 100 mg/kg eupafolin treated animals showing mild to moderate expression of p53, represented by white arrows. (e) The 200 mg/kg eupafolin treated animals showing significant expressions of p53. (ii) The immunohistochemical analysis of the BCL2 expression in the colon tissues of different groups of rats at 40X magnification. (a) The normal control group showing standard expression of BCL2, (b) the DMH and DSS treated group showing significant expression of BCL2 protein, represented by white arrows.(c) the 50 mg/kg treated animals depicting less expression of BCL2 as compared to the carcinogen control group, (d) and (e) the 100 and 200 mg/kg eupafolin treated animals showing mild to moderate expression of BCL2. (iii) The immunohistochemical analysis of the BAX expression in the colon tissues of different groups of rats at 40X magnification. (a) the normal control group showing standard expression of BAX, (b) the DMH and DSS treated group showing fewer expression of BAX as compared to the normal control, (c) and (d) the 50 mg/kg and 100 mg/kg eupafolin treated animals showing mild to moderate expression of BAX, (e) the 200 mg/kg eupafolin treated animals showing significant expressions of BAX as compared to the carcinogen control, represented by white arrows. (iv) The immunohistochemical analysis of the IL-6 expression in the colon tissues of different groups of rats at 40X magnification. (a) The normal control group showing standard expression of IL-6, (b) the DMH and DSS treated group showing significant expression of IL-6 as compared to the normal control, represented by white arrows. (c) the 50 mg/kg treated animals depicting fewer expression of IL-6 as compared to the carcinogen control group, (d) and (e) the 100 and 200 mg/kg eupafolin treated animals showing mild to moderate expression of IL-6. Effect of Eupafolin on the expression of p53, Bax, Bcl2 andIL-6 in colon tissues. aEach score represents the results of 6 slides per rat and 6 rats per group, mean ± SE (n = 6). Each field was selected randomly for evaluation of percentage of immune-positive cells. bSignificant difference between eupafolin 200 mg/kg and carcinogen control (p < 0.01). cSignificance difference between eupafolin 50 mg/kg, eupafolin 100 mg/kg and carcinogen control (p < 0.05).

Eupafolin causes suppression of PCNA
Cell proliferation and apoptosis in colon.
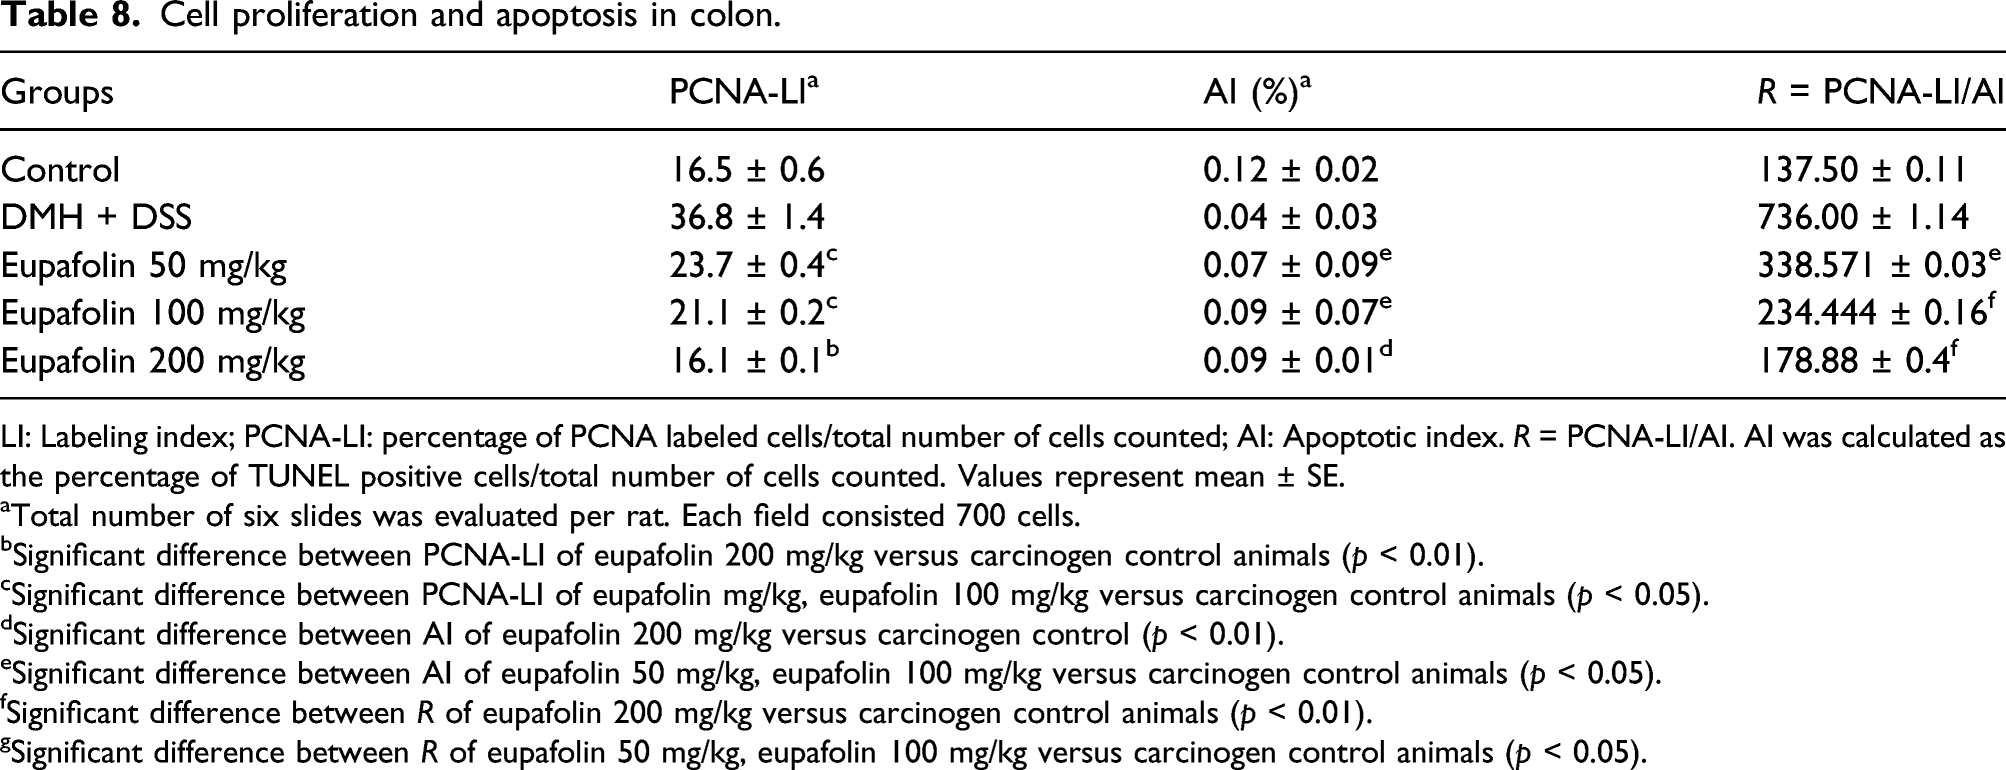
LI: Labeling index; PCNA-LI: percentage of PCNA labeled cells/total number of cells counted; AI: Apoptotic index. R = PCNA-LI/AI. AI was calculated as the percentage of TUNEL positive cells/total number of cells counted. Values represent mean ± SE.
aTotal number of six slides was evaluated per rat. Each field consisted 700 cells.
bSignificant difference between PCNA-LI of eupafolin 200 mg/kg versus carcinogen control animals (p < 0.01).
cSignificant difference between PCNA-LI of eupafolin mg/kg, eupafolin 100 mg/kg versus carcinogen control animals (p < 0.05).
dSignificant difference between AI of eupafolin 200 mg/kg versus carcinogen control (p < 0.01).
eSignificant difference between AI of eupafolin 50 mg/kg, eupafolin 100 mg/kg versus carcinogen control animals (p < 0.05).
fSignificant difference between R of eupafolin 200 mg/kg versus carcinogen control animals (p < 0.01).
gSignificant difference between R of eupafolin 50 mg/kg, eupafolin 100 mg/kg versus carcinogen control animals (p < 0.05).

(i) the immunohistochemical analysis of expression of PCNA of different group of rats at 40X magnification. (a) The normal control group showing regular expressions of PCNA, (b) the DMH and DSS treated group showing strong expression of PCNA, represented by white arrowheads. (c) and (d) the 50 and 100 mg/kg eupafolin treated groups showing mild PCNA expression respectively (e) the 200 mg/kg eupafolin treated groups showing significant reduction in PCNA expression. (ii) The immunohistochemistry of TUNEL apoptotic cells at 40X magnification. (a) the normal control group showing normal apoptosis, (b) the DMH and DSS treated group showing weak apoptosis, (c) and (d) the 50 and 100 mg/kg eupafolin treated groups showing moderate apoptosis respectively, (e) the 200 mg/kg eupafolin treated group showing significant increase in apoptosis, represented by white arrowheads. Approximately 700 cells were counted per field, 10 fields were examined per slide and 10 slides were examined per group.
Eupafolin induces apoptosis
The presence of a brown stain overlying the condensed chromatin of apoptotic bodies generated by DAB chromogen indicated the presence of TUNEL positive apoptotic cells. The control group animals indicated normal apoptotic levels (Figure 7(ii)(a)), whereas the rate of apoptosis was significantly diminished in the carcinogen control colon tissues (Figure 7(ii)(b)). In the DMH and DSS control group, a minimum of 3–five apoptotic cells were identified in a field of 700 cells. In the animals treated with eupafolin, the rate of apoptosis was markedly increased in the goblet cells and mucosal region, as represented by white arrowheads in (Figure 7(ii)(c)–(e)), and an average of 10–15 cells could be located in the colon tissues of 200 mg/kg of eupafolin-treated rats (Figure 7(ii)(e)). The apoptotic index represented by AI was calculated in the Table 8. The 200 mg/kg group of animals had a significantly enhanced (p < 0.01) rate of apoptosis in comparison to the carcinogen control group.
The R value denotes the cell proliferation ratio to apoptosis. The data collected from cell proliferation and TUNEL assay signified that the tumorigenic alterations at the initial stage was related to enhanced cell proliferation and decreased rate of apoptosis. The higher R value of the carcinogen control group denotes improvement of proliferative activity and the less R value in the treatment groups designated enhanced apoptotic events.
Discussion
Colon cancer is the second most prevalent type of malignancy in the world. 32 The colon cancer incidences are rapidly growing due to the inefficient treatment options and diagnosis at advanced stages. 33 In addition, the anticancer drugs that are being used for treating colon cancer have severe side effects which negatively impact the patient quality of life. Thus, the reduction of the sensitivity to chemotherapy with increased side effects continue to be the primary inconvenience for effective CRC treatment. 34 This research study is associated with the potential chemotherapeutic effect of eupafolin as a novel anticancer agent with minimum side effects.
Since natural compounds have advantages of increased efficacy with lesser toxic effects, many natural compounds have been used clinically. 35 Eupafolin is a natural compound, and previous studies have reported the anti-inflammatory and anti-tumor effects of eupafolin. 36 For example, eupafolin can reduce the viability of esophageal cancer cells in vivo and in vitro by targeting T-LAK mediated regulation of Mcl-1. 37 Bim enhances TRAIL-mediated apoptosis of renal cancer cells. 38 In addition, eupafolin can induce apoptosis in HeLa human cervical cancer cells by inhibiting the expression of associated apoptotic proteins. 36 However, the role of eupafolin in colon cancer and its possible underlying mechanism of action have not yet been elucidated. Therefore, the present study aimed to determine the chemotherapeutic effect of eupafolin in a DMH + DSS induced colon cancer model in rats. Still, there are some limitations in the study that need to be further emphasized. The evaluation of power analysis, the chemotherapeutic study on colon cancer cell lines, and analysis of several inflammatory markers need to be studied for further consideration of this molecule in clinical settings.
According to the global harmonized system of classification and labeling of chemicals, it is critical to evaluate the safe dose with effective administration route of a novel cancer chemotherapeutic agent.39,40 Accordingly, we determined the LD50 values of eupafolin in balb/c mice which was found to be 500 mg/kg body weight. The 28 days repeated oral toxicity assay was further required to identify subsequent doses for carcinogenic study. The sub-acute toxicity study of eupafolin showed the occurrence of mortality at a dose level of 400 mg/kg body weight in balb/c mice.
Hematological parameters were evaluated to determine the deleterious effects of high doses of eupafolin in animals. The increase levels of WBC (in both sexes) obtained from hematological data indicated the signs of organ toxicity. The various biochemical parameters were also investigated, and a rise in several parameters like AST, ALP, TP, BUN, and creatinine clearly indicates that high doses of eupafolin can induce physiological changes in the experimental animals. Histopathology of essential organs such as kidney, liver, stomach, and testis further confirmed the cellular injury to animals exposed at high doses of eupafolin. Hence, for the carcinogenic study, 50, 100, and 200 mg/kg doses of eupafolin were selected and assessed further.
During the entire carcinogenic study, the water consumption by the animals were noted and evaluated. The water consumption rate in the animals of carcinogen control group was decreased day by day in comparison to the normal control group. Whereas, the 200 mg/kg eupafolin-treated group showed a constant water consumption rate throughout the study and the other eupafolin-treated group (50 and 100 mg/kg) showed a slight decrease in their rate of water consumption.
The histopathological evaluation of the colon tissue for all the experimental animals were performed in order to assess the development of colon carcinoma in the carcinogen control group and to evaluate the chemotherapeutic activity of eupafolin against DMH-induced colon cancer in the eupafolin-treated group. The development of hyperplastic lesion on the mucosal layer of colon tissue was observed in the carcinogen control group. Furthermore, increased ACF multiplicity in the hyperplastic lesion with complete mucosal dysplasia was also noted in the carcinogen control group. The treatment with eupafolin causes significant decrease in the ACF multiplicity and restoration of normal cellular architecture of the colon tissue. The substantial decrease in the hyperplastic lesion and normal morphological characteristics of the goblet cells was also restored followed by eupafolin treatment. These incidences clearly depict the anticancer activity of eupafolin against DMH-induced colon cancer in rats.
An immunohistochemical analysis of the colon tissues revealed the activities of p53, TNF-α, NF-κβ, and IL-6 signaling pathways to obtain an extensive insight into the mechanism of action of eupafolin in DMH-induced colon cancer. Some of the important sensors of cellular stress are p53 and NF-κB. Apoptosis is inhibited through the activation of NF-κB due to the induction of antiapoptotic genes and/or suppression of proapoptotic genes. 41 In association with the antiapoptotic activity, NF-κB has been found to be constitutively active in a variety of malignancies, lowering their sensitivity to proapoptotic stressors such as those associated with cancer chemotherapy. 42 In stress situations, p53 and NF-ĸB are antagonistic, and the balance of their activity determines the cellular fate, whether proliferation or apoptosis. 43 Our results depicted that the expression of p53 was significantly decreased with the upregulation of NF-κB proteins in the carcinogen control group as compared to the normal control group. Meanwhile, eupafolin works through a fundamentally novel mechanism, by the upregulation of p53 and downregulation of NF-κB proteins. We can thus conclude that eupafolin has an influential effect on apoptotic pathway leading to the cessation of cellular multiplication.
In carcinogenic progression, the tumor microenvironment plays a crucial role. TNF-α (tumor necrosis factor) is an inflammatory cytokine that is commonly found in the tumor microenvironment. 44 As a pleiotropic cytokine, TNF-α shows a dual role in cancer progression.45,46 TNF-α is involved in inflammation-associated carcinogenesis by means of supporting tumor cells growth, survival differentiation, invasion, metastasis, and subverting the immune responses.45–48 A number of reports have indicated that the serum levels of TNF-α are elevated in various malignancies, with higher levels in preneoplastic and neoplastic tissues. 46 Although showing some anti-inflammatory properties, IL-6 is well known as a pro-inflammatory cytokine exhibiting a similar function to TNF-α-induced inflammation. 49 In the majority of clinical studies on patients with different types of cancer, the IL-6 serum levels increase, possibly reflecting a tumor-type-independent systemic phenomenon. Moreover, it has been suggested that the elevated serum levels of IL-6 are correlated with disease severity and a worse clinical outcome in cancer patients. 50 The in vivo study revealed that there was an increased expression of TNF-α and IL-6 in the carcinogen control group as compared to the normal control group, but eupafolin treatment significantly decreased the expressions of TNF-α and IL-6 allowing us to conclude that eupafolin therapy has a beneficial effect in colon cancer.
The abnormal epithelial cell proliferation may occur because of the increased expression of PCNA and serves as an indicator of pre-neoplasia. 39 Studies reveal the p53-mediated regulation of DNA replication through the modification of PCNA levels.51,52 Thus, DMH and DSS-treated animals showed a remarkable number of PCNA labeled cells and lesser AI value which suggest the uncontrolled cell proliferation and is associated with ACF multiplicity in the colon mucosa. Eupafolin treatment significantly decreased the number of PCNA labeled cells consequently increasing AI value. Thus, the results indicate that eupafolin treatment improved p53 expressions which inhibited cell proliferation by increasing apoptotic process in the cancer cells resulting in reduced ACF multiplicity and hyperplastic lesions.
Conclusion
In conclusion, our approach for the chemotherapeutic treatment demonstrated greater efficacy of eupafolin in different doses with diminished toxicity and less adverse effects. Moreover the in vivo studies present indisputable evidence that the eupafolin therapy can inhibit, reverse, or delay the progression of colon cancer and hence in the future may serve as a prospective contender for colorectal cancer chemotherapy in clinical settings.
Footnotes
Author contributions
Wang C and Qiao X designed, planned and equally contributed to the manuscript. Wang J, Yang J, Yang C executed the experiments, analyzed the data and wrote the manuscript. Qiao Y, Guan Y, Wen A, Jiang L executed the experiments.
Declaration of conflicting interests
The author(s) declared no potential conflicts of interest with respect to the research, authorship, and/or publication of this article.
Funding
The author(s) received no financial support for the research, authorship, and/or publication of this article.
Animal welfare
The recommendations by Ethics Committee of Animal Sciences of Xijing Hospital, Fourth Military Medical University with Approval Number: 2021086567 were strictly adhered to while performing animal experiments and for their care.