
Abstract
In the conveying process of a solid–liquid two-phase medium, the wear of the flow passage components is unavoidable. In this study, the solid–liquid two-phase flow in a centrifugal pump was numerically simulated by computational fluid dynamics–discrete element method coupling. For particle diameters up to 3 mm, the particle–particle and particle–wall interactions were considered in the simulation. Two-phase performance and wear experiments for different flow rates and particle concentrations were conducted. The wear experiment was carried out for 48 h at each mass concentration. In these experiments, a paint film method was used to display the wear position, and the wall thickness of the flow passage was measured using an ultrasonic thickness gauge. The results show that the instantaneous wear rate of the impeller, volute, and wear plate in the pump changed periodically with the impeller rotation. The volute wall wear was related to the particle movement. With the increase in the particle mass concentration, the wear rate increased. However, the rate of increase of the wear rate decreased because the particles moved to the wall in the volute to form a particle layer. Increasing the concentration did not linearly increase the effect of the particles on the wall.
Keywords
Introduction
With the development of industry, the need of mineral resources has become increasingly pronounced. The general deep-sea mining system in current use conveys the nodule and seawater mixture onto ships via centrifugal pump systems in solid–liquid two-phase form. In deep-sea mining systems, due to the compact size and high energy efficiency of centrifugal pumps, they are typically used as power devices to provide lift for mineral transportation. In this process, the stability of the centrifugal pump must be guaranteed when conveying a solid–liquid two-phase flow medium. However, due to the presence of coarse particles in the minerals, wear occurs in the components of the centrifugal pump, which reduces the life of the centrifugal pump. Frequent maintenance is not conducive to the stable operation of the whole system.
Research on flow characteristics in solid–liquid two-phase centrifugal pump
Many scholars have analyzed the solid–liquid two-phase flow in centrifugal pumps from different perspectives. Particles affect the internal flow fields of centrifugal pumps, which lead to performance changes. Chandel et al. 1 carried out experimental research on centrifugal and screw pumps. It was found that the head and efficiency of the centrifugal pump decreased with the increase in the particle concentration at the rated flow, whereas the screw pump exhibited the opposite behavior. Zhao and Zhao 2 used the shear stress transport (SST) k-ω turbulence method to simulate the three-dimensional transient flow process in a centrifugal pump. The simulation results showed that the solid particle concentration had a strong influence on the external performance and the turbulent energy, which exhibited an increasing trend with the rise in concentration. Meanwhile, the particle size can also evidently influence the internal flow, but the effect is not simply proportional to the diameter size. Based on the renormalization group (RNG) k-ε turbulence model and sliding mesh technique, Wu et al. 3 simulated solid–liquid two-phase three-dimensional unsteady turbulent flow in a slurry pump with FLUENT software. The effects of the unsteady flow characteristics on solid–liquid two-phase flow and pump performance were studied under designed conditions. The results showed that the clocking effect had a significant effect on the flow rate of the pump, and the variations of the flow rate and pressure were significant, especially in the vicinity of the tongue, the small section of the volute, and the diffusion section. Using three-dimensional numerical simulations of a molten salt pump, Cheng et al. 4 obtained the relationship between the blade number, particle diameter, and volume fraction on the performance of the centrifugal pump and found that in the two-phase flow with particle diameters of 0.1 mm, the performance of the centrifugal pump increased compared with that of water. Shi et al. 5 studied the performances of four deep-well centrifugal pumps with different impeller outlet widths using computational fluid dynamics (CFD) software. The flow field distribution of the static pressure, turbulent flow energy, and velocity under designed conditions was calculated and compared. The results showed that excessively wide impeller outlet widths led to poor pump performances and increased the shaft power.
Research on wear of solid–liquid two-phase centrifugal pump
The wear of a solid–liquid two-phase centrifugal pump is mainly concentrated in the flow passage. The causes of wear can be summarized by three categories: design, operation, and process. As shown in Figure 1, research on the wear of centrifugal pumps was also carried out from these three aspects. Khalid and Sapuan 6 rotated the centrifugal pump impeller into a cylinder containing a mixture of sand and water. By measuring the thickness and weighing the impeller, the relationship between the wear of the impeller and time was studied. He found that the mass loss of the impeller and the wear time were linearly related. Qian et al. 7 have simulated the solid–liquid two-phase flow in a centrifugal pump and the wear rate of the impeller using a discrete phase model and reduced the wear of the two-phase flow on the impeller by optimizing the shapes of the inlet and outlet of the blade. Zhang et al. 8 analyzed the failure causes of mining centrifugal pumps and found three main reasons for pump failure: flow wear and cavitation, material defects, and water-like weak alkali damage. Xing et al. 9 applied the theory of solid–liquid two-phase flow to analyze the wear positions and processes of centrifugal pumps. The results showed that under the impact of particles of certain diameters, shapes, impact velocities, and impact angles, pits appeared on the walls, and the largest von Mises stresses appeared in the pits. Walker and Bodkin 10 determined the effects of the solid particle size, slurry concentration, and speed on the wear through experimental studies and found that the wear rate remained unchanged when the pump speed changed.

Factors affecting centrifugal pump wear.
Many engineering applications involve large particle conditions in solid–liquid two-phase flows, but the relationship between the large particle motion and overflow wall is different than that of small particles, which makes these flows more difficult to study. Zouaoui et al. 11 experimentally studied the flow of large particles in horizontal pipes. By changing the particle material, particle size, and concentration, the researchers tested the important parameters (e.g. pressure and velocity) in the solid transport process. They found that the relationship between the pressure gradient force and mixing velocity was significantly different from that of pure liquid flow. Ravelet 12 conducted experimental research on the hydraulic transport of large particles with sizes of 5 mm in horizontal pipes. The experimental results were compared with a one-dimensional model based on a mass and momentum balance. An analogous flow model of large particles in vertical pipes was proposed and compared with the experimental data in the literature. Li et al. 13 carried out wear experiments on 3-mm-diameter particles in pipe elbows and obtained the relationship between the flow field and particle movement using the discrete element method (DEM), revealing the mechanism of wear formation. Tan et al. 14 used a high-speed camera to track the movement of large particles in a slurry pump, and the effects of the particle diameter and density on the particle flow and collision characteristics were analyzed. Bartosik 15 assumed that the wall shear stress of the overflow wall was equal to the sum of the fluid and particle shear stress on the wall and validated the mathematical theory for two-phase flow on the wall. It was proven that the shear stress of the particles on the wall surface was much larger than the shear stress of the fluid on the wall surface. Shen et al. 16 calculated the solid–liquid two-phase flow in a spiral centrifugal pump using a Euler–Lagrangian method. The results showed that the small particles wore relatively uniformly on the wall, the particle trajectories were longer, and the large particles were more concentrated at the wall. Moreover, the particles had larger collision angles with the wall, and the wear area of the impeller was mainly concentrated on the pressure surface. Some scholars have also conducted research on engineering problems. Serrano et al. 17 analyzed the effects of sediment concentration and water level on the impeller wear on a centrifugal pump and determined the relationship between material, particle concentration, and wear coefficient. Noon and Kim 18 predicted the wear of the slurry pump of the chemical company Imperial Chemical Industries (ICI) and found that the tongue and volute had the most significant effects and that the degree of wear increased as the speed, particle size, and concentration increased. The researchers also considered the effect of temperature on wear because temperature increases corrosion wear.
At present, the research methods of solid–liquid two-phase large particle wear in centrifugal pumps are limited, and there have been no comparisons between theory and experiment. The large particle interactions and the particle volume are rarely considered in the calculations, which is unrealistic. Experimental studies have involved only qualitative analysis and lacked data support. Thus, it is necessary to systematically study the large particle wear of centrifugal pumps.
In this article, we studied that the effect of the particle concentration on the performance of a centrifugal pump, and the wall wear rate was analyzed. In the experiments, the paint coating on the wall of a flow passage was used to show the wear position. We used an ultrasonic thickness gauge to measure the loss of thickness. Numerical simulations were carried out using a CFD–DEM coupled method. FLUENT (CFD) was used to calculate the flow field distribution, and EDEM (DEM) was used to calculate particle motion and wall wear. The purpose was to study large particle motion in a centrifugal pump and its influence on the performance and wear of the pump. This study revealed the wear mechanism and provided a theoretical basis for the loss reduction and optimized design of solid–liquid two-phase centrifugal pumps.
Centrifugal pump computational study
Solid–liquid two-phase coupling method
The solid–liquid two-phase coupling was studied using a Euler–Lagrange method, and the calculation involved two parts. The transient Navier–Stokes equation and the RNG k-ε turbulent model were solved in the Euler coordinate system to calculate the flow field distribution in the centrifugal pump using the CFD software FLUENT. At each time step, when the flow field iteration was complete, the DEM simulation began. The resistances, instantaneous velocities, and positions of the particles were calculated based on the fluid conditions using the DEM software EDEM. The particle coordinates and the forces generated by the particles were subsequently input to FLUENT. EDEM uses surface grids to describe boundary surfaces, thus achieving point-to-point coupling with boundary surface elements of CFD fluid grids. The schematic diagram of the process is shown in Figure 2.

CFD–DEM coupling method.
Governing equations
Fluid governing equations
The equations governing the fluid motion were as follows


where
Discrete phase governing equation
The particle diameter is large in this study, so the volume force (such as fluid drag force, contact force, and Magnus forces) cannot be ignored. The governing equations for the particle motion are based on Newton’s second law and are as follows

where
Wall wear model
The particle–particle and particle–wall interactions were considered in the DEM method. The soft-ball model was used for the particle contact model, 19 and the model proposed by Archard for particle wear on the wall surface is as follows 20

where W is the wear volume
Meshing and boundary conditions
The computational domain model and its meshing are shown in Figure 3(a). The impeller and the volute meshes were both tetrahedral, and the rest of the domain was a hexahedral mesh. After verifying the grid quality, its mass and minimum angle met the calculation requirements. The meshing independence verification is shown in Figure 3(b). When the number of meshes increased to 2,427,312, the performance parameters of the centrifugal pump tended to be stable.

Meshing and independence verification: (a) Geometry and mesh. (b) Mesh independence.
The boundary condition of the inlet of the centrifugal pump was a velocity inlet with a fluid velocity of 2.47 m/s, and an outflow outlet condition was specified. A sliding mesh was used to exchange data at the static and dynamic interface. The impeller rotated once in 0.0413793 s, and particles were released in the simulation after one impeller rotation. The initial velocities of the particles were set to 0 m/s, and they entered the centrifugal pump after acceleration by fluid drag. The FLUENT calculation time step was 2.298885 × 10⁻⁴. To more accurately simulate the particle motion, the time step was set to 2.29885 × 10⁻⁶ in the EDEM, corresponding to a ratio of the FLUENT and EDEM time steps of 100:1, and the Rayleigh time step was 38%. It is assumed that the particles are spherical with uniform surface and no viscosity, so Hertz-Mindlin contact theory 21 is adopted. In this theory, the contact area of particle–particle and particle–wall is very small. The normal stress is perpendicular to the contact surface. When tangential contact occurs, the sliding direction is consistent with the tangential force.
Centrifugal pump experimental study
Two-phase performance and wear experiments for different flow rates and particle concentrations were carried out. The experimental apparatus is shown in Figure 4. Pressure gauges were set at distances of 4d1 from the centrifugal pump inlet (d1 is the inlet pipe diameter, d1 = 100 mm) and 2d2 from the pump outlet (d2 is the outlet pipe diameter, d2 = 80 mm) to measure pressure and monitor the variation of the centrifugal pump head. A torque meter was set between the drive motor and the centrifugal pump to measure the torque and speed of the pump shaft, which was used to calculate the power and efficiency of the centrifugal pump. To prevent cavitation of the centrifugal pump caused by the lower inlet pressure, a pipeline pump was added before the inlet of the centrifugal pump to increase the inlet pressure. The inlet and outlet of the centrifugal pump were equipped with ball valves to regulate the flow in the system, and the flow rate was measured using an electromagnetic flowmeter. To prevent particles deposition in the tank, it is necessary to start the agitator blade and close the inlet valve before adding particles, and then start the centrifugal pump after several minutes of stirring.
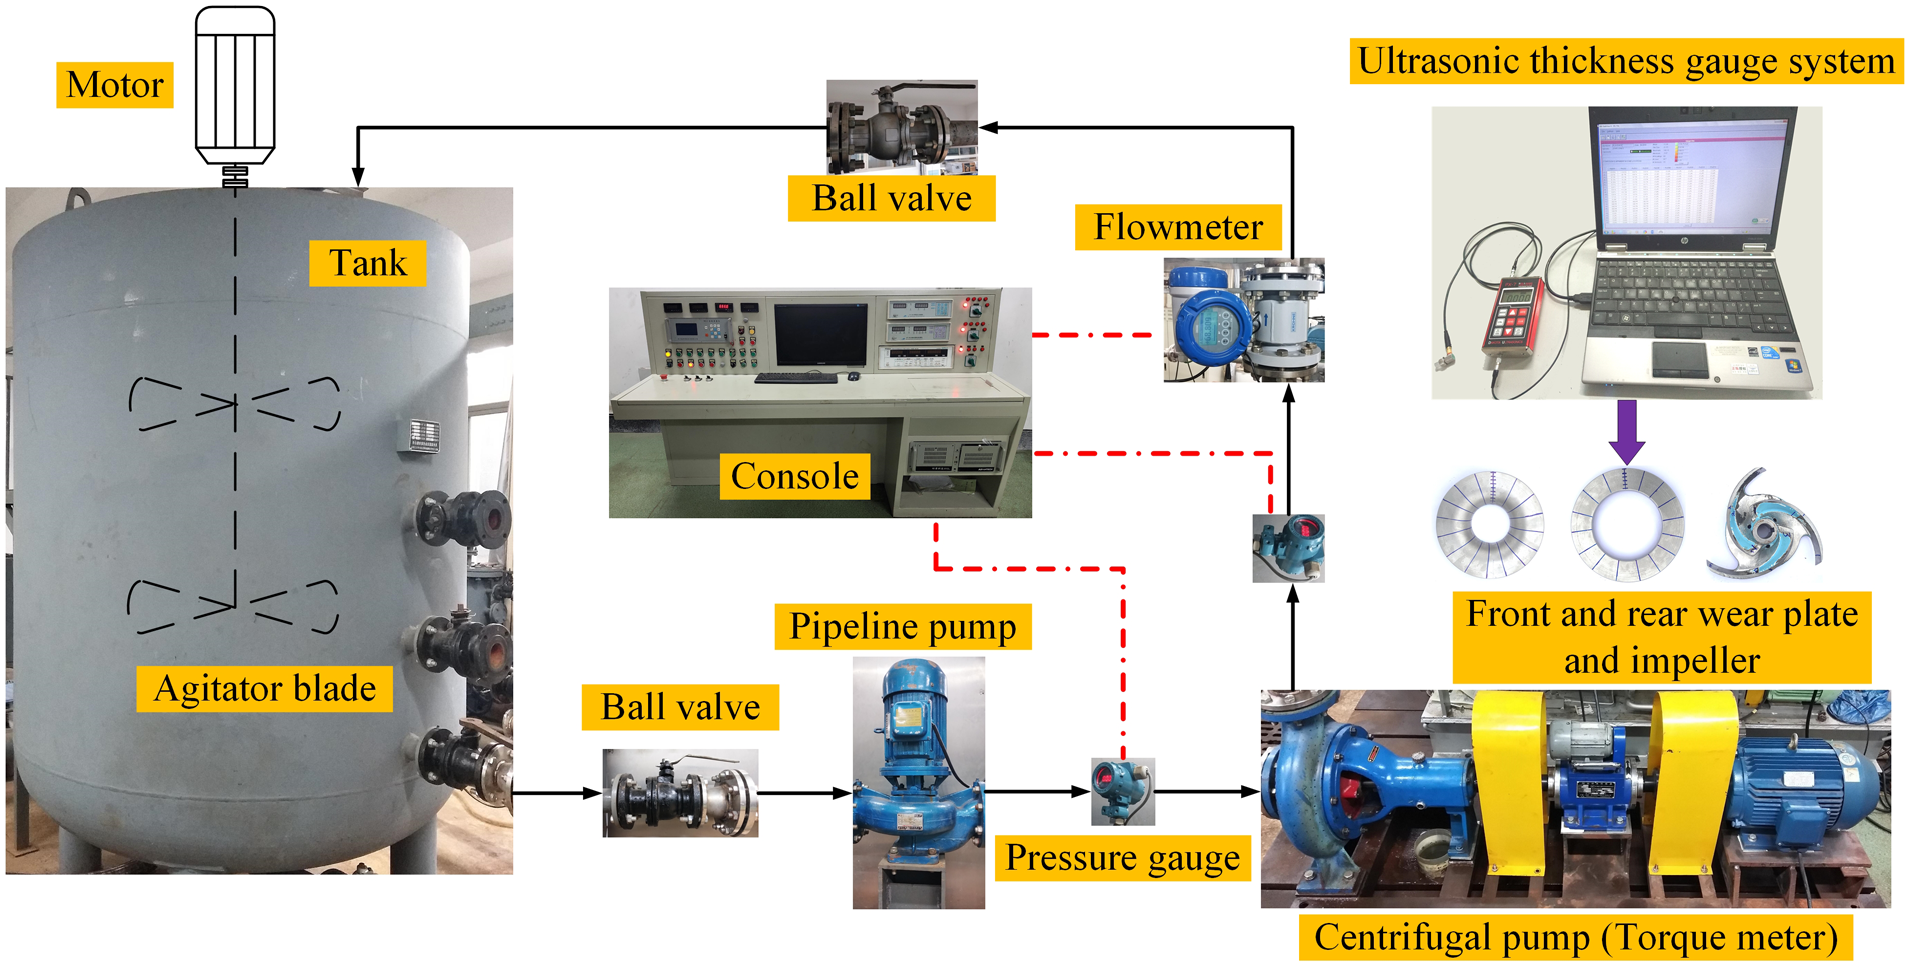
Centrifugal pump wear and thickness measuring experimental devices.
The experimental pump is shown in Figure 5. The rated flow was 70 m3/h, the head was 14 m, and the speed was 1450 r/min. The centrifugal impeller was a 3-blade fully open impeller, the impeller inlet diameter was 108 mm, and the outlet diameter was 265 mm. The front and back wear plates of this pump were detachable. The wear position was determined by monitoring the paint film, and the thickness loss was measured by the ultrasonic thickness gauge. Before the experiment, the centrifugal pump flow wall surface was coated with paint, and experimental test points were selected. The ultrasonic thickness gauge was a PX-7DL type, which could pass through the paint coating to measure the metal thickness with an accuracy of 0.001 mm. The paint coating was three layers, with a total thickness of 0.3 mm. The measuring points on the wear plate and impeller were arranged as shown in Figure 5. The line was arranged circumferentially at an angle of 22.5° in the counterclockwise direction. The front and back wear plates are arranged with 11 (P1-P11) and 6 (P1-P6) points in the radial direction. The thickness losses at these points were measured.

Centrifugal pump components and test point arrangement.
The particles were glass spheres. The particle diameters were 3 mm, and the glass density was 2700 kg/m3. The particle morphology is shown in Figure 6(a). One hundred particles were randomly sampled for diameter measurements. The diameter of more than 75% particles ranged from 2.95 to 3.05 mm, as shown in Figure 6(b), which met the experimental requirements. The particle mass concentration (Cm = solid mass / two-phase mass) was 1%–10% in each experiment, and the wear experiments were conducted for 48 h at different concentrations.

Particle morphology and diameter distribution: (a) Particle morphology. (b) Particle diameter distribution.
Result analysis
Centrifugal pump performance analysis
The solid-phase particles affected the energy exchange in the centrifugal pump, which changed its performance. Figure 7 shows the variation of the centrifugal pump performance with particle concentration at a rated flow rate. Cm = 0% represents the single-phase condition. The head and efficiency decreased with the increase in the mass concentration. This was due to the increase in the number of particles because more energy was required to move the particles. Moreover, the density and viscosity of the solid–liquid two-phase flow medium were higher than those of the single-phase fluid, so the frictional loss increased. Furthermore, the efficiency and head of the pump decreased. The centrifugal pump power was calculated from the rotor torque and the rotational speed, which first shows a slight rise and then a slow declining trend, and the shaft power reaches its maximum value at Cm = 7%.

Centrifugal pump performance variation with solid-phase particle concentration.
The flow field in the centrifugal pump determined how the external characteristics changed. Furthermore, the particles interacted with the fluid, which affected the internal flow field structure. It disrupted the flow field and reduced the performance of the centrifugal pump. Figure 8 shows the streamlines in the horizontal plane of the centrifugal pump. At the marked position, as the mass concentration of the particles increased, vortices appeared at the front and back cavities. The vortex scale was positively correlated with the concentration of particles. In the single-phase condition, the streamlines on the right side of the front and back cavity gaps were smooth, and a small vortex was generated when Cm was 3%. When Cm was 7%, the vortex filled the entire anterior chamber. The streamline in the impeller did not change significantly. However, the fluid velocity increased as the mass concentration of the particles increased because the particles occupied the flow channel area and caused a relative blocking effect on the fluid, causing the fluid velocity to increase.

Streamline distribution in the horizontal plane of the centrifugal pump: (a) Cm = 0%. (b) Cm = 3%. (c) Cm = 5%. (d) Cm = 7%.
Wear analysis of flow passage parts of centrifugal pump
Analysis of impeller wear results
An impeller is a high-speed rotating part in a centrifugal pump. When the particles collided with the impeller, severe blade wear appeared. Figure 9 shows the impeller wear at three mass concentrations. The wear near the blade head on the hub and the blade pressure surface was the most severe. The paint was completely worn off, and wall material was removed. The suction surface of the blade was less worn. This is consistent with the calculation results in Figure 10. Blade wear began from the tail of the blade and gradually moved toward the blade head. However, because the blade head faced the inlet pipe, when the particles collided with it, they had large axial velocities, causing impact wear on the blade head and hub center. At Cm = 3%, the paint on the hub was completely worn off and pits appeared, especially in the area of the material defects. The wear on other parts had a squamous appearance, and the wear depth gradually increased along the impeller rotation direction. As time increased and the concentration increased to Cm = 5%, the wear morphology changed. The wear on the hub deepened, and the pits at the material defects become shallower. The hub gradually became smoother at the edge where a squamous appearance formed. A new squamous region appeared in the area near the suction side of the blade. When the concentration increased to Cm = 7%, the squamous texture on the entire hub basically disappeared. The wear of blade pressure face gradually increased from the head to the tail, and a severe wear area appeared on the hub near the impeller inlet. The velocity direction of particles in the impeller is shown in Figure 10(d). The main type of wear was impact wear because the impact angle between the particles and the wall was large, and the velocity directions of the particles were almost perpendicular to the blade. Closer to the blade tail, the particle velocities were higher, and the resulting wear was greater.

Impeller wear experiment results.

Impeller wear calculation result (t = 0.413793 s): (a) Cm = 3%. (b) Cm = 5%. (c) Cm = 7%. (d) Velocity vector.
The impeller rotated periodically in the centrifugal pump, and the number of collisions with particles and the instantaneous wear characteristics of the impeller showed periodic changes. Particles were released in the second cycle of the impeller rotation, and the first batch of particles reach the impeller inlet at about 0.2 s. Based on the calculated results, Figures 11 and 12 show that the number of particle collisions between the pressure surface of the impellers and the instantaneous wear rate exhibited periodic peaks. The number of collisions was extracted from EDEM; the instantaneous wear rate is the ratio of the difference in wall thickness loss at adjacent time points to the time step.
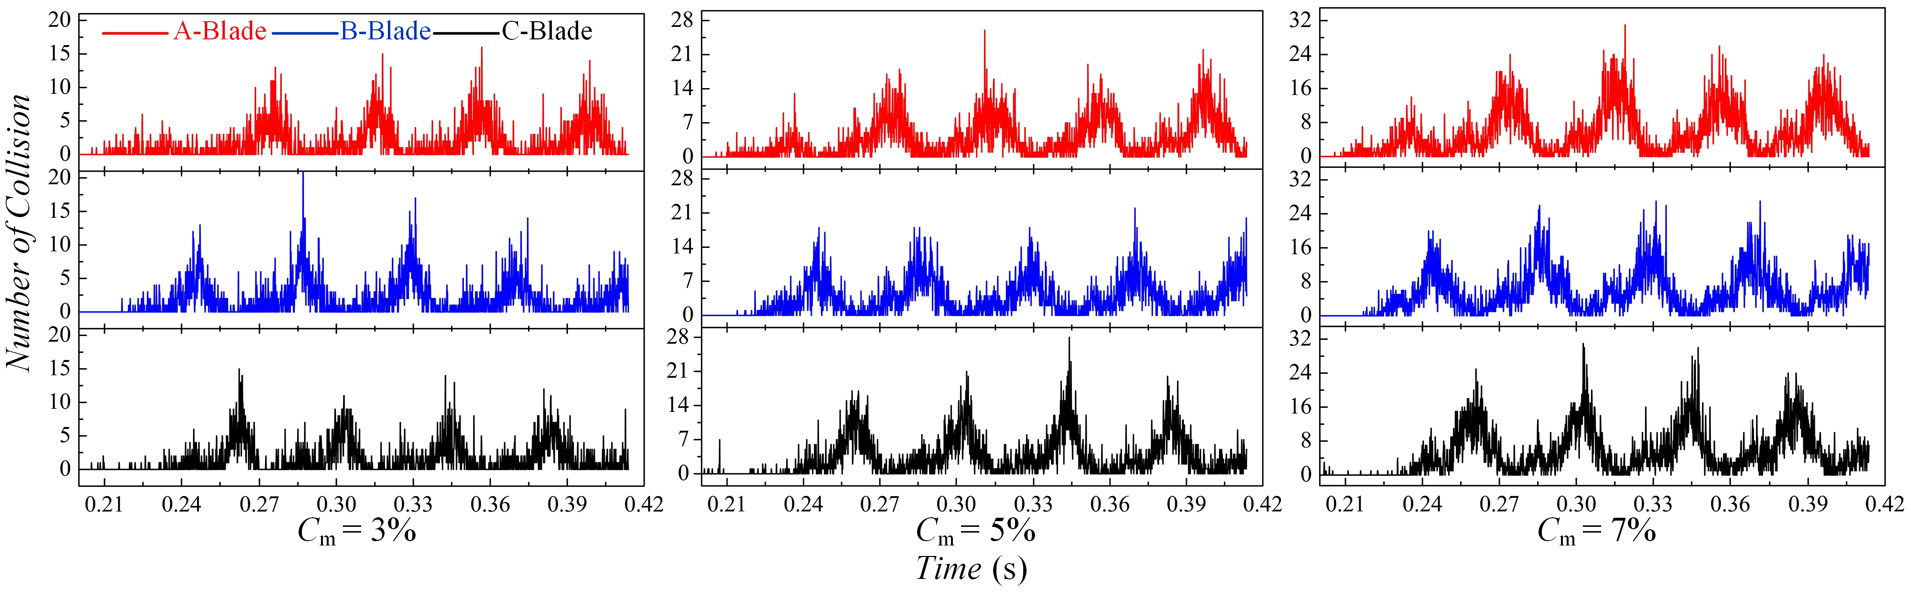
Number of collisions between the impeller pressure surface and particles.
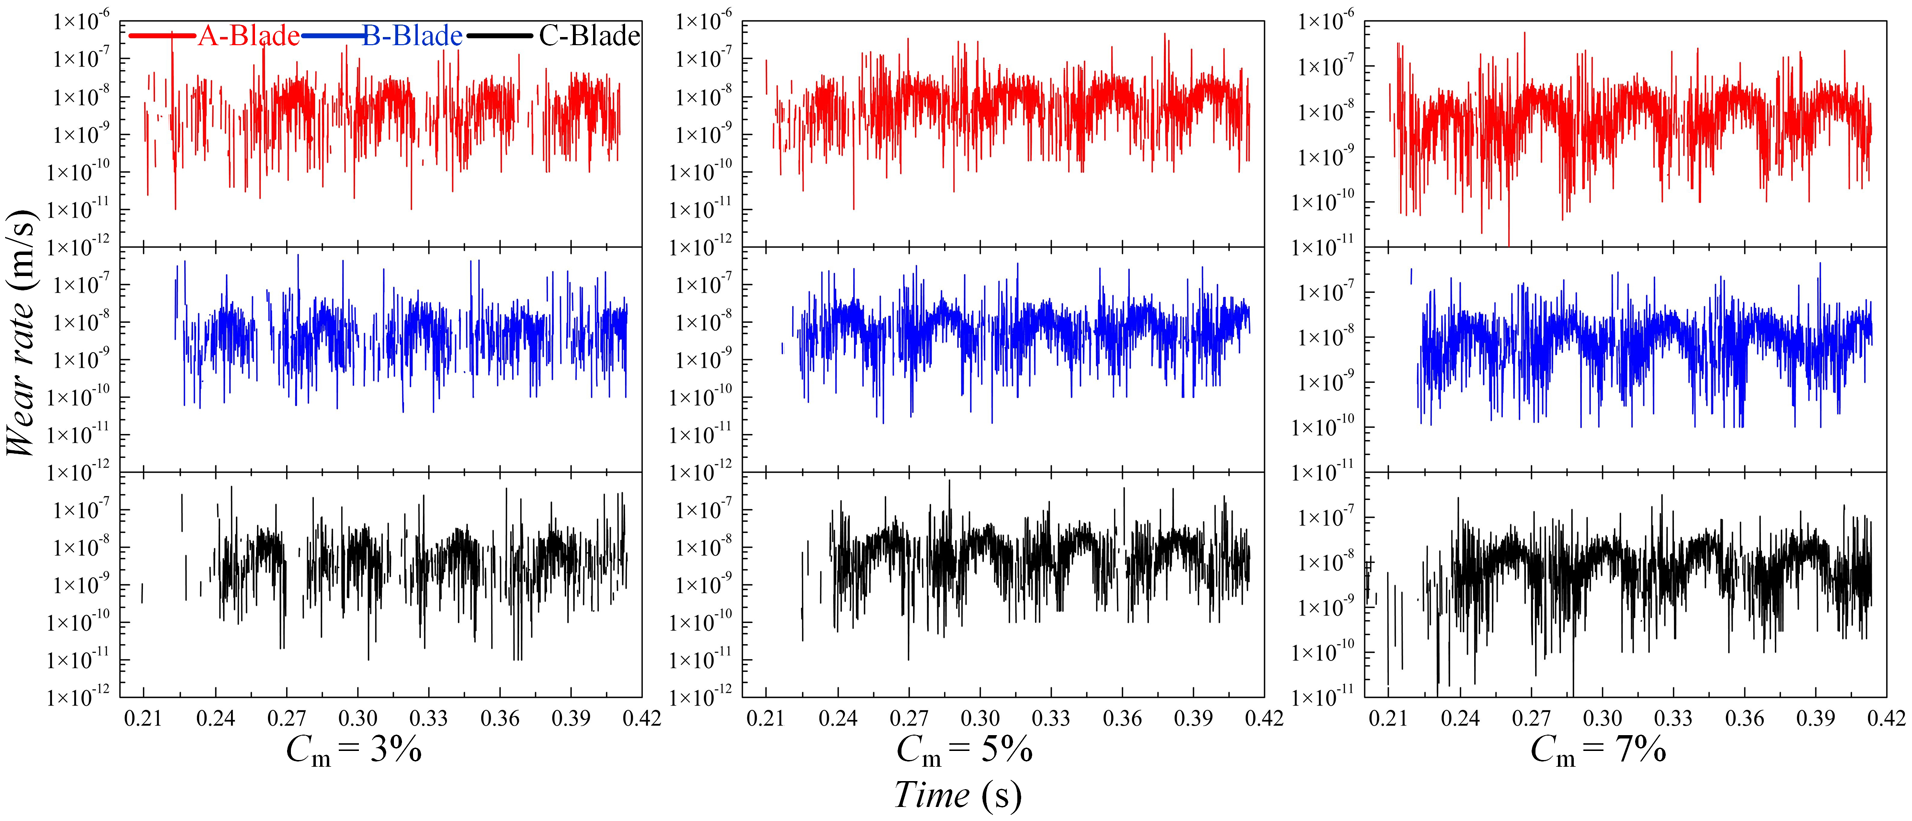
Instantaneous wear rate on the blade pressure surface.

Position of maximum instantaneous wear rate of blade: (a) numbering of local parts of volute and blades and (b) distribution of particles.
Analysis of volute wear results
Due to the fluid deceleration and pressurization in the volute, the particle flow in the volute was different from that in the impeller, and the wear mechanism of the volute was also different. This difference mainly showed the change in the contribution of impact and cutting wear. As shown in Figure 14, the wear trends on the volute at the three mass concentrations were consistent. The wear was most severe between the tongue and the exit region, and in sections 5–8, the degree of wear increased as the mass concentration increased. The average thickness loss between sections 6 and 7 was the maximum. Particles entered the volute after centrifugal acceleration from the impeller, and most of the particles adhered to the wall after contact with the volute. The velocity direction was parallel to the circumferential tangent of the wall, which created a model of the shear force for the wall. The velocity vector distribution of particles in sections 6 and 7 is shown in Figure 15(b) for Cm = 7% and t = 0.413793 s, and the particle velocity gradient was large here. The smaller the particle velocity near the wall, the longer the wear time on the wall. Furthermore, due to the force of gravity on the particles, the particles deposited more at the bottom of the volute, and particles moved in the rotation direction of the impeller under the impeller agitation. The maximum speed occurred at the outer edge of the blade, and particles flowed to the volute and decelerated after impact. Sections 6 and 7 were the key positions at which the high-velocity particles became low-velocity particles. Thus, the wear was most severe in these regions. Sections 2 and 3 exhibited the smallest thickness loss rate because this region contained the smallest number of particles. Most of the particles began to sink after being injected into the centrifugal pump, and only a few particles passed through the tongue again. Sections 2 and 3 were located at the top of flow passage, and particles were rarely in contact with the wall due to gravity in these sections. Thus, the wear in these regions was minimal.

Volute wear calculation result (t = 0.413793 s): (a) Cm = 3%. (b) Cm = 5%. (c) Cm = 7%.
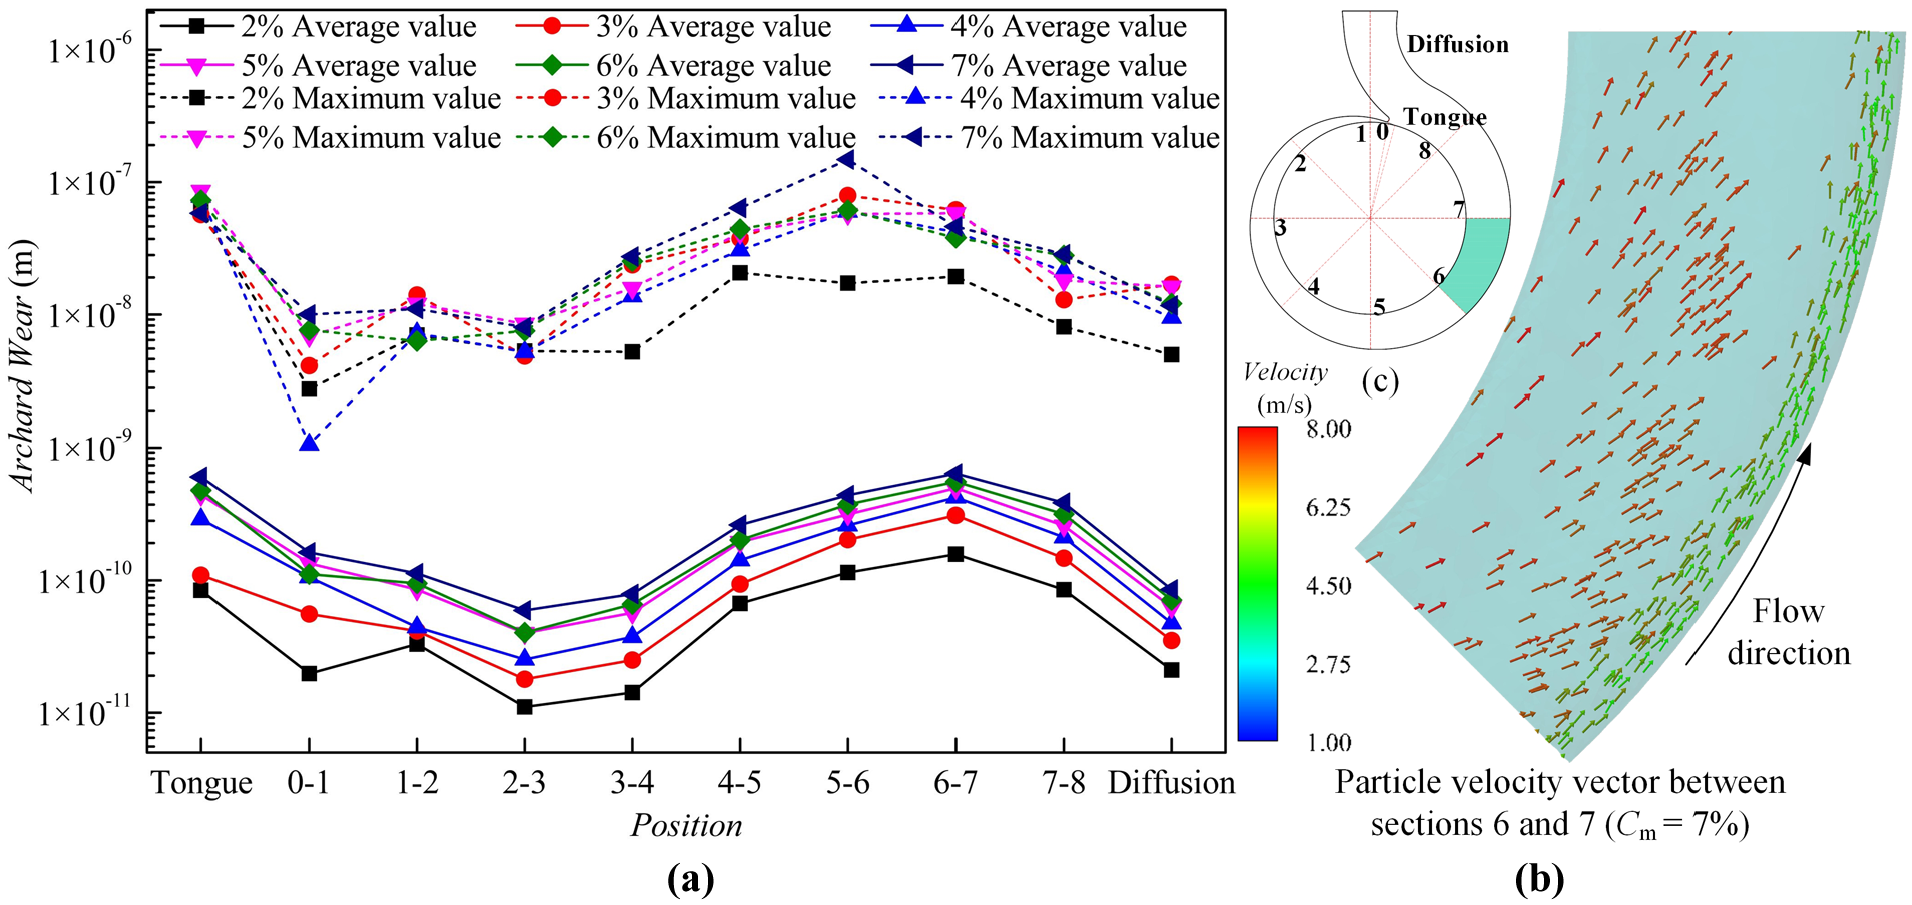
Calculated average wear rate and maximum wear rate (t = 0.413793 s): (a) wear rate of volute and (b) particle velocity vector between sections 6-7 (Cm = 7%).
Figure 15 shows that the wear maximum and the average values of the volute were consistent. As the mass concentration increased, the wear of each component increased. When Cm = 7%, the average wear rate was always the largest, and the minimum occurred when Cm = 1%. As the concentration increased, the difference between the wear of the adjacent concentration gradually decreased, resulting in cutting wear on the volute wall surface. Because the particles were slower near the wall of the volute, as shown in Figure 15, the particles accumulated to form a buffer layer. The particle movement was stable in the buffer layer, and the collisions in the buffer layer mainly occurred between the particles. Therefore, after the particle mass concentration increased to a certain value, the wear did not increase linearly, but tended to a relatively stable value.
The wear experiment (Cm = 7%) results of the volute are shown in Figure 16. There was less wear between sections 1 and 4, and the wear gradually increased from the fourth section. The wear was mainly concentrated in the middle of the volute. Not only was the paint completely worn off but also the material was partially removed. There was still a small amount of residual paint film on both sides of the volute. The wear surface of volute wall was smooth, which was caused by the small collision angles and sliding speeds of the particles in the volute. At the tongue, the wear intensified due to the impact of the particles. The impact wear morphology appeared at the tongue, and the material was plastically deformed. These pits affected the flow field, causing disturbances to the stable flow and affecting the stable operation of the centrifugal pump. In the diffusion section, due to the curvature transition of the flow channel, when the fluid-carrying particles flowed through, the particles moved along the wall tangentially. Thus, the particle deflection was severe, and there was almost no particle contact with the wall in the region tangent to the curved surface, producing less wear, as shown in area B.

Volute wear experiment results (Cm = 7%).
Figure 17 shows the calculated and experimental comparison in sections 3–7. The number of particles increased gradually along the flow direction. The contact time between the particles and the wall was long, and the wear gradually increased. The volute section was symmetric, but due to the direction of the flow at the inlet and the axial asymmetry of the impeller structure, the internal wear of the volute was uniform. The wear near the outlet side of the impeller was severe, and there was residual paint near the inlet side, as indicated in Figure 17.

Analysis of volute section wear (Cm = 7%).
The volute was in direct contact with the escaped particles in the impeller, and the wear characteristics also showed a periodic trend. However, this phenomenon did not occur in the diffusion section, as shown in Figure 18. The period number between sections 6 and 7 was equal to the product of the number of blades and the number of rotation cycles after the particles reached the volute. After the impeller rotated several turns, the wear tended to be stable. The instantaneous wear rate fluctuated about a fixed value, and the minimum value gradually increased and stabilized.

Calculated instantaneous wear rate of sections 6–7 and the diffusion: (a) Cm = 3%. (b) Cm = 5%. (c) Cm = 7%.
Analysis of wear results of wear plate
The front and back wear plates were static components, and there was a gap between the impeller and wear plates. Particles trapped in the gap rotated at high speeds driven by the impeller and caused wear on the wear-resistant plates. Figures 19–22 show the wear of the front and back wear plates at different mass concentrations, and the distribution of experimental data points is shown in Figure 5. The wear rate in the experiment is the ratio of the thickness loss to the wear time. Figures 20(a) and 22(a) show the wear rate at every measurement point in the form of a radar chart. Figures 20(b) and 22(b) show the maximum and average wear rate at different angles in the form of a line chart. Figures 19 and 21 show that the wear under the wear plate was severe due to the deposition of particles, and the wear pattern was related to the rotation direction of the impeller. At Cm = 3%, the wear rate was relatively stable, and the wear rate was relatively uniform and large over the whole wear plate. At Cm = 5% and 7%, the wear rate range increased, and the wear rate curves intersected, which was related to the experimental time and the wear plate material performance. When the concentration is small, at the same time the worn time is short as well, in this process, the material surface is going through the running-in wear. The actual contact area between particles and the material surface is continuously increasing; this will harden the material surface, forming a protective film, and the wear rate will be decreased. As the particle concentration increased and the pump was run for longer times, the material properties stabilized. Furthermore, the wear rate was random due to the irregular movement of the particles, and the wear rate was disordered. Figures 20(b) and 22(b) show that the largest wear rate appear at Cm = 3%. But the rule of wear rate is basically the same at Cm = 5% and Cm = 7%. This is because the gap between the impeller and the wear plate is small, and the particles have reached saturation at Cm = 3%. Due to the effect of particle buffer layer, the wear rate decreases.
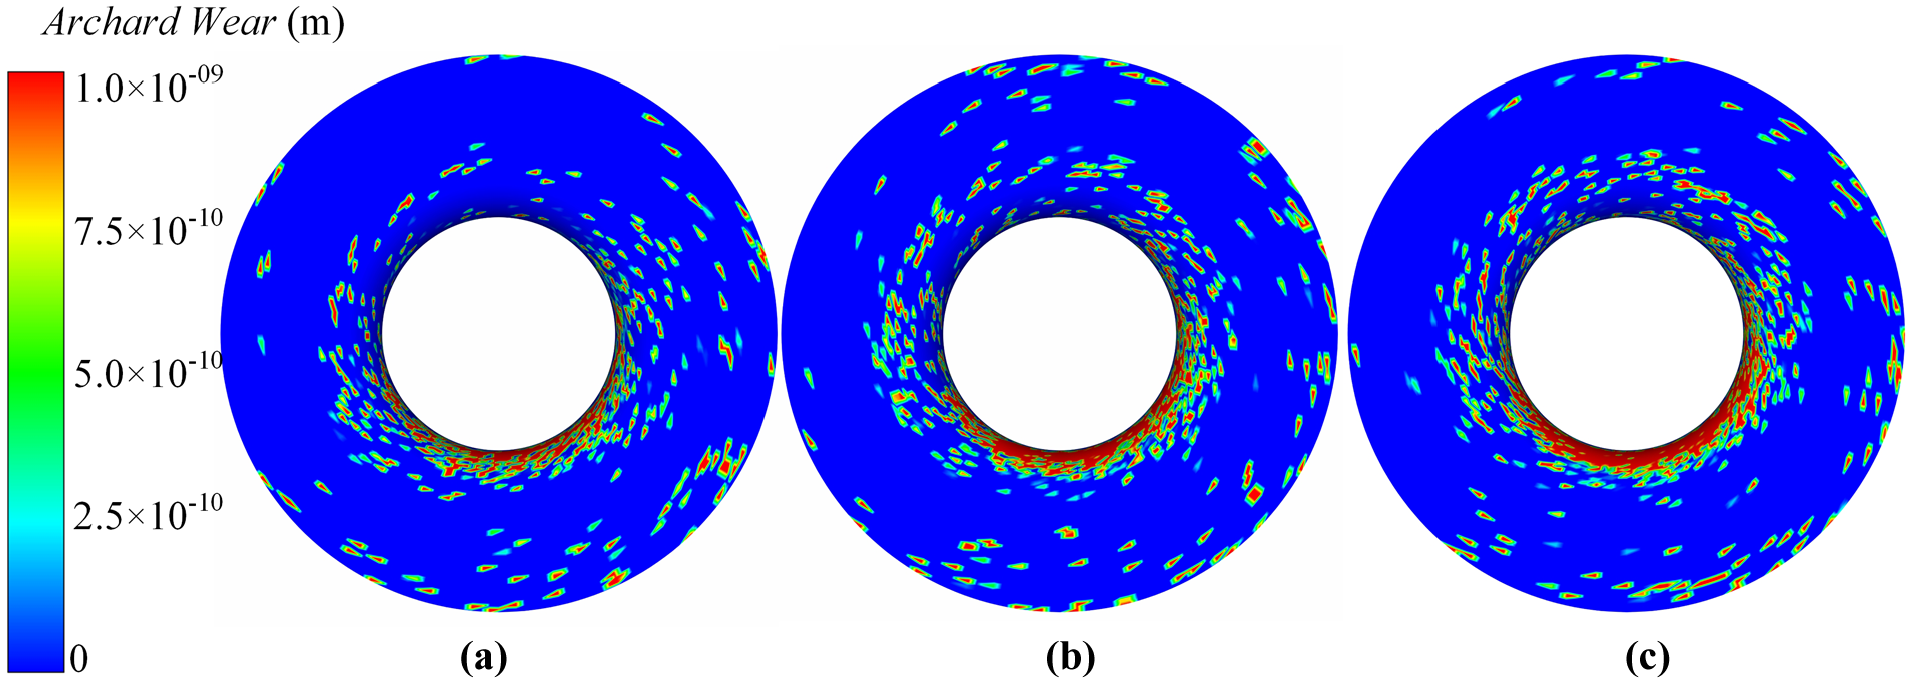
Calculated front wear plate wear (t = 0.413793 s): (a) Cm = 3%. (b) Cm = 5%. (c) Cm = 7%.

Experimental front wear plate results: (a) front wear plate wear rate radar graph and (b) front wear plate wear rate line distribution graph.
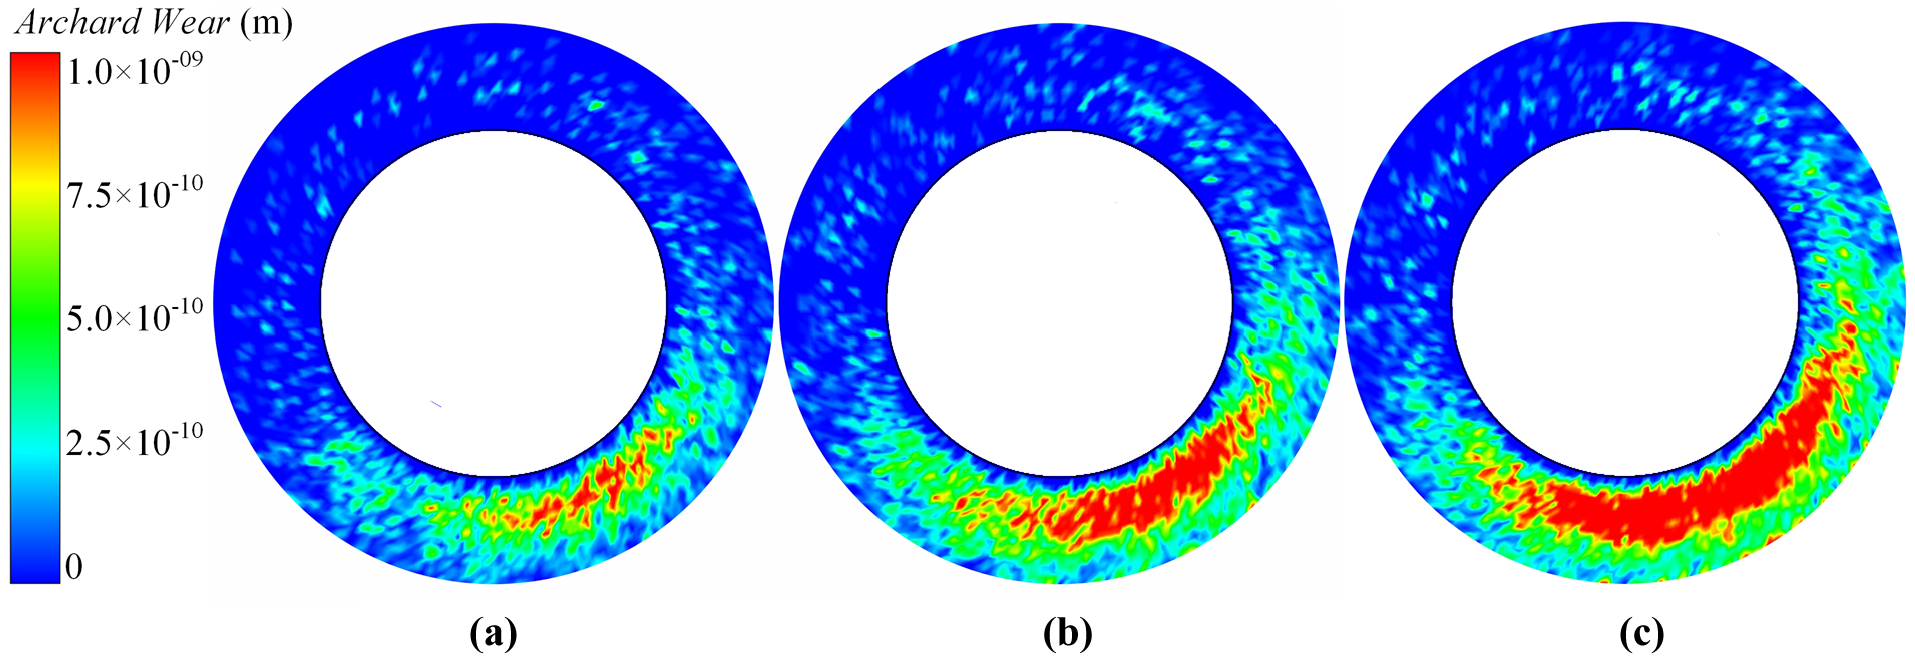
Calculated back wear plate wear (t = 0.413793 s): (a) Cm = 3%. (b) Cm = 5%. (c) Cm = 7%.

Experimental back wear plate results: (a) back wear plate wear rate radar graph and (b) back wear plate wear rate line distribution graph.
Figure 23 shows the instantaneous wear rate of the front and back wear plates at different particle concentrations. Due to the limited gap between the wear plates and impeller, the concentration had no evident effect on the wear of the wear plates, and the wear rate was around 1 × 10⁻¹⁰ m/s.
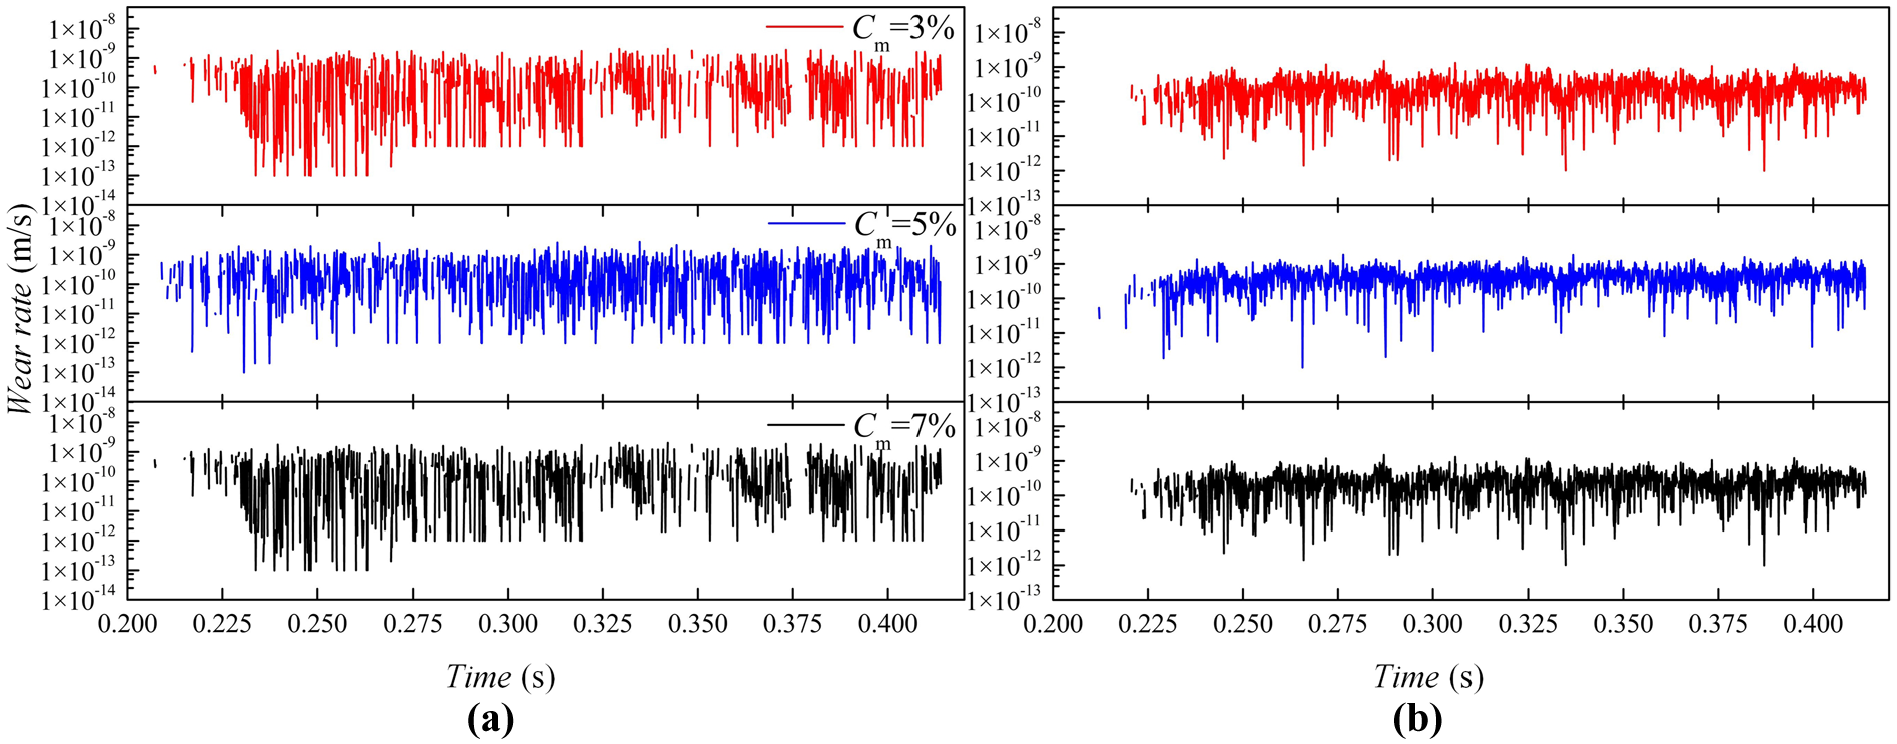
Calculated instantaneous wear rate on the wear plate: (a) Front wear plate. (b) Back wear plate.
Particle motion analysis
The centrifugal pump wear was closely related to particle motion. When the DEM calculations were performed, particles were randomly produced with uniform sizes at the inlet, and the initial velocities of the particles were 0 m/s. All the particles randomly generated in the first time step were marked. The average velocity of these particles in the centrifugal pump is as shown in Figure 24, and the particle velocities at different concentrations were consistent. Due to the drag force of the fluid, particles accelerated in the first stage of the inlet pipe, and their velocities gradually approached the velocity of the fluid. Before entering the impeller, the maximum velocities of particles reached 2.35 m/s. A slip velocity between the particles and fluid was evident. When the particle collided with the impeller inlet, the particle velocity decreased slightly due to the energy loss, after which the particles entered the impeller. The particles were subjected to the centrifugal force of the impeller, the particle velocity increased sharply, and the particle velocity at the impeller outlet was at most three times the inlet fluid velocity. When the particles moved to the tail of the blade and collided with the blade, the centrifugal acceleration of the particle disappeared, and the particles gradually decelerated. At low concentrations, the particles first collided with the tail of the blade. After the particles entered the volute, the collision frequency with the wall increased, the energy dissipation further expanded, and the particles gradually decelerated and flowed to the outlet.
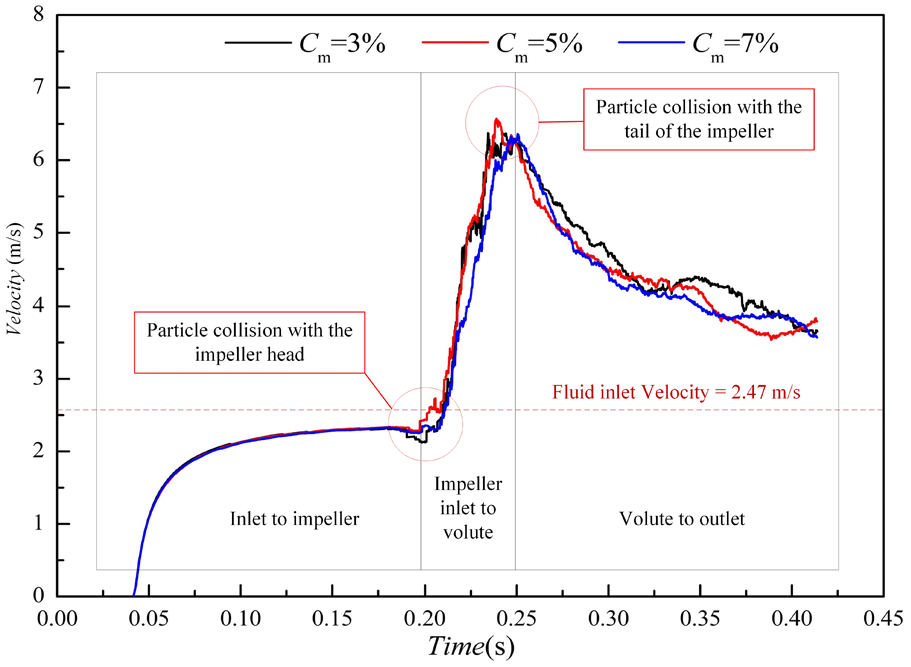
Average velocity of particles in the calculation domain.
Summary
The wear of a centrifugal pump with a solid–liquid two-phase flow is unavoidable. Thus, it is necessary to predict the performance loss and wear of the pump. A single-stage centrifugal pump was numerically simulated and experimentally studied, and the conclusions are summarized as follows.
The particle concentration in the solid–liquid two-phase centrifugal pump had a significant influence on the performance. With the increase in the concentration, the head and efficiency of the centrifugal pump dropped significantly. The power of the centrifugal pump weakly increased and then decreased, with little overall change.
The particles created varying degrees of wear on the surface of the flow components, such as the impeller, volute, and wear-resistant plate. The wear was most severe between the blade pressure face and the volute in sections 6 and 7. The instantaneous wear rate on wall showed certain regularity due to the periodic rotation of the impeller.
The particles entered the impeller along the pressure side of the blade. Due to the non-negligible effect of gravity on the large particles, the particles were distributed more in the middle and lower regions. When the blade rotated through these regions, the number of collisions between the impellers and particles and the wear rate of the surface were maximized.
The wear rate of the wall was closely related to the particle concentration. However, with the linear increase in the particle concentration, the wear rate growth trend decreased due to the particle buffer layer on the wall.
The results of the numerical simulation and experiment showed good consistency.
Footnotes
Acknowledgements
We are very grateful to Jiang zhongqian and Chen Xueyu for their help in the experiment.
Handling Editor: James Baldwin
Declaration of conflicting interests
The author(s) declared no potential conflicts of interest with respect to the research, authorship, and/or publication of this article.
Funding
The author(s) disclosed receipt of the following financial support for the research, authorship, and/or publication of this article: This work was supported by the National Natural Science Foundation of China (grant no. 51976197), and Key Research and Development Projects of Zhejiang Province (grant no. 2020C03099).