
Abstract
Centrifugal pumps are prone to wear failure when transporting solid-liquid mixtures. Accurate wear prediction enhances operational reliability. Due to the diversity of solid phase parameters, a reasonable wear model can effectively improve simulation accuracy. This study introduces the influence of particle mass into the E/CRC wear model. Using a CFD-DEM coupled method, internal flow and wear calculations were performed for centrifugal pumps under different particle size conditions. The accuracy of the numerical method and the modified wear model was validated through experimental comparisons, and the influence of particle size on wall wear characteristics was analyzed. The results indicated that increases in the particle size significantly enlarge the wear region of the blade working surface and the volute. The wear on the blade working surface was primarily concentrated in the lower portion of the back half of the working surface. Variations in the relative slip velocities between the particles and the fluid were the primary reasons for the differences between the wear characteristics of the head and tail of the blade working surface. The severe wear on the volute wall was concentrated in Sections 6–7 and 7–8, and it primarily occurred in the form of slip wear.
Introduction
Solid-liquid two-phase centrifugal pumps are widely used in fluid transportation fields,1,2 such as transporting sandy water in irrigation systems and slurry in deep-sea mining systems. 3 Particles collide and rub against the inner wall of the pump body, which can easily lead to wear and failure.4–6
Particle size is an important factor affecting wear. 7 Researchers have used experimental and numerical calculation methods to investigate the effects of particle size on the causes of wall wear and the amount of wear. Tressia et al. 8 observed the wear effects of small particles (0.15–1 mm) on steel using a scanning electron microscope and found that when the particle size exceeded a critical size, there was a linear relationship between particle diameter and wear mass loss. Tandel et al. 9 conducted scanning electron microscope analysis on the erosion failure mechanism of 304 stainless steel specimens and found that smaller particles (100–350 μm) produced microindentations and cuts on the surface, which caused wall wear. Novak et al. 10 conducted long-term experiments to study the effects of wear particles and experimental dust on the performance degradation of external gear pumps, and proposed an empirical formula for calculating wear amount by multiplying the area of the wear trajectory by the sliding distance.
Different researchers have also constructed wear models based on extensive wear test data, targeting different operating conditions and solid-phase parameters. McLaury and Shirazi 11 developed a CFD-based wear model to predict the maximum permeability of pipeline walls of various shapes. The model is based on extensive data regarding the motion of sand particles in multiphase flows that was gathered from organizations that investigate external wear. Sundararajan 12 proposed a wear model that assumes that erosion is caused by deformation greater than the critical strain and particle energy dissipation caused by friction between the particles and the surface during forward and oblique impacts. Hashish 13 revised Finnie’s particle-impact erosion model for plastic materials by incorporating the particle shape and removing empirical constants, thereby making it suitable for plastic materials subjected to particle collisions with low impact angles. Oka et al. 14 also proposed equations to predict the wear rates of metal walls; this was done by using wear-related parameters as variables and by utilizing data from extensive wear experiments.
Based on the above different wear models, researchers conducted corresponding numerical calculations to complete the wear analysis. Wang et al. 15 found that the particle kinetic energy was an important cause of channel-component wear when an open-impeller centrifugal pump conveyed dense and fine-grained two-phase media. Li et al. 16 studied the effect of particle size changes on internal wear in centrifugal pumps and used the DPM method to perform numerical simulations of solid-liquid two-phase flows. They found that the particle size had a remarkable impact on wall wear characteristics, and that reducing the angle of outlet blade could reduce the wear. Shen et al. 17 numerically simulated the internal flow field of a screw pump when it conveyed a solid–liquid two-phase flow with small particles. The results demonstrated that, within a certain particle diameter range, the trajectories of low-density fine particles were longer, the number of collisions with the runner components was greater, the energy losses were larger, and the wear was relatively uniform.
However, since wear models are mostly semi-empirical and semi-theoretical formulas obtained through theoretical analysis and experimental research under different operating conditions and material combinations, 18 selecting an appropriate wear model is important for improving the accuracy of wear prediction. Peng and Cao 19 noted that it is easier to execute the E/CRC wear model than other wear models in CFD software. In addition, particle hardness and shape factors are considered in this model, and the numerical results it produces are nearer to experimental results than are those produced by other models. Wang and Shirazi 20 used the E/CRC model to conduct a wear study for 90° elbows and bends with circular cross-sections. Good qualitative agreement was obtained when the predicted permeability values were compared with experimental data. However, the E/CRC wear model commonly used in existing research is often applied to gas-liquid two-phase flow and small particle solid-liquid two-phase flow. When used for large particle solid-liquid two-phase flow simulation calculations, there is a certain discrepancy in accuracy. In order to more accurately predict the impact of large particles on centrifugal pump wear, existing wear models must be modified.
Therefore, in this study, the effects of particle mass were introduced into the E/CRC model. Through the EDEM secondary development function compilation API, a mass-corrected wear model was used to complete the numerical prediction of solid-liquid transport centrifugal pumps. The wear characteristics of the internal flow walls of centrifugal pumps were analyzed, and the effect of particle size on the wear characteristics of centrifugal pump blades and volutes was discussed. Through these studies, it is expected to provide a basis for anti-wear design of centrifugal pumps.
Research object and methods
Experimental methodology
Figure 1 depicts a schematic and photographs of the solid–liquid two-phase centrifugal-pump experimental system used during this study. To prevent the inlet pressure of the experimental pump from being too small, which would cause cavitation that would produce additional cavitation damage and, in turn, solid-phase wear-detection errors, the inlet pipeline was supplied with a pipeline pump for pressurization. A pressure sensor was installed at the inlet and outlet of each pump to monitor the head in real time. A torque meter was placed between the drive motor and the centrifugal pump to measure the torque and speed of the rotating shaft of the centrifugal pump. Ball valves and electromagnetic flow meters were used to adjust and monitor the internal flow, respectively. The research object was a an HCK100-80-250 centrifugal pump. It had a rated flowrate of 70 m3/h, a head of 14 m, a rotational speed 1450 r/min, an inlet diameter of 100 mm, and an outlet diameter of 80 mm. A centrifugal impeller was used as the three-blade fully-open impeller; it had an inlet diameter of 108 mm and an outlet diameter of 265 mm. Round glass spheres with diameters of 4 mm and densities of 2700 kg/m3 were used as the particles. A Mohs hardness of 6.5 was measured for the particles using a digital Brinell hardness tester.

Experimental system (schematic and photographs).
In the two-phase experiments, to reduce the experimental error, the mixing paddle in the mixing tank was opened after water was added to a certain level; then, a calculated amount of particles was added. After the particles and water were evenly mixed, a circulation experiment was started on the experimental platform. The centrifugal-pump wear experiments were conducted with a mass concentration, Cm, of 3%. The openings of the inlet ball valve and the outlet motorized ball valve were adjusted to ensure that the circulating flowrate in the system was equal to the rated flowrate of the centrifugal pump (Q = 70 m3/h). The experiments were conducted for 120 h. After the centrifugal pump had been running for 120 h, the stirring-paddle motor, pipeline pump, torque speed sensor, inlet and outlet pressure sensors, outlet motorized ball valves, and drive motor of the experimental pump were turned off. Finally, the mixing tank was cleaned and the particles were recycled. The wear measurement method used for the blade working surfaces of the centrifugal pump is described next. First, a laser 3D scanner was used to scan the working faces of the blades before and after the wear test. Then, the point-cloud data obtained from the before-and-after scans were compared to obtain error chromatograms, which were used to identify the dimensional errors. The wear depth was obtained at each measured point on the blade working surfaces, and the maximum value was removed to reduce the accidental error. The average wear depth was calculated for each blade working surface. Finally, the average wear rates for the working surfaces of the blades were obtained by dividing the average wear depths by the corresponding testing time.
Simulation methods
Coupled CFD–DEM calculation methods
CFD–DEM coupling is a two-way coupled computational method based on the Euler–Lagrange method, in which the Fluent software solves the transient Navier–Stokes (N–S) equations and the turbulence model in the Eulerian coordinate system to compute the flow-field distribution in a pump. At each time step, when the iterative flow-field calculations were complete, a DEM simulation was conducted. During this simulation, the EDEM software calculated the Lagrangian transport of the particles according to the force of the flow field that acted on the particles in the grid cells and updated the position and velocity data. Fluent then used the particle data to update the flow-field changes for the next time step and calculated the force of the fluid that acted on the particles.
Solid–liquid two-phase flow model
When performing numerical simulations of solid-liquid two-phase flow inside centrifugal pumps, the fluid phase is described using the N-S equations, including the continuity equation and momentum conservation equation. The closure of these equations is achieved by using an improved RNG k-ε turbulence model, which is an improvement on the original RNG model. The RNG k-ε model can better handle high strain rates and flows with large streamline curvatures by correcting the turbulent dynamic viscosity coefficient. Therefore, the RNG k-ε turbulence model was selected for subsequent calculations in this study.
The governing equations for the particles are the momentum and angular momentum conservation equations, which are respectively given by:


where

where
When particles collide, the contact force between them includes normal and tangential contact forces, and they are deformed by the collision force. A larger collision force produces greater particle deformation. The Hertz–Mindlin contact model is usually adopted as the primary means of characterizing the particle interaction forces.
21
The normal force,


where
Wear model
Wear models are crucial to wear calculations, and many scholars have proposed alternative methods for erosion-rate predictions. This section discusses the analysis and comparison of several commonly used wear models, as well as the mass corrections that were made to the wear model for solid–liquid two-phase transport of large particles.
The Archard wear model 22 posits that friction causes microscopic relative displacement of the contact surfaces, leading to the detachment of material particles. This model is related to friction, contact area, and material hardness. 23 The Hutchings model 24 is based on energy balance and proposes an equation for predicting the wear rate when spherical particles impact a metal surface at a normal angle. When dealing with complex multiphase flows, non-uniform wear, or other special operating conditions, the predictive capabilities of the above analytical models are insufficient.
The Finnie model 25 predicts the relationship between the maximum erosion impact-angle and erosion-velocity based on the number, direction, and velocity of collisions between particles and ductile materials. Neilson and Gilchrist 26 derived an equation based on Finnie’s study that considers the wear volume of the wall surface caused by both cutting and deformation wear, taking into account the impact angle. Tilly 27 found that the total erosion wear of plastic materials is the sum of the two types of wear. All of the above are semi-empirical models. Semi-empirical models typically lack a complete description of physical mechanisms, resulting in inaccurate predictions in certain special cases.
Sheldon and Kanhere 28 developed a wear model for single particles that is based on material indentation properties. Grant and Tabakoff 29 proposed an empirical formula for wear on aluminum alloy and stainless steel surfaces impacted by pulverized coal based on experimental data, expressing the degree of wear in terms of the erosion per unit mass of impact particles. However, such empirical models lack universality and are often only applicable to operating conditions similar to the experimental conditions.
The E/CRC wear model30–34 considers the effects of particle hardness, particle sharpness, particle shape, particle velocity, particle concentration, and impact angle, defining the erosion rate as the ratio of surface mass loss to incident particle mass. 18 The model is widely applicable, but ignores the influence of particle mass on wear results. When centrifugal pumps transport larger particles, the inertia of the large particles causes them to follow the liquid poorly, which has a significant impact on the movement trajectory of the particles and wall wear. In order to introduce the influence of particle mass, this study was modified based on the E/CRC wear model. The modified wear-mass equation for the wall is as follows:

where

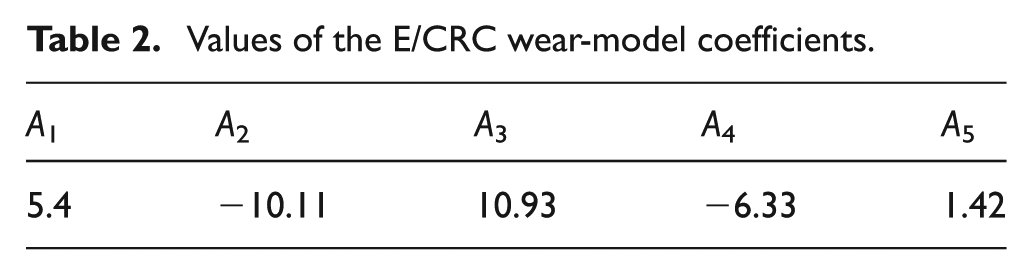
The physical significance and value of each parameter in equations (11) and (12) are listed in Tables 1 and 2. 32
Physical meanings of the wear-model parameters and their values.

Values of the E/CRC wear-model coefficients.
Using the secondary-development API function of the EDEM software, the wear model described above was imported into EDEM by means of customized C++ attributes and subsequent simulation calculations. A flowchart of the API compilation process is shown in Figure 2.

API compilation flowchart.
The API compilation for the wear model was performed in the Microsoft Visual Studio 2010 software by compiling the required header and source files and then generating corresponding dynamically linked library files. The combined properties such as impact velocity and impact angle, along with new wear properties, were added to the source files. After the custom properties were compiled, the formulas for impact angle and impact velocity were incorporated into the core functions of the contact model and solved. Finally, the formula for calculating wear amount was added to generate a dynamic link library file, which was then loaded into the EDEM software for subsequent wear calculations.
The impact-angle solution, which is shown in Figure 3, assumes that the 3D coordinates of the particle–wall contact point, point H, are
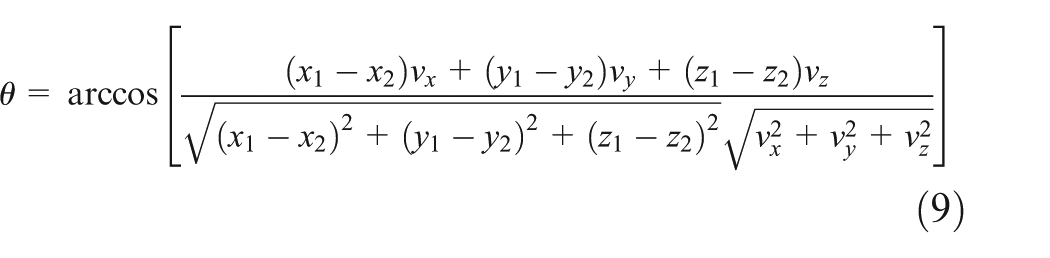

Impact-angle schematic.
After
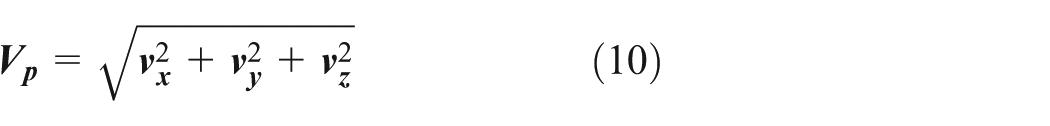
After the parameters discussed above were solved for, the compilation was completed according to the flowchart in Figure 2. The dynamically linked library file was generated and loaded into EDEM 2018 so that the wear calculations could be performed.
Calculation grids and boundary conditions
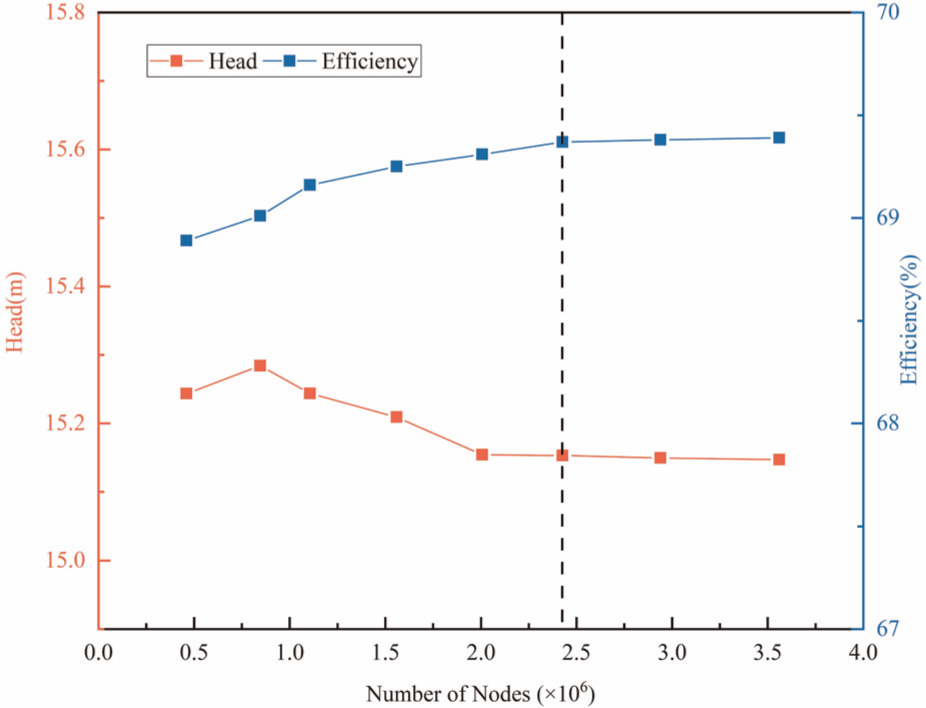
The grids used in the simulations are shown in Figure 4. The impeller and volute domains were drawn with unstructured grids, while the rest of the parts used structured grids. A total of eight grids were drawn, and the number of grid nodes ranged from 460,426 to 3,561,073. The specific simulation results for various numbers of nodes are presented in Figure 5. Figure 5 shows that, as the number of nodes increased, the head and efficiency of the external characteristic indexes gradually tended toward stabilization. After full consideration of the reliability of the calculations and the calculation time, a final selection of 2,427,312 nodes was made for the numerical simulations. In addition, checks revealed that the quality of the grids used and the minimum angle both satisfied the computational demands.
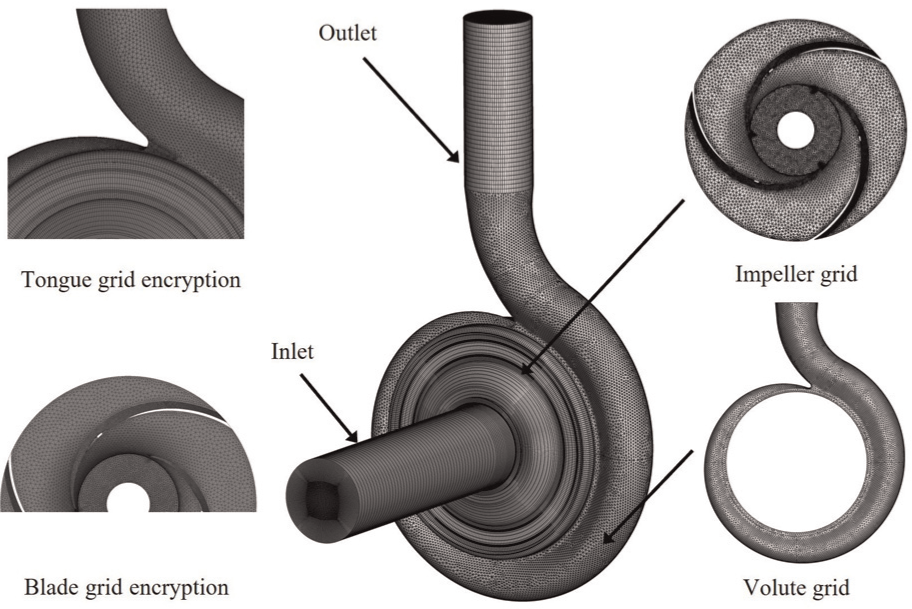
Grids used by the simulation model.
Grid-independence verification results.
Next, simulations were conducted for the centrifugal pump. The material settings for the continuous phase, walls, and particles were selected with reference to existing literature,35–37 and they are listed in Table 3. The inlet and outlet were assigned velocity and outflow boundary conditions, respectively. It took 0.0413793 s for the impeller to rotate 1 week, so Fluent calculated the time step to be 2.29885 × 10⁻⁴ s, which is equal to the time required for the impeller to rotate 2°. The total simulation time was set to 1.24138 s, which is the time required for the impeller to rotate 30 weeks. The initial time step in Fluent is generally larger than that in EDEM. In this study, the EDEM time steps was 5.747135 × 10⁻⁷ s, the Rayleigh time step for this time step was 28.5972%. These values all aligned with the calculation demands, as shown in Table 4.
EDEM and Fluent parameter settings.

Numerical boundary-condition settings.

Validation of the numerical simulation method
To verify the accuracy of the numerical simulation method, the external characteristic results produced by the numerical simulations were compared with the external characteristic results obtained from the experiments. The comparison between the experimental and calculated values of the external characteristics shown in Figure 6 indicates that the experimental and simulation trends were essentially in agreement, though the experimental values were slightly lower than those obtained numerically. Although power losses due to volumetric spillage and mechanical abrasion were excluded from the numerical calculations, the maximum error remained less than 5%; thus, the results fell within a reasonable margin of error.

Comparison between the experimental and simulated values of the external characteristics.
Results
Table 5 presents the experimental results for the wear of a blade working surface and suction surface caused by 4 mm particles with a mass concentration of 3%. It also compares these results with the average wear rates calculated by the mass-modified wear model and the Archard wear model. Table 5 shows that the accuracy of the wear values calculated by the modified wear model was significantly greater than that of the values calculated by the Archard wear model.
Comparison between the wear results obtained from the experiments and two wear models.

Figure 7 compares the experimental wear and the wear calculated by the modified wear model for the blade working surface. It demonstrates that serious wear occurred below the working surface of the blade and that wavy wear was produced in the lower portion of the back half of the working surface. The simulation results were in good agreement with the experimental results.

Comparison between experimental and simulated wear on the blade working surface.
To explore the wear patterns and wear rates in various regions of the centrifugal pump and how they are influenced by the operating parameters, a model pump was investigated under different particle-size conditions and stable operating conditions. During this study, the particle mass concentration was set to 3% and was held constant across the various particle sizes. Particle diameters of 1, 2, and 4 mm were investigated.
Wear patterns throughout the centrifugal pump
To explore the wear characteristics of the overflow wall of the centrifugal pump, the wear patterns in various regions of the centrifugal pump were predicted and the average and maximum wear rates in the different regions were compared when the particle diameter was 4 mm. Figure 8 depicts the wear on each overflow component of the pump for steady operating conditions. Components investigated were the blade working surface, the blade suction surface, the front wear plate, the rear wear plate, and the volute. The blade suction surface, the front wear plate, and the diffuser exhibited much less wear than the other overflow components. The rear wear plate experienced slight wear on its lower right side, while the blade working surface and the volute exhibited more severe wear, especially at the trailing edge of the blade working surface and on the rear half of the volute.

Wear on the overflow components of the centrifugal pump.
Figure 9 compares the average and maximum wear rates of different regions of the centrifugal pump for steady operating conditions when the particle diameter was 4 mm. It is evident from Figure 9 that the largest maximum wear rate occurred at the blade working surface, while the next largest maximum wear rate occurred at the volute; these rates had values of 2.26 × 10⁻⁷ and 2.14 × 10⁻⁸ kg/s, respectively. The largest average wear rate occurred at the blade working surface and was equal to 5.16 × 10⁻⁹ kg/s. The smallest maximum and average wear rates both occurred at the front wear plate and were equal to 1.41 × 10⁻⁹ and 1.34 × 10⁻¹¹ kg/s, respectively. The distribution patterns of the maximum and average wear rates were more consistent; for example, the maximum and average wear rates of the blade working surface and the volute were larger than those of the front and rear wear plates and the diffuser. In addition, the difference between the maximum and average wear rates for the same region was large; for example, the maximum wear rate at the blade working surface was 43 times greater than the average wear rate. This analysis demonstrates that the blade working surface experienced the most severe wear; however, the volute wear was also very significant.

Comparison of the wear rates of the overflow components under steady operating conditions.
Wear analysis for the blade working surface
Since the maximum wear rate occurred at the blade working surface, further analysis of the effects of the particle size on the wear pattern of the blade working surface and on the wear rate variation trends was conducted. The results are presented in Figure 10.

Wear clouds and wear-rate line graph for the blade working surface.
Figure 10 depicts wear clouds for the blade working surface and a wear-rate line graph for the various particle sizes. In the figure, Region a comprises the first half of the blade working surface, Region b comprises the middle of the blade working surface, and Region c consists of the second half of the blade working surface. The figure shows that, as the particle size increased, the wear on the blade working surface gradually increased. It is obvious from the wear clouds that, for all the particle sizes, the wear on the working surface was primarily concentrated in the lower portion of the back half of the working surface (Region c). As the particle size increased, the region of severe wear gradually moved upward. When the particle diameter was 4 mm, the lowest portion of the blade appeared to exhibit wavy wear. The first half of the working surface (Region a) experienced minor wear, while almost no wear was observed at the middle of the blade working surface (Region b). The line graph of the wear rates shows that, as the particle size increased, the increases in the wear rate on the blade working surface became progressively greater. Overall, the wear pattern on the blade working surface was significantly affected by the particle size. As the particle size increased, the size of the wear region gradually increased.
To further understand the wear caused by the particles in various regions of the blade working surface, Figure 11 depicts radial divisions of the blade working surface along the impeller. The 10 concentric circles in the figure represent equal divisions of the working surface in the radial direction of the impeller. Due to the blade shape, when the value of ri/R is within the 0–0.2 range, the circles do not intersect with any portion of the blade working surface. Therefore, correlation analysis was performed only for ri/R values greater than 0.2.

Divisions of the blade working surface along the radial direction of the impeller.
Figure 12 presents the wear analyses various regions of the blade working surface for various particle sizes. Figure 12(a) depicts the ratio of the number of collisions between particles and various regions of the working surface to the total number of collisions between particles and the working surface. The figure demonstrates that, as ri/R increased, the proportion of collisions gradually increased when the particle diameter was 1 mm. The ratio exhibited significant fluctuations for particle diameters of 2 and 4 mm, however. The largest proportion of collisions occurred in the tail region (ri/R = 0.7–1, Region c); this was demonstrated to be the most severely worn portion of the working surface in Figure 10. The region with the second-largest proportion of collisions was that of the blade head (ri/R = 0.3–0.4, Region a); according to Figure 10, this region sustained slight wear. For the middle region of the working surface (Region b), which was significantly smaller than the other two regions, it was assumed that the number of particle collisions had a certain relationship with the wear degree. In addition, particle collisions occurred more frequently with the first half of the blade working surface when the particles were large, while collisions occurred more frequently with the second half of the working surface when the particles were small. A reason for this phenomenon may be that, when the particles were large, and thus had greater masses and more inertia, they were less likely to be driven by the fluid, especially because the velocity of the fluid in the first half of the blade was relatively low. The gravitational force may then cause downward settling of the particles, and flow stagnation in the low-speed region could lead to particle accumulation. Due to the high velocity of the fluid near the back half of the blade, the inertia of the particles could enable them to move out of the fluid. Thus, the fluid flow has smaller effects on large particles, and mass-induced inertia changes are primary factors that contribute to these wear phenomenon.

Wear analyses for various regions of the blade working surface for different particle sizes: (a) Collision ratio of particles in each regional segment, (b) Energy loss of particles in each regional segment, and (c) Sliding velocity of particles in each regional segment.
Figure 12(b) depicts the energy losses in various regions of the blade working surface for various particle sizes. The figure shows that the energy-loss trends along the radial direction were similar for all the particle sizes and that the energy losses increased as the particle size increased. The energy losses increased as ri/R increased, and the largest energy losses occurred when ri/R = 0.7–1. Significant energy losses also occurred when ri/R = 0.3–0.4. These regions correspond to the back half of the working surface (Region c), which had the most particle collisions, and the front half of the working surface (Region a), respectively. It is evident that the wear occurred because, when the particles collided with the wall, the kinetic energy they lost was used to produce wall deformation. When the deformation increased to a certain extent, the wall material peeled off and wear appeared.
Figure 12(c) compares the particle slip velocities (the difference between the flow-field velocity and the particle velocity) of various regions of the blade working surface for different particle sizes. The particle slip velocity gradually decreased as ri/R increased, and it ranged from 5.2 to 7.0 m/s. Compared with 2 and 4 mm particles, the sliding speed of 1 mm particles is relatively stable overall, with a small decrease. This indicates that small particles are strongly entrained by the fluid, and at different radial positions on the working side of the blade, the difference in fluid velocity is not significant, and the consistency of movement is good. In the impeller head region, the relative slip velocity between the 4 mm particles and the fluid was large, the particle aggregation was high, and the number of collisions between low-velocity particles and the wall was high. In contrast, the 1 mm particles had a small slip velocity, and they easily moved with the fluid. In the middle region of the impeller, the slip velocities of the particles of various sizes were small, the particles followed the fluid motion, and the probability of particle–wall collisions was reduced. The situation in the tail region of the impeller was opposite to that in the head region. In this region, the slip velocity was larger for the 1 mm particles, which increased the probability that the particles would collide with the wall.
Wear analysis for the volute
To study the wear trends of various regions inside the volute, beginning with Section 1, regions were marked every 45° within the volute. A total of seven sections were identified. Section 0 was near the tongue, and the rest of the 0–1 section, the tongue, and the diffusion section were divided into 10 different regions along the volute circumference, as shown in Figure 13(a).
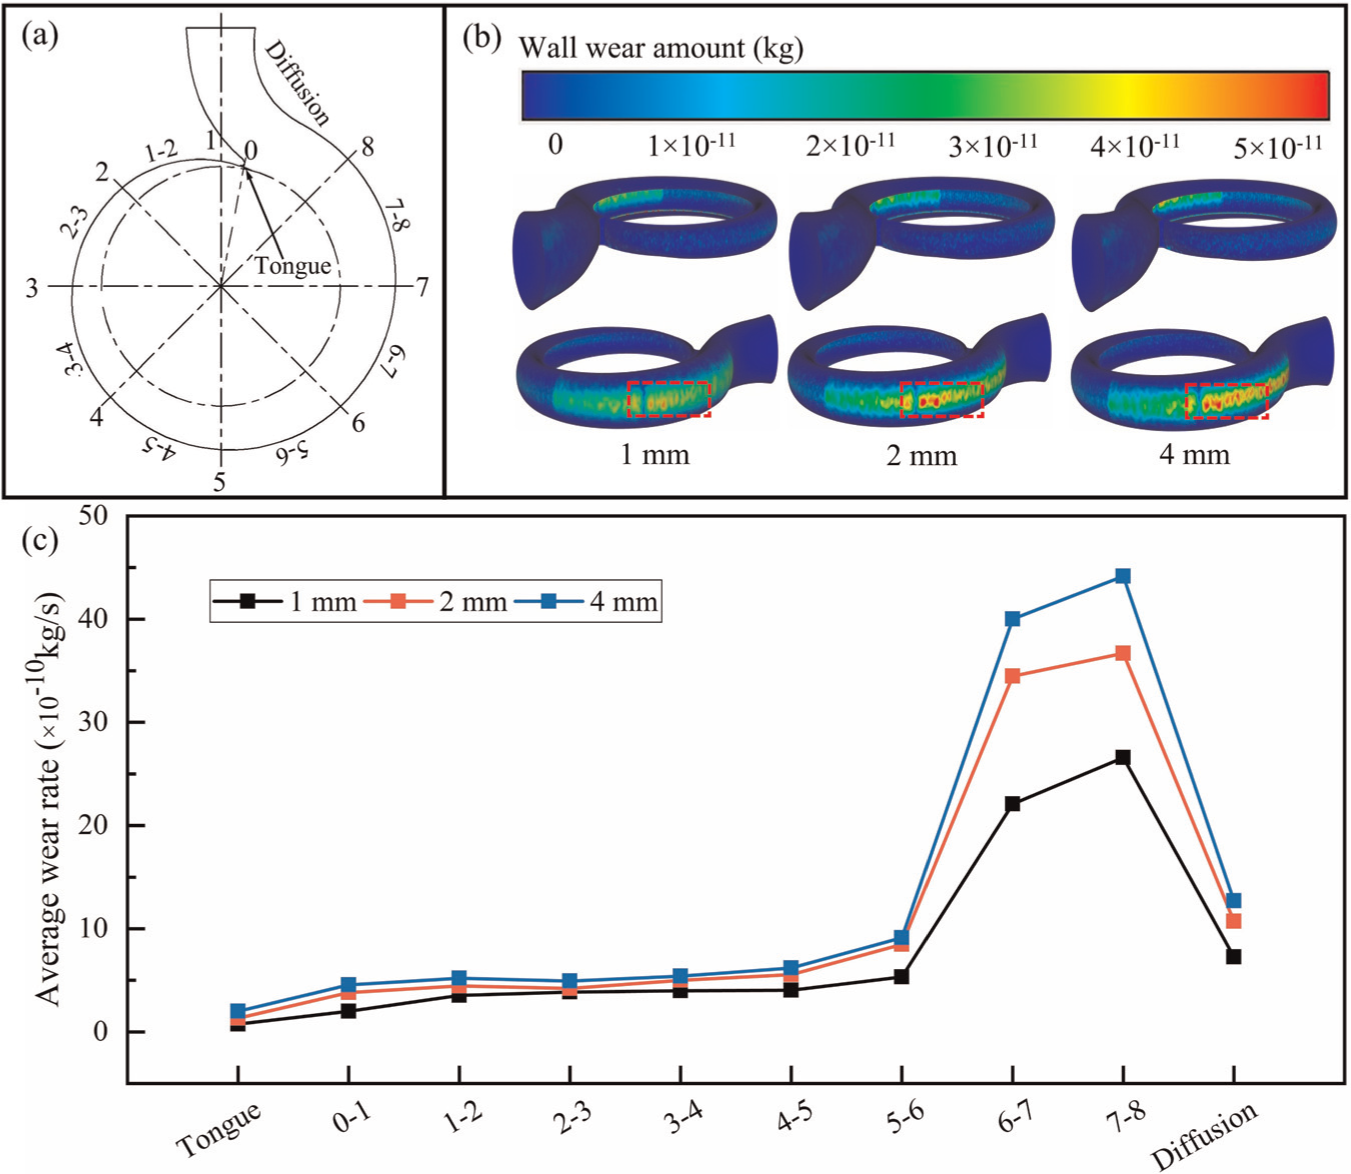
Wear clouds and wear-rate line graph for the volute wall: (a) Volute division diagram, (b) Clouds of volute wear, and (c) Wear-rate of volute division diagram.
Figure 13(b) and (c) present wear clouds and a wear-rate line graph, respectively, for various regions of the volute wall and various particle sizes. Figure 13 shows that, as the particle size increased, the overall wear region on the volute wall expanded and the size of the severe wear region (red region) gradually increased. In addition, the largest wear rates on the volute wall remained at Sections 6–7 and 7–8. The wear rate exhibited a linear relationship with the particle size before Section 6. However, after Section 6, the wear rate first increased from Section 6–7 to the diffusion section, was largest at Section 7–8, and then decreased again to the diffusion section.
The particle collision probability was defined as the average number of collisions between particles and various sections of the volute wall divided by the average number of particles in the computational domain when steady state-flow had been achieved. Figure 14 depicts the particle collision probability of various sections of the volute wall for different particle sizes. For a constant particle size, the collision probability of Section 7–8 section was the largest, followed by that of Section 6–7 and the diffusion section, while the collision probability of the tongue section was the smallest. The collision probabilities obtained for the various particle sizes had similar trends: the collision probability increased gradually from the tongue section to Section 7–8, was largest in Section 7–8, and decreased to the diffusion section. The collision-probability trend was the same as the wear-rate trend.

Particle collision probability for various sections of the volute wall.
Section 6–7, Section 7–8, and the diffusion section of the volute, which exhibited the most severe wear, were specifically analyzed. Figure 15 shows experimental photographs of the wall wear in these regions along with the results of the particle velocity-vector calculations (for 4-mm particles). In Sections 6–7 to 7–8, the particles were aggregated near the wall, the velocity vector was tangent to the wall, and the cutting wear type was dominant. These results can also be seen in the experimental photographs of the wear patterns on the wall in the flow direction. The wear degree was smaller in the diffusion section than in the other two sections. The particle velocity-vector plots show that the particles advanced in a helical line; this result also corresponds to the residual paint traces that can be seen in the experimental photographs.

Wear analyses of volute regions with severe wear.
Conclusions
(1) By introducing particle mass characteristics into the E/CRC wear model, a mass-modified model was constructed and experimentally validated for applicability. The results showed that the modified model can accurately predict regions of severe wear and effectively improve the calculation accuracy of wall wear during solid-liquid transport of large particles.
(2) The centrifugal pump exhibited relatively consistent distribution patterns of maximum and average wear rates across its various regions, though large differences existed between the maximum and average wear rates in the same region. Compared with other flow-passing components, the suction surface of the blades, the front and rear wear-resistant plates, and the diffusion section showed almost no wear. The working surface of the blades is the region with the most severe wear, but the wear on the volute was also quite severe.
(3) The inertial differences between particles of different sizes result in different degrees of fluid followability, which causes variations in the number of collisions between particles in different regions, leading to differences in the degree of wear. Large particles collide more frequently in the front half of the blade working surface, while small particles collide more frequently in the rear half; this phenomenon is caused by the relative slip velocity between particles and fluid.
(4) The consistency between the regions with severe wear and the regions with significant particle kinetic energy losses indicated that the wear occurred when the kinetic energy of the particles that collided with the wall was transformed into wall deformation energy. Then, when the deformation increased to a certain extent, the wall material peeled off and wear was exhibited. Changes in particle size significantly affect the wear region and degree of wear on the wall surface: as particle size increases, the wear region expands.
Footnotes
Handling Editor: Divyam Semwal
Funding
The authors disclosed receipt of the following financial support for the research, authorship, and/or publication of this article: This work was supported by the National Key R&D Program of China (Grant No. 2022YFE0126600), the Key Research and the Development Program of Zhejiang Province (Grant No. 2025C01085), and the National Natural Science Foundation of China (Grant No. 52222601 and No. U22A20209).
Declaration of conflicting interests
The authors declared no potential conflicts of interest with respect to the research, authorship, and/or publication of this article.