
Abstract
Gas–solid flows are widely found in various industrial processes, e.g. chemical engineering and sand ingestion test for aero-engine; the interaction between continuum and discrete particles in such systems always leads to complex phase structures of which fundamental understandings are needed. Within the OpenFOAM, the present work uses the discrete element method combined with the computational fluid dynamics to investigate the gas–solid flow behaviors in a dense fluidized bed under various conditions. A drag law which is for polydisperse systems derived from lattice Boltzmann simulations is incorporated into the computational fluid dynamics-discrete element method framework and its suitability for different flow regimes is investigated. The regimes including, namely slugging bed, jet-in-fluidized bed, spout fluidization, and intermediate, are simulated and validated against experiments. The results show that the lattice Boltzmann drag relation performs well in capturing characteristics of different gas–solid flow regimes. Good agreements are also obtained quantitatively by comparisons of pressure drop fluctuation, and time-averaged gas velocity and particle flux.
Introduction
Gas–solid flows combine a thorough contact between solid particles and fluids and are widely found in a large variety of industrial processes, e.g. chemical, metallurgical, and pharmaceutical industries. The gas–solid interaction dominates the process in such particulate systems and modeling of the particulate flows has become more and more popular in recent years. In sand ingestion test for aero-engine, the velocity varies in a large scale, which impels us to investigate the suitability of the present numerical method for gas–solid flows in a wide range of flow regimes.
From a macroscopic viewpoint, the solid phase in reactors with dense particles sometimes behaves like a kind of fluid. Great progress has been made for modeling such systems with two main approaches, in which the two-fluid model (TFM)1,2 and the discrete element method (DEM)3,4 are the two most well-known approaches. The TFM treats both the gas and solid as continua solved on a spatially fixed mesh, i.e. based on the Eulerian–Eulerian approach. One major drawback is that empirical relations are needed to describe the constitutive behavior of particles, which makes it impossible to accurately evaluate the solid stress.5–7 On the other side, the DEM, in which the powder behavior is fully resolved in a Lagrangian frame of reference, has been widely employed in gas–solid systems to capture the detailed microscopic dynamic information for the fundamental understanding. The DEM was first proposed by Cundall and Strack 3 using the soft sphere collision model. Tsuji et al.4,5 combined the DEM with a finite volume description of gas based on the Navier–Stokes equations. The approach has proven to be a versatile tool for dense gas–solid flows such as that in fluidized beds as seen in the reviews by Deen et al., 8 Goldschmidt et al., 9 and Ibsen et al. 10 The investigation of gas–solid behaviors using computational fluid dynamics (CFD) and DEM was also carried out for many other processes, such as blast furnace,7,11,12 circulating fluidized bed,13,14 rotary drum,15,16 cyclone separator, 17 etc.18–21
The drag force plays a dominating role in capturing the characteristics of gas–solid flows. The drag law used most frequently was proposed by Gidaspow, 22 which is a combination of the empirical equation by Ergun 23 for low porosities and the drag correlation by Wen and Yu 24 for high porosities. Goldschmidt et al. 25 and Bokkers et al. 26 showed that, for binary or polydisperse systems, the traditional drag models need to be modified. Link et al. 27 investigated the performances of three drag laws of Gidaspow, 22 Koch and Hill 28 and minimum of Ergun 23 and Wen and Yu 24 relations in a spout-fluidized bed and pointed out that the modified drag law and the Koch and Hill 28 relation derived from lattice Boltzmann (LBM) simulations were more suitable. Van der Hoef et al. 29 and Beetstra et al. 30 pointed out that the drag force on particles in a mixture is indeed different from that on the same particles in a monodisperse system with the same porosity and Reynolds number using LBM simulations and proposed new drag relations. Li et al. 31 embedded new LBM drag relations into the open source CFD-DEM framework in OpenFOAM and investigated their performances in several aspects of gas–solid flows; nevertheless, the flow regimes were not totally taken into account.
The motivation of the present work is to make a thorough investigation of the gas–solid flow regimes in a dense fluidized bed using the algorithm proposed by the previous work. 31 The drag law for polydisperse systems proposed by Van der Hoef et al. 29 from LBM simulations is combined with the finite volume method (FVM) for the two-way coupling of gas and solid. The flow regimes including, namely, slugging bed, jet-in-fluidized bed, spout fluidization, and intermediate proposed by Link et al., 27 are simulated and compared with experiments. The results show that the LBM drag relation performs well in capturing characteristics of spout-fluidization regime including pressure drop fluctuation, and time-averaged gas velocity and particle flux. Furthermore, the characteristics of other flow regimes are also well predicted indicating the suitability and accuracy for predicting gas–solid behaviors in different flow regimes.
Model description
CFD-DEM model
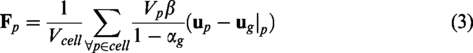
The present model treats the gas as continuum in a fixed or Eulerian frame of reference. The volume-averaged conservation equations for mass and momentum are written as follows


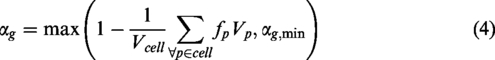
The translational and rotational motions of each individual particle with mass
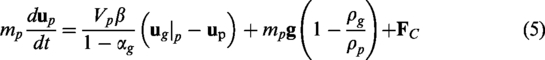
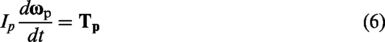


More details about the modeling of contact forces can be found in Tsuji et al., 4 Li et al., 31 and Li and Li. 33
Momentum exchange coefficient
As the two phases are computed in different references, the momentum exchange for two-way coupling of gas and solid is vitally important. A proper drag law for description of the momentum exchange coefficient
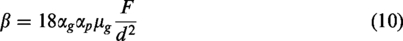


The difference between the new drag law and the popular Gidaspow 22 drag law is shown in Figure 1, which illustrates that the new drag law prevents the discontinuity which may cause numerical instabilities. The Gidaspow 22 drag law is found to overestimate the drag force in the annulus and underestimate that in the spout which results in the inappropriate behaviors in the spout-fluidization flow regime in spout-fluidized beds.27,31 Moreover, we also found that the Gidaspow 22 drag law will overpredict the bubble size in a dense packed bed with a single bubble injected from a central jet. The comparison between simulations and experiment is shown in Figure 2, where the experimental images are from Bokkers. 34
Momentum exchange coefficient evolutions along with the porosity.
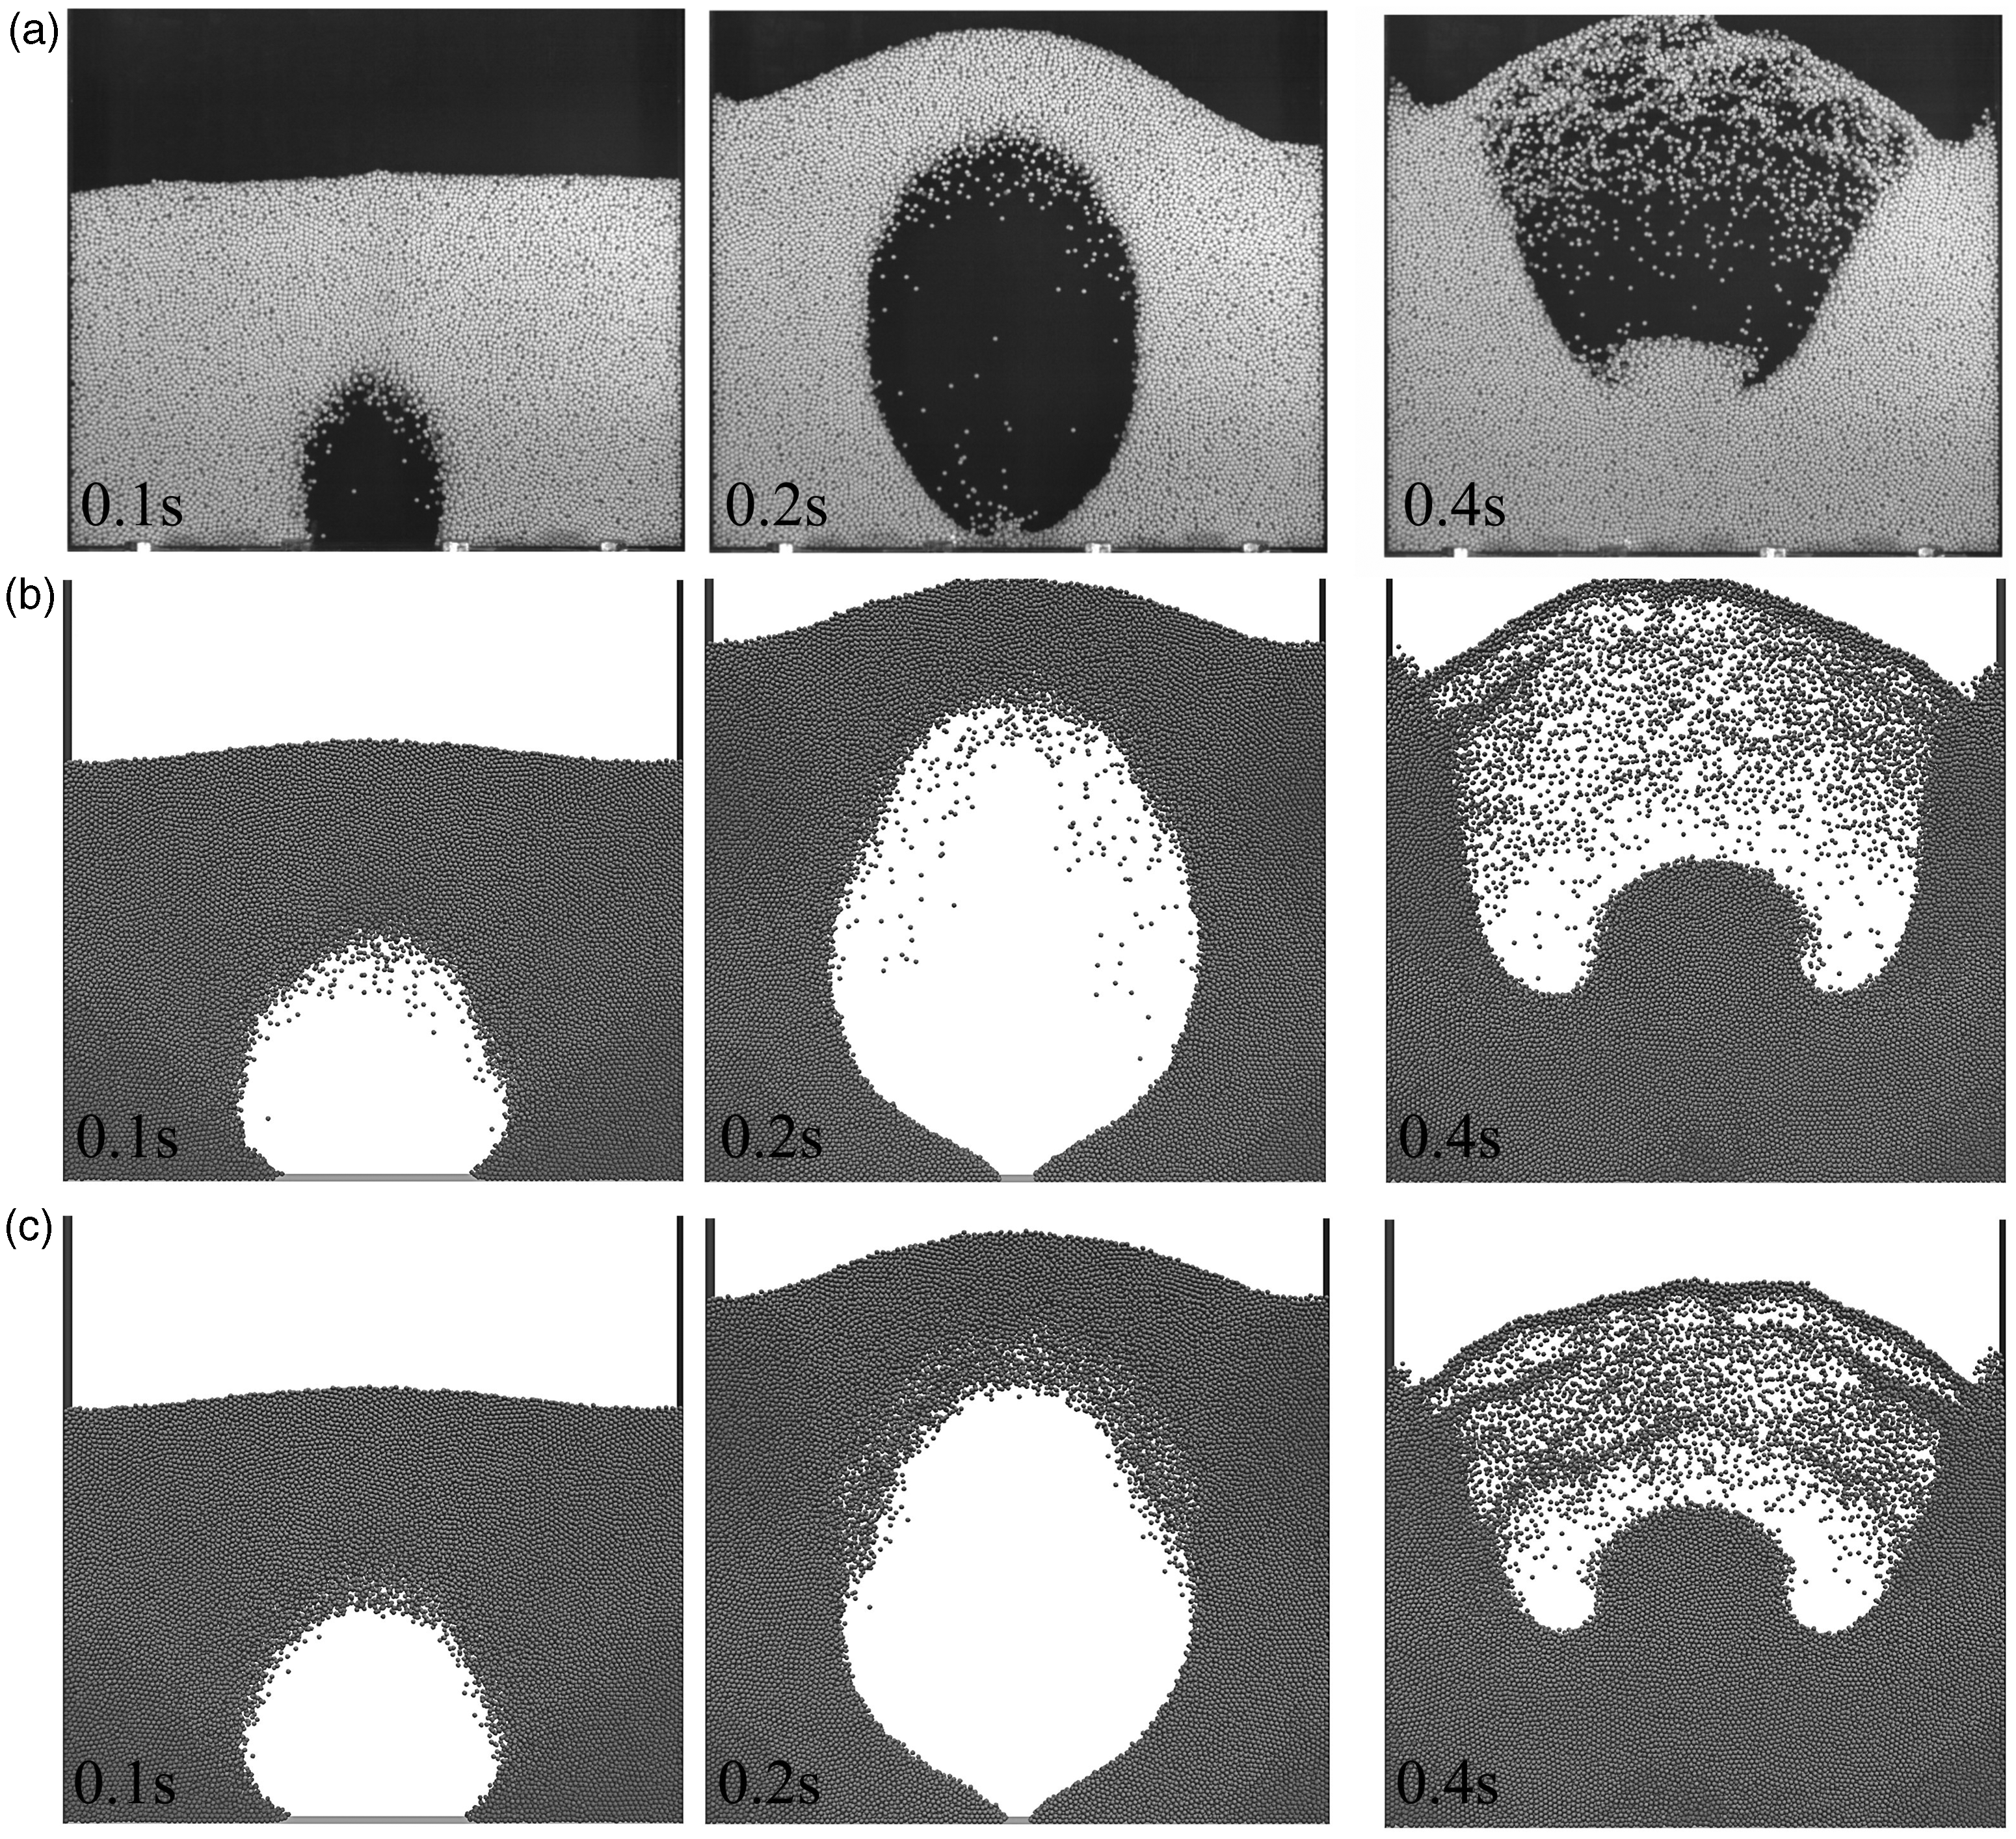
Single bubble behaviors in a packed bed in the (a) experiment 34 and simulations using (b) Gidaspow drag law, and (c) Van der Hoef drag law.
Numerical details
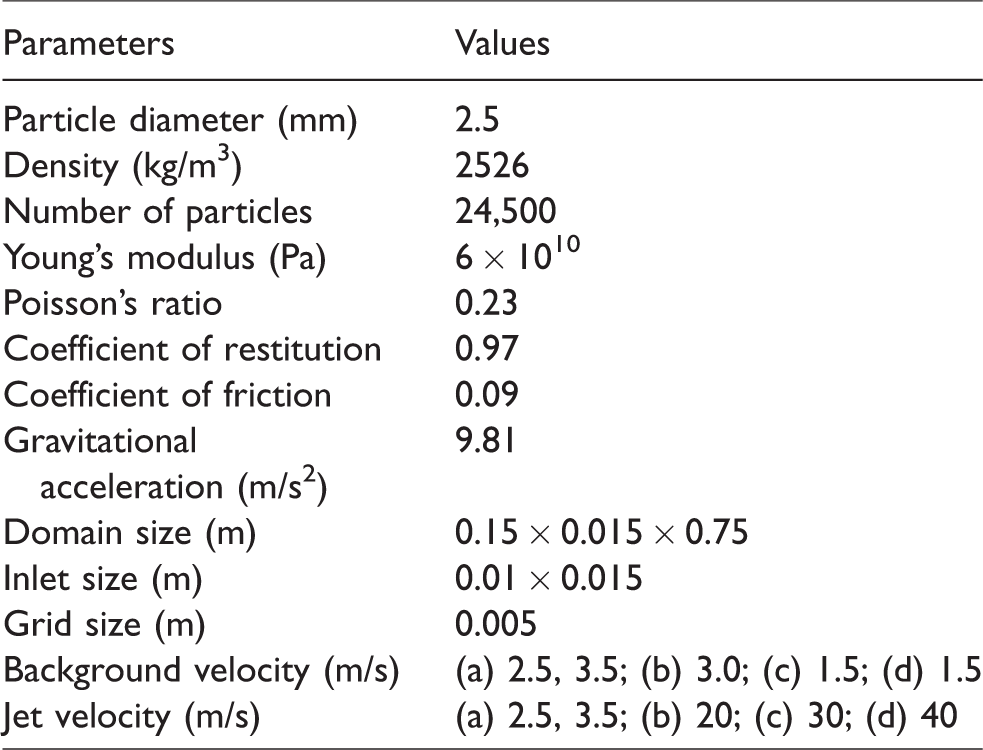
The simulations in the present work are performed for comprehensive gas–solid flow regimes in a spout-fluidized bed to investigate the capability of the present model for describing different gas–solid behaviors. The details of the geometric parameters for the bed and the material properties are shown in Table 1. A uniform mesh size is used and the determination of mesh size can be found in our previous work. 31 The numbers of cells and nodes are 4500 and 9362, respectively. Gas is injected into the bed from both the bottom and the central inlet on the bottom. The conditions with different background velocities and inlet velocities in Table 1 are, respectively, referred to (a) slugging bed, (b) jet-in-fluidized bed, (c) spout-fluidization regime, and (d) intermediate-flow regime.
Parameters for simulations.
The equations of gas and particle motion including their coupling and particle interactions via collisions and endured contacts are solved using the FVM based open source package OpenFOAM-3.0.1. For the pressure–velocity coupling, the PIMPLE algorithm which is a merged version of the widely used SIMPLE and PISO methods is used. The time step is limited by both gas and particle sides. For the gas, the Courant number is defined as

Results and discussion
Slugging bed
In slugging-bed regime, all particles are moving and slugs are formed. In the work by Link et al., 27 the snapshots of the slugging-bed regime in the beginning from 0 to 0.8 s were provided with the condition that the background velocity and inlet velocity are both 3.5 m/s. The condition is carried out in the present simulation and the snapshots from 0 to 0.8 s are compared with the experimental images in Figure 3. The initial state is set up with 24,500 particles with a diameter of 2.5 mm, the bed height is about 0.15 m. The snapshots show that a large slug is formed, propagated, and then crumbled, which will lead to huge pressure drop fluctuations. As the details of this regime were not discussed, so we have just compared the macro phenomena.
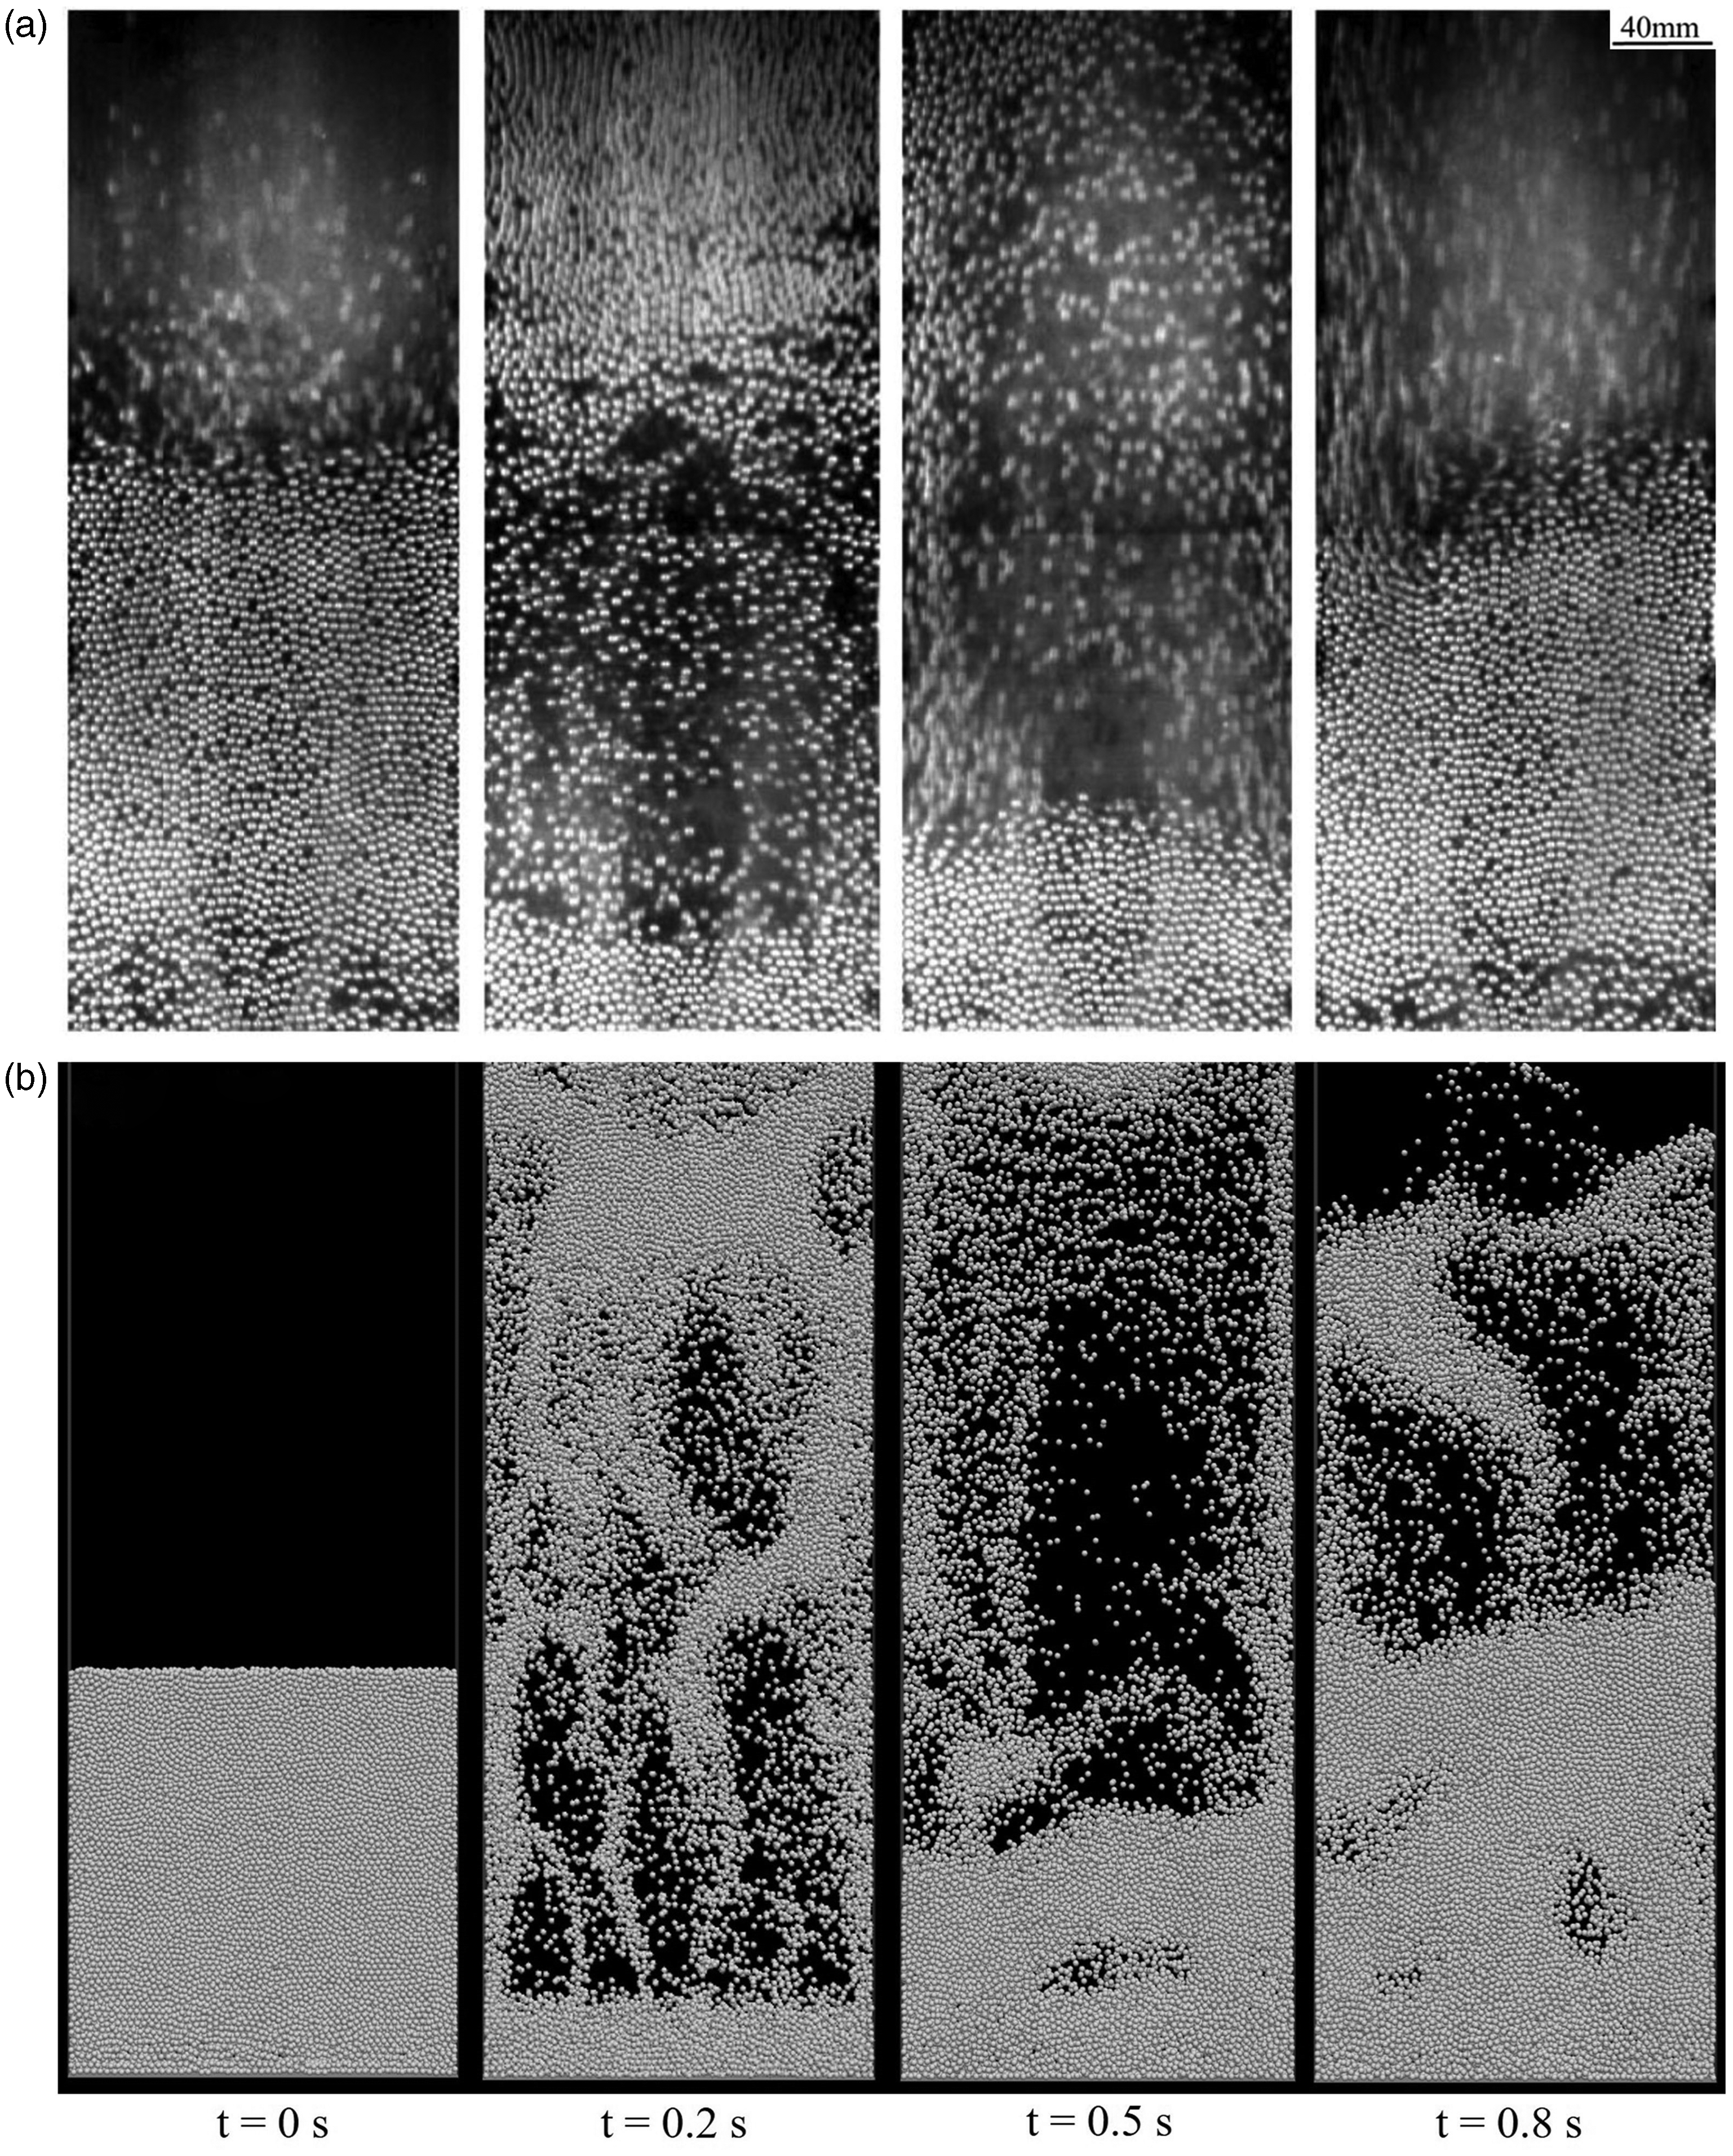
The initial slug forming and collapsing captured by the (a) experiment 27 and the (b) present simulation.
Experiments using the same bed were also carried out by Goldschmidt et al. 9 A condition with the background velocity and inlet velocity equal to 2.5 m/s, of which the behaviors also belong to the slugging bed, is also simulated in the present work. The snapshots from the simulation indicating the slug collapsing and forming with an interval of 0.15 s are shown in Figure 4, where Figure 4(a) shows the previous slug is collapsing and the particles in the upper region are falling down. Then a new slug in the lower part forms and grows as seen in the following pictures. The status that the slug has the maximum size is shown in Figure 4(c) and compared with the experimental image 9 in Figure 4(d). The results show qualitative agreements for the gas–solid behaviors in slugging-bed flow regime.
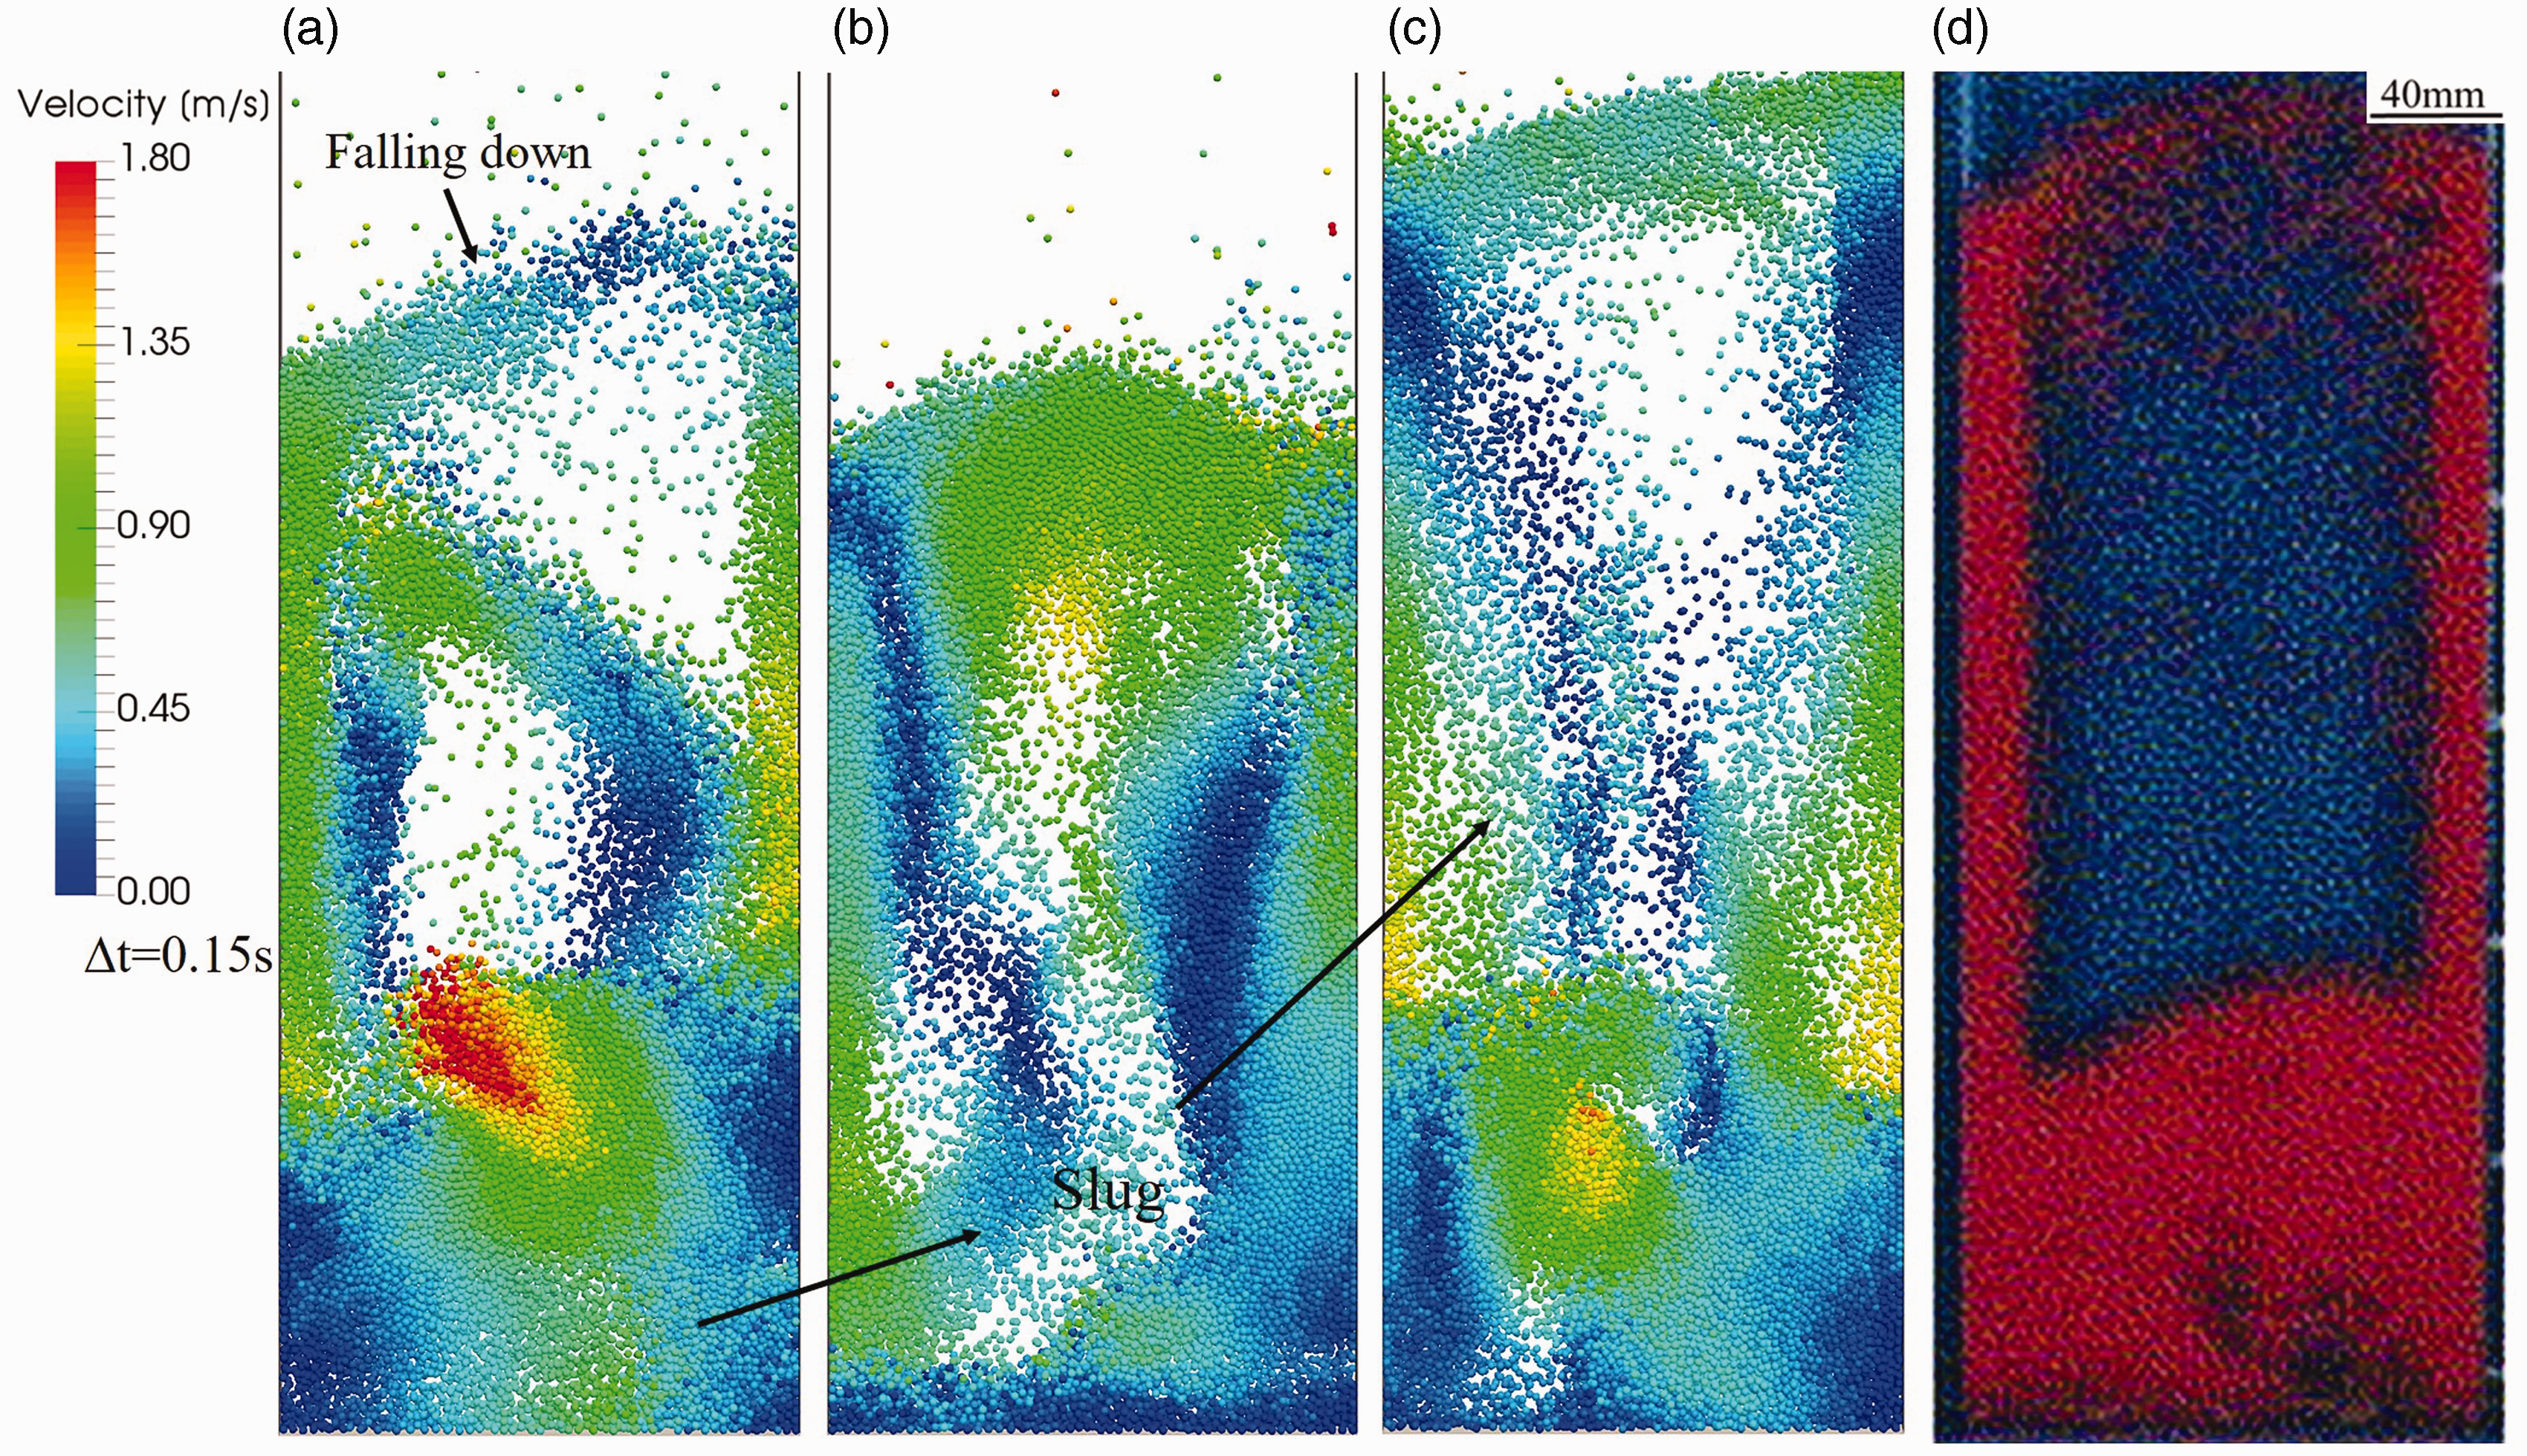
The gas–solid flow behaviors in a slugging bed: (a)–(c) compared with the (d) experiment. 9
Jet-in-fluidized bed
In the second simulation, the jet-in-fluidized bed regime is performed. Figure 5(a) shows a snapshot of the experiment 27 with the condition that the background velocity is 3 m/s and the inlet velocity is 20 m/s. The transient flow patterns in the simulation are shown in the following pictures. It is found that bubbles are continuously formed and transport to the upper part of the bed. A spout channel off center is presented and causes particles to move in vortices. The channel is also quite unstable and swings randomly from one side to the other again and again. Thus, the gas–solid behaviors in jet-in-fluidized bed regime are also called meandering spout. The snapshots from Figure 5(b) to (g) at different moments continuously show the swinging of the spout channel.
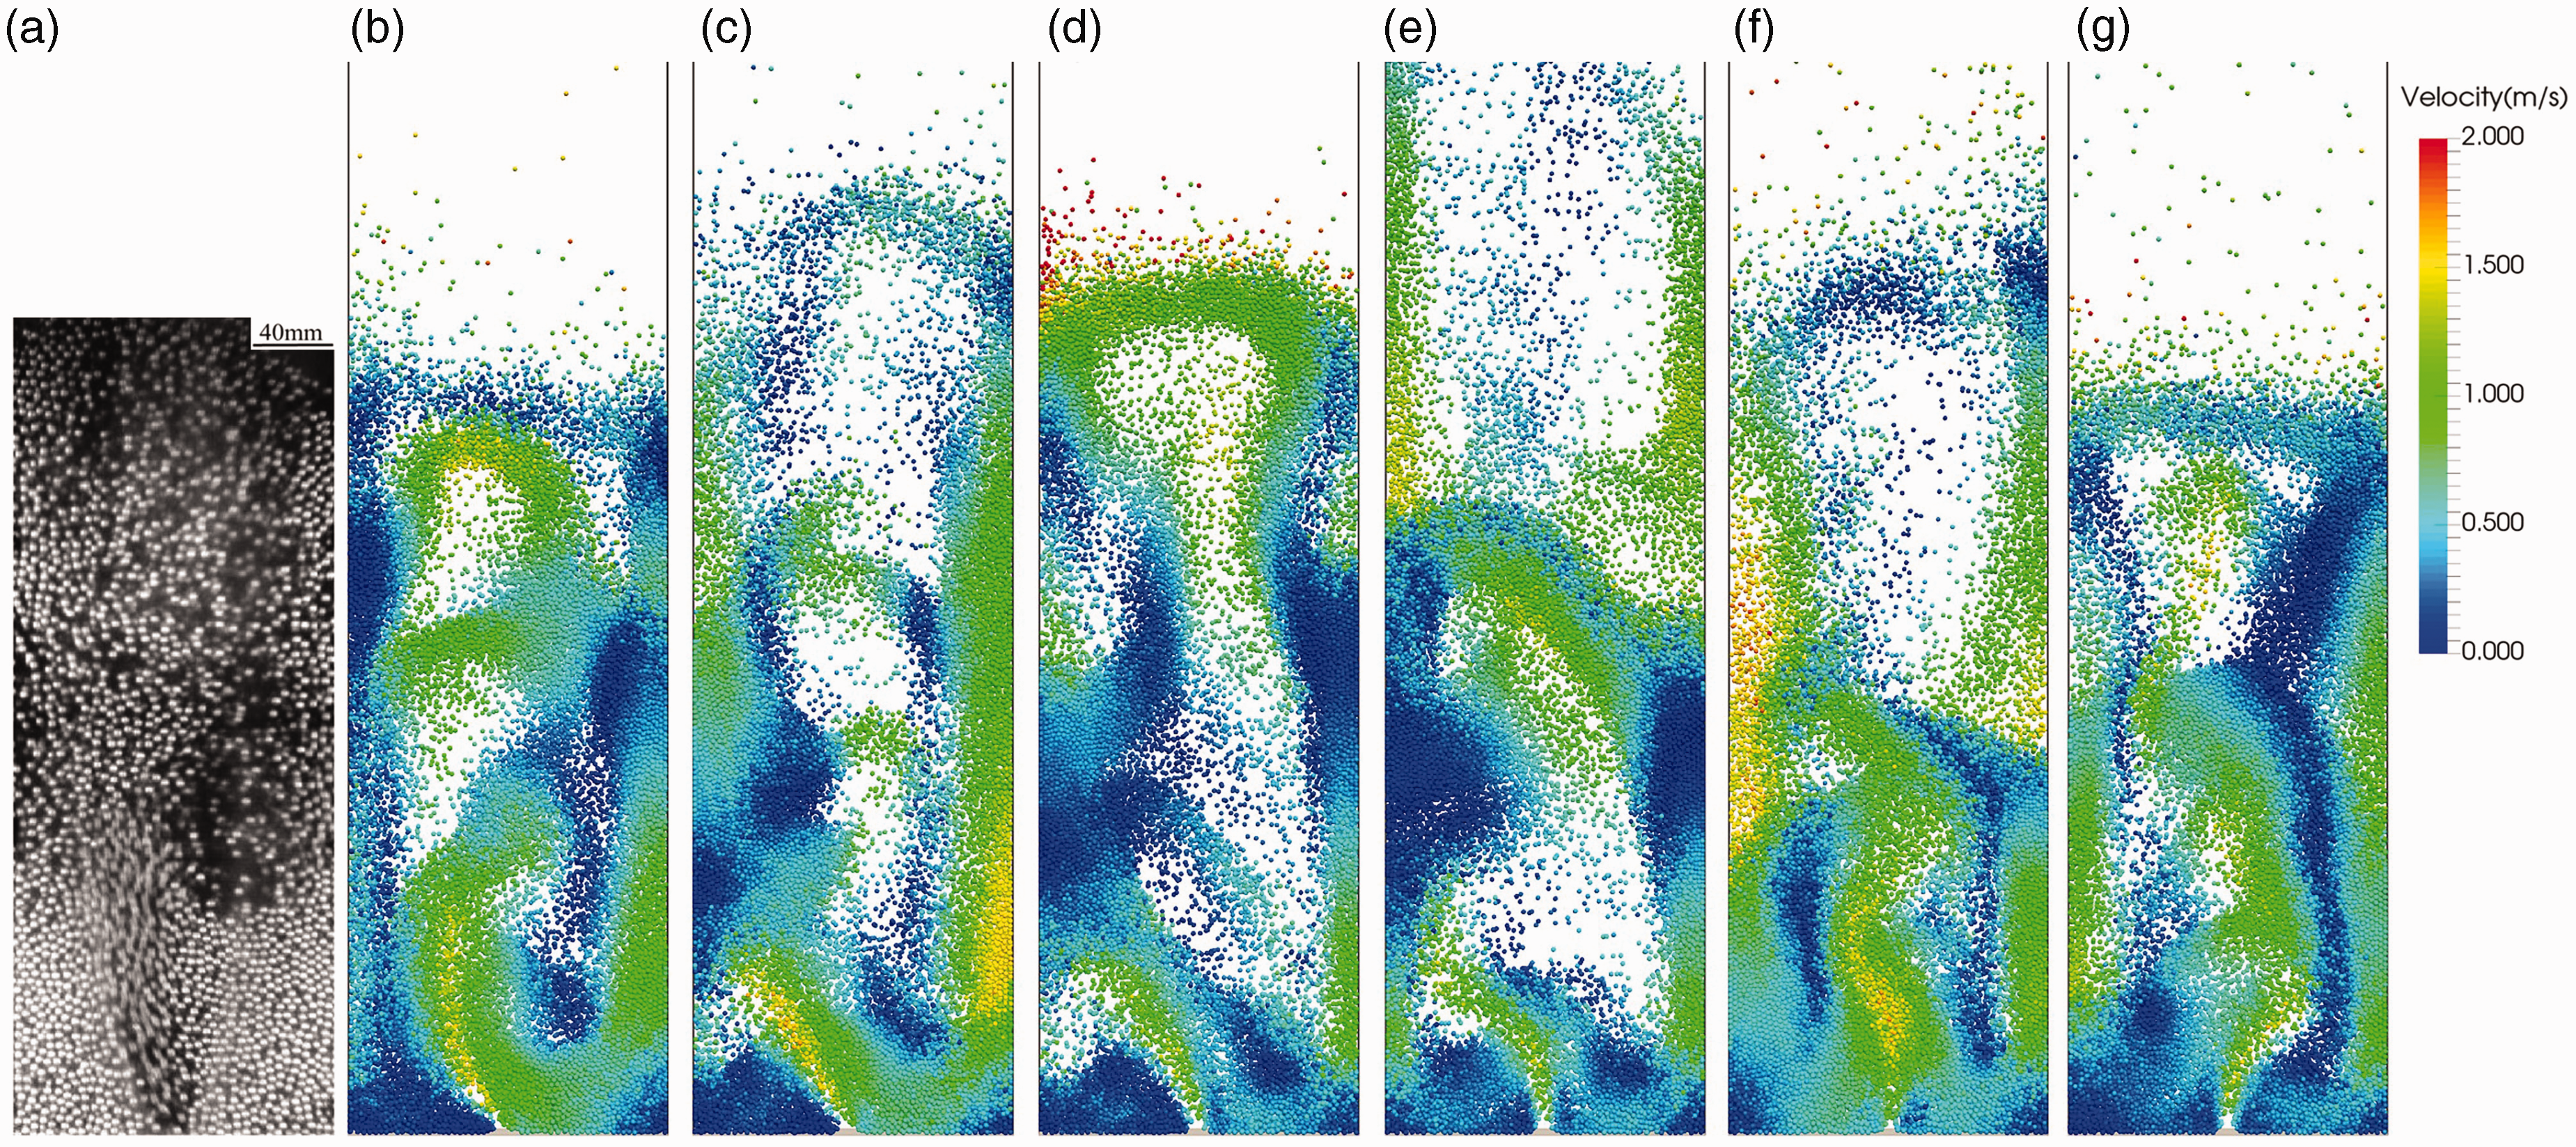
The flow patterns in the (a) experiment 27 and (b)–(g) simulation.
Figure 6 shows the pressure drop fluctuation of the simulation in this regime. The peaks with high pressure drops are the moments that the channel is blocked by particles. The fluctuation is quite irregular but its pattern and range are very similar to the previous result.null The velocity profiles of gas along with the particle distributions at different statuses are shown in Figure 7. The statuses differ from each other in the flow direction, in which Figure 7(a) is in clockwise direction and Figure 7(c) is in counterclockwise direction. To get a quantitative analysis, the time-averaged vertical gas velocity and particle flux captured in the present simulation are compared with the previous simulation 27 using the Koch and Hill 28 drag relation in Figure 8. The results are plotted over the line 0.15 m above the bottom. In the curve of time-averaged gas velocity, two peaks are found at the positions of nearly x = 0.05 m and x = 0.10 m because the jet swings from one side to the other alternately. On the other hand, the curve of particle flux shows that particles transport upward in the center of the bed and drop in the two sides. The comparison indicates that the present results for the jet-in-fluidized bed regime agree well with the previous results 27 qualitatively and quantitatively.
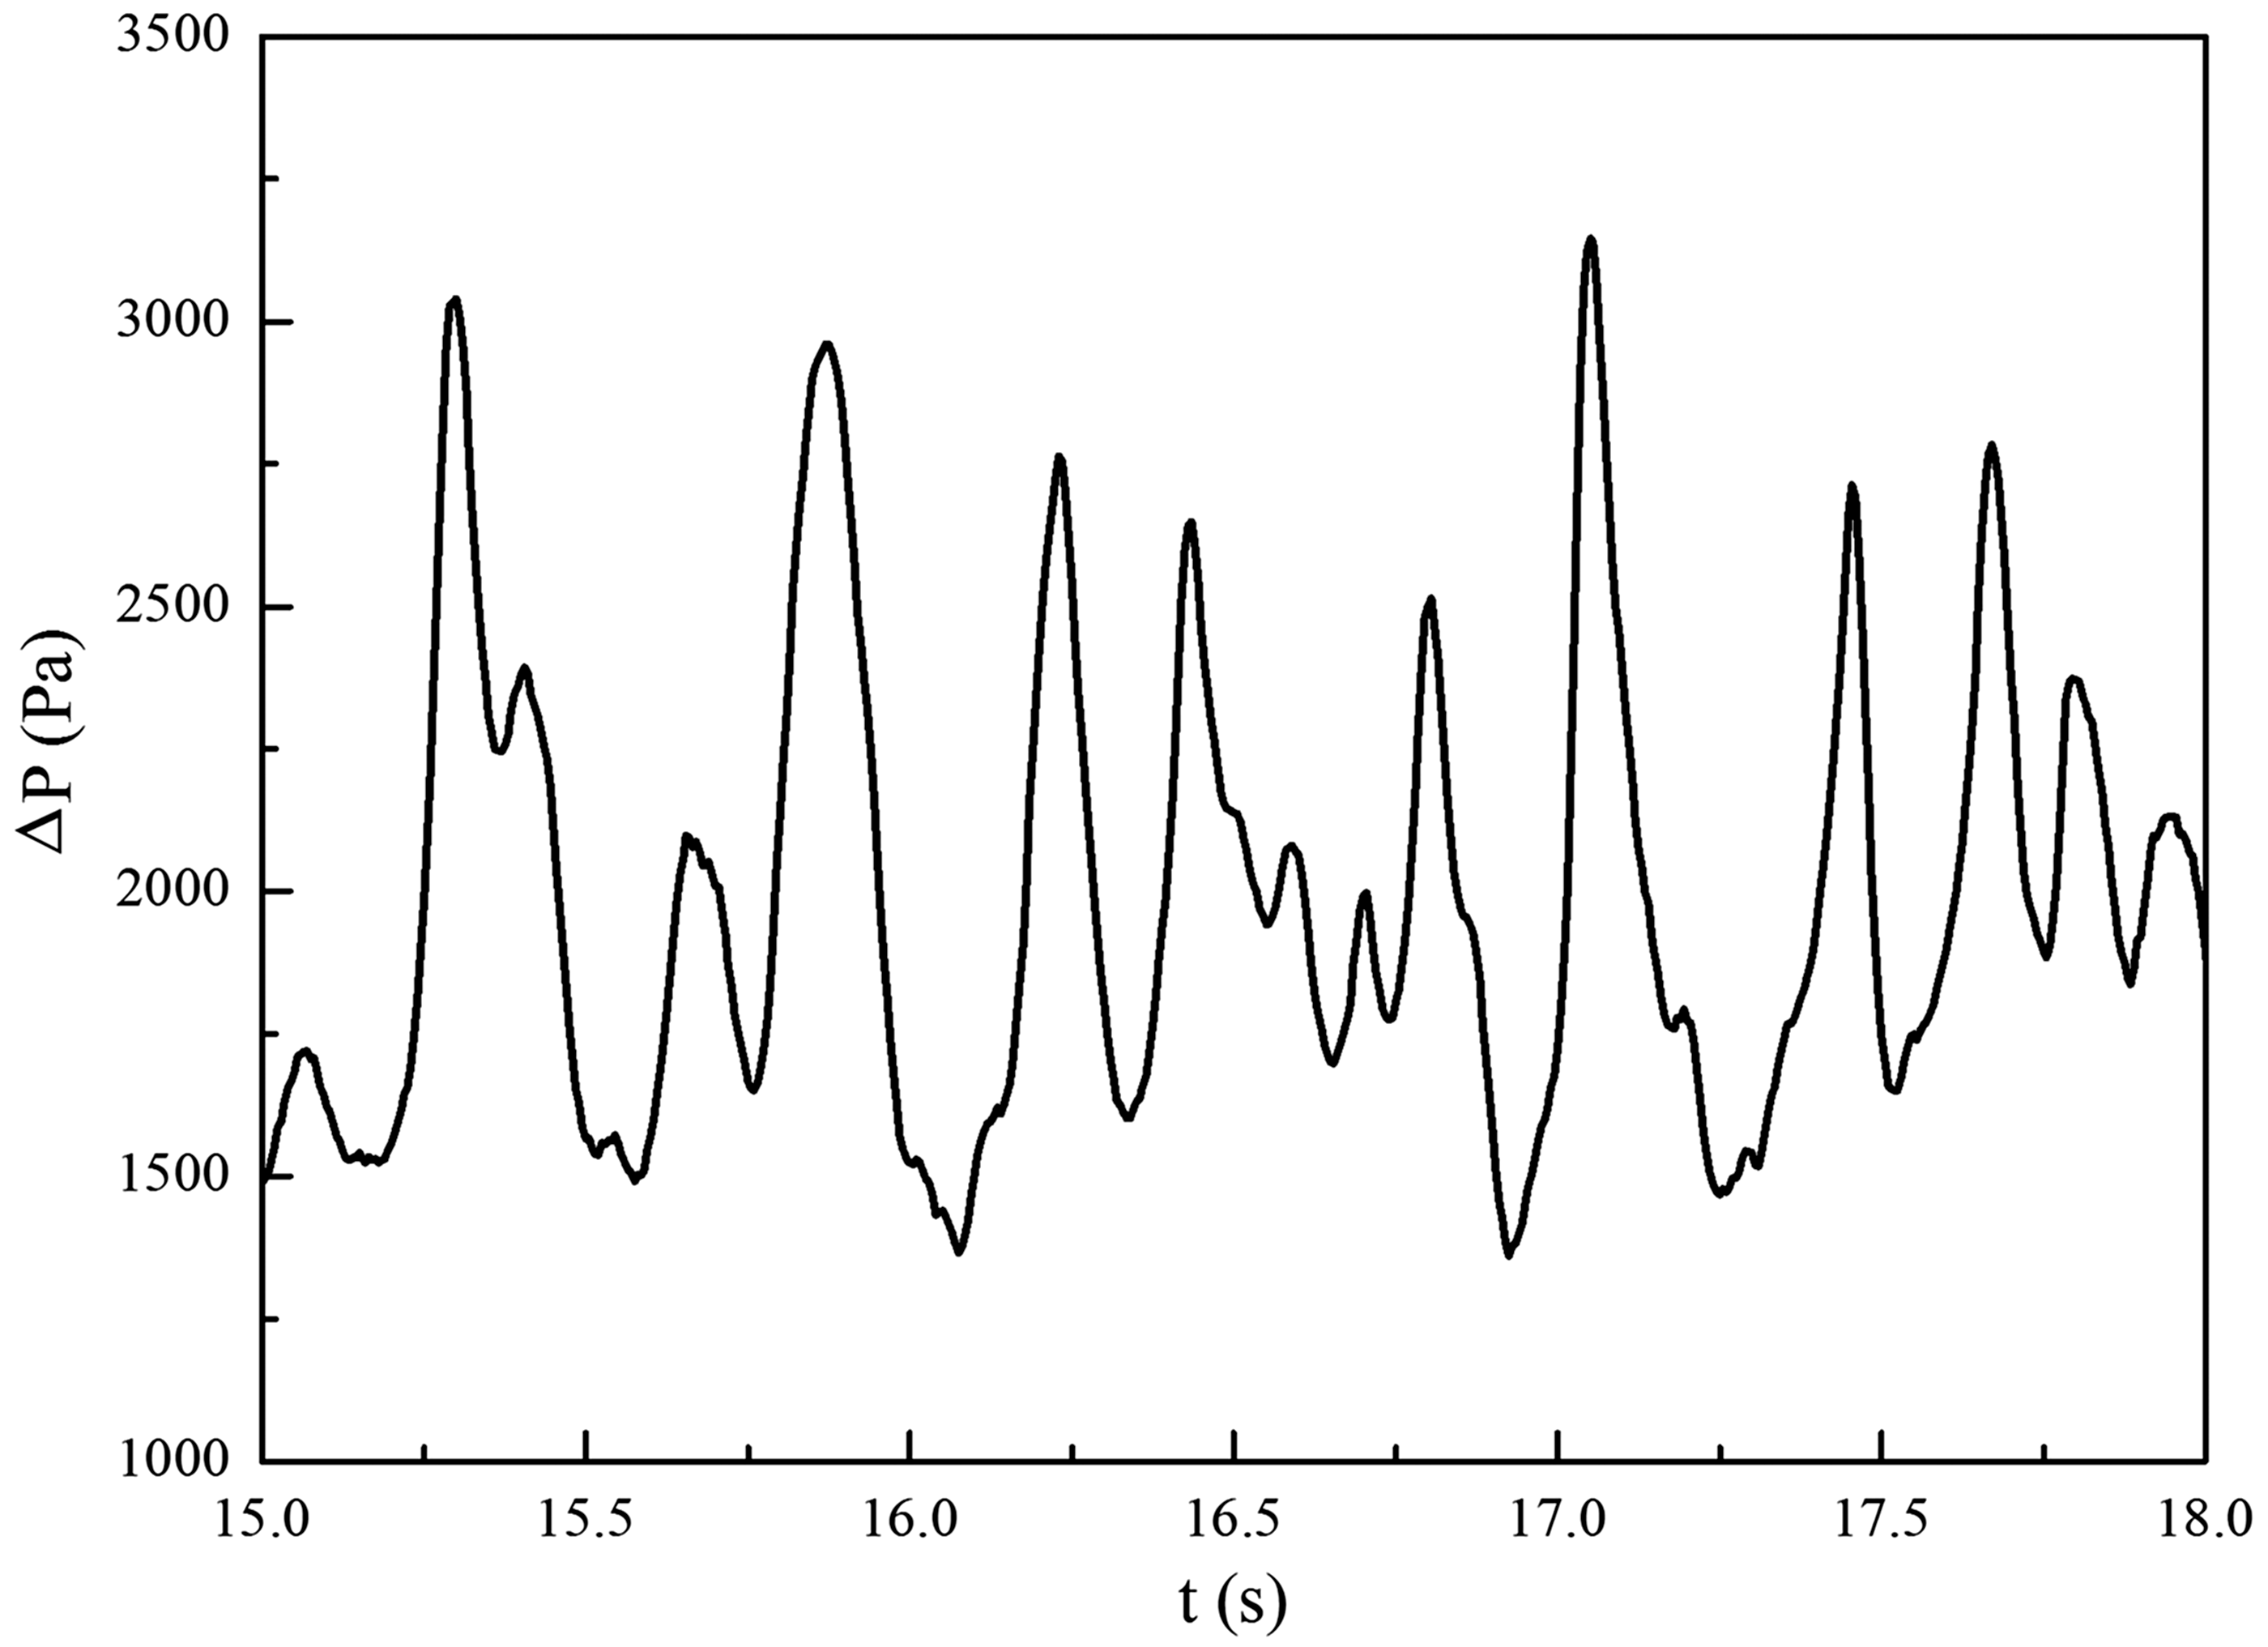
Pressure drop fluctuation in jet-in-fluidized bed regime.
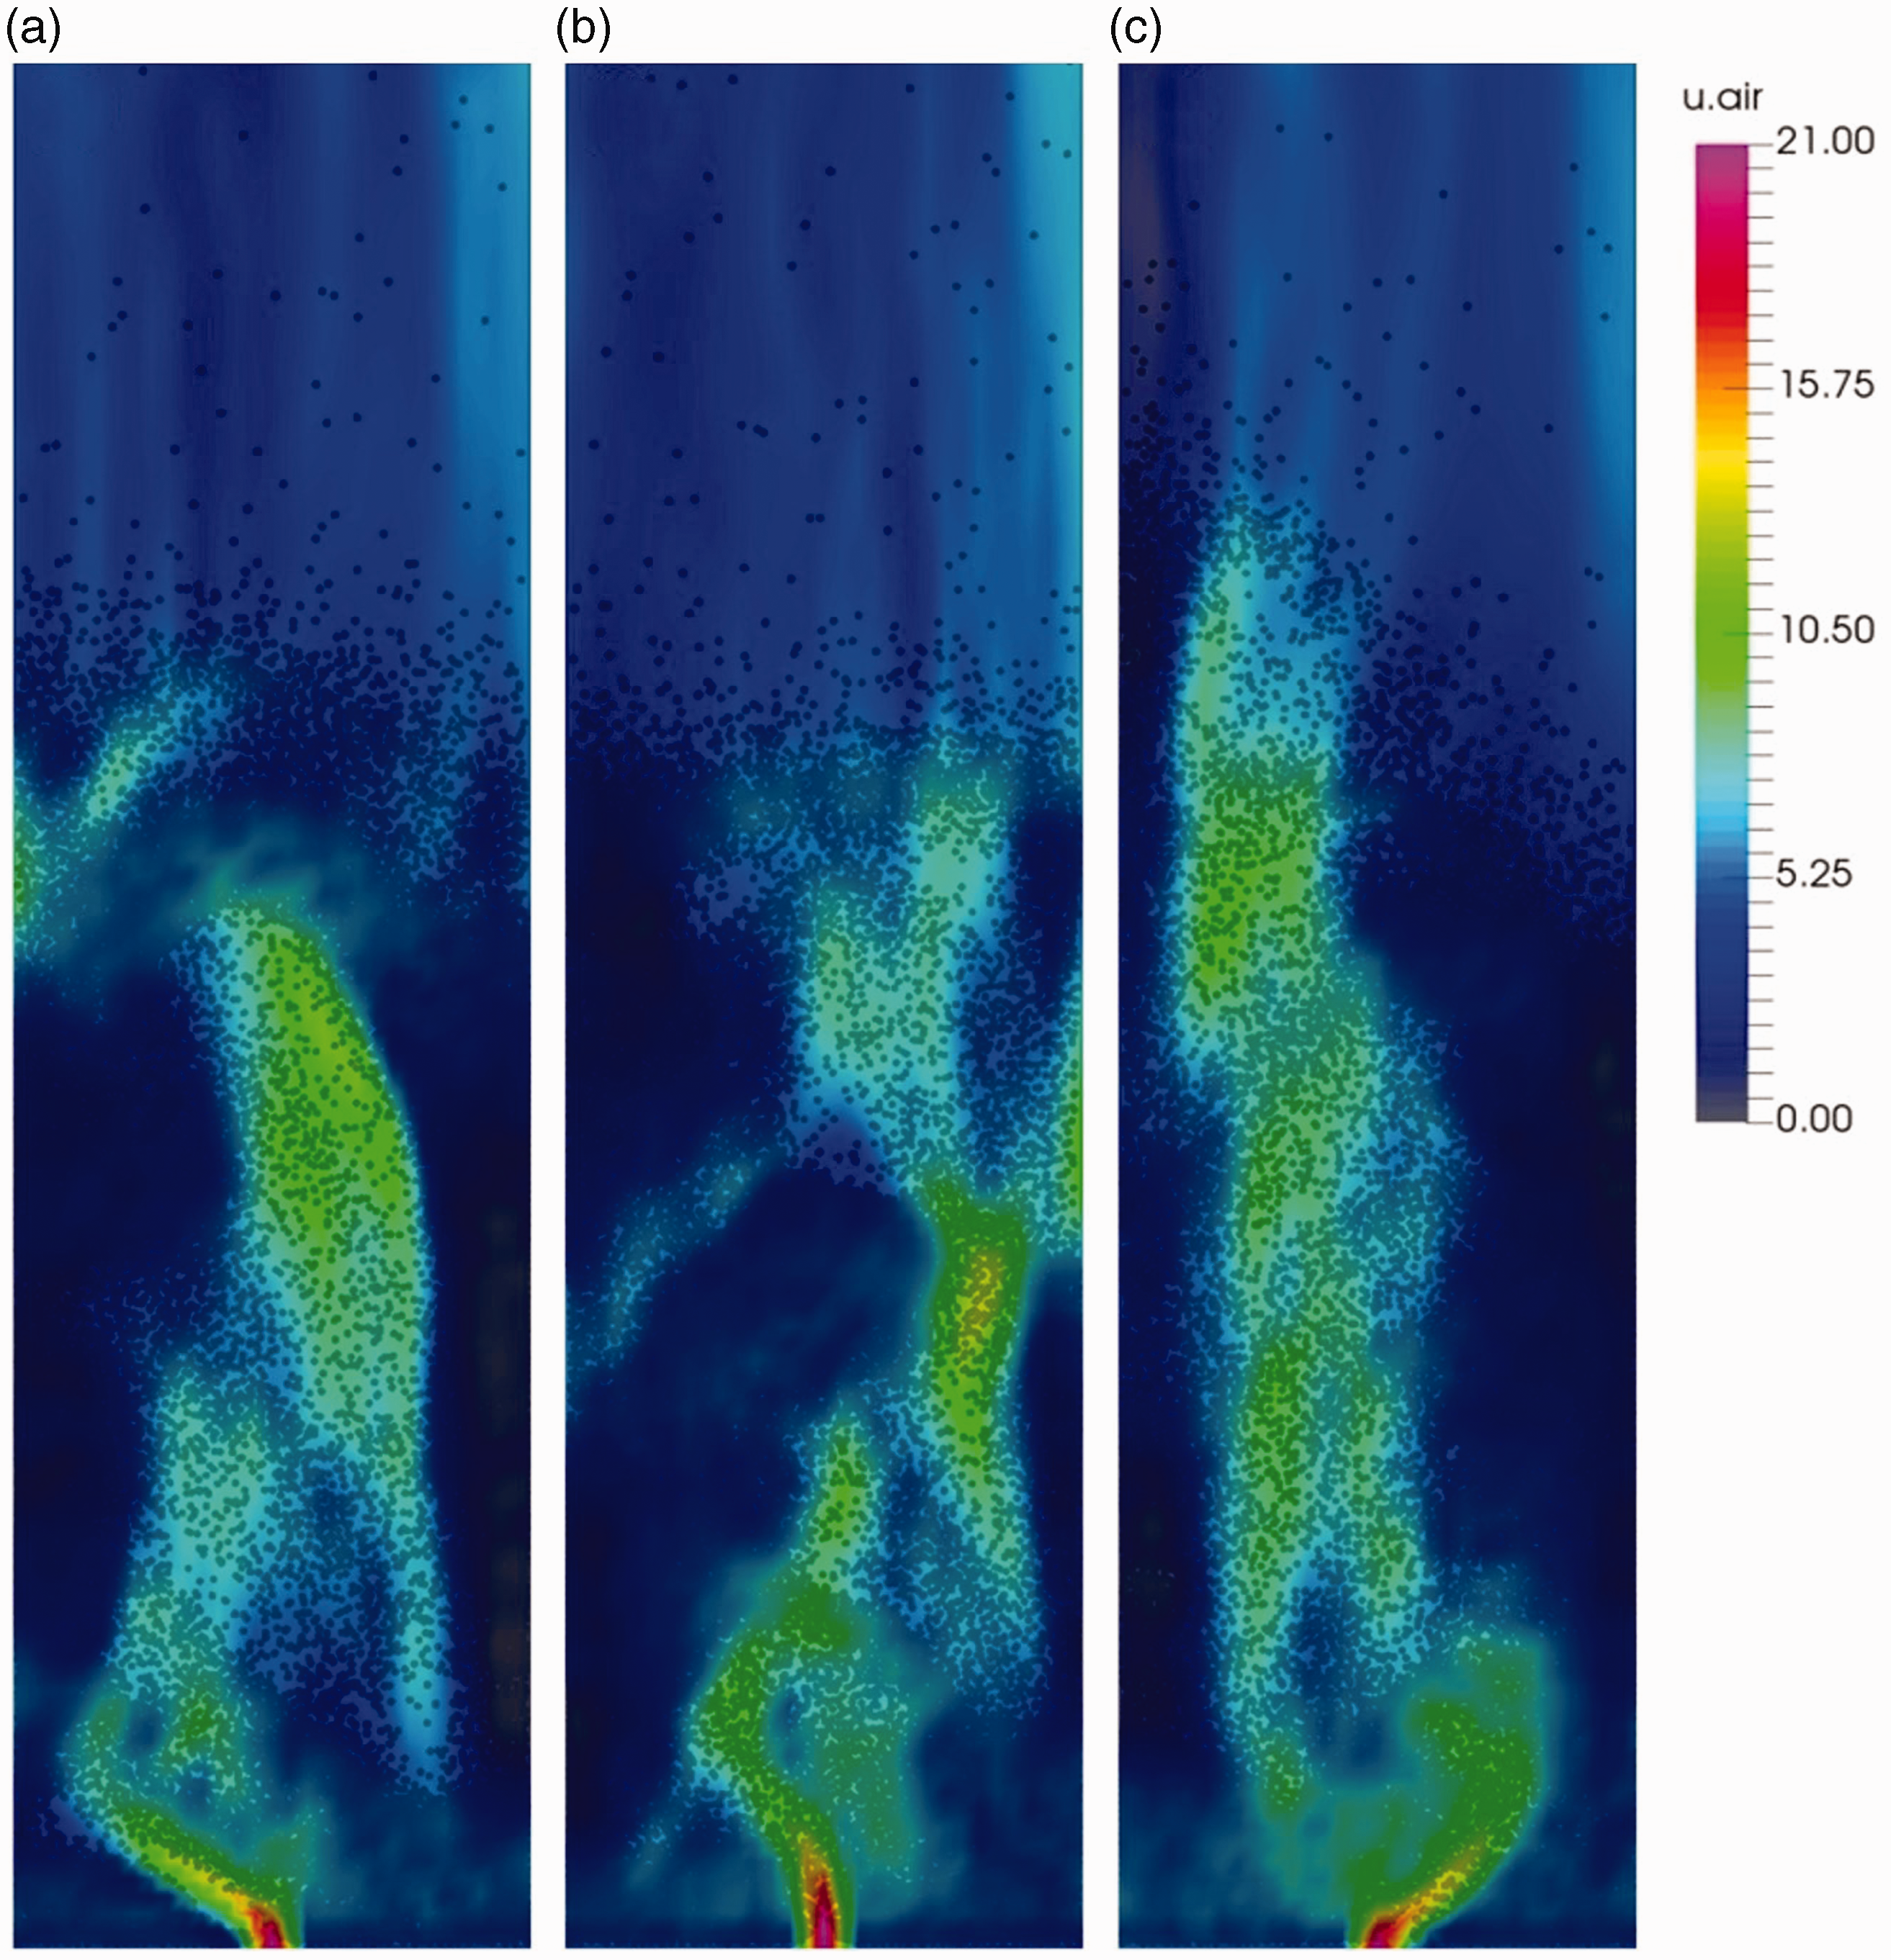
Gas velocity along with particle distribution at different statuses (a) jet on the left, (b) in the center, and (c) on the right.
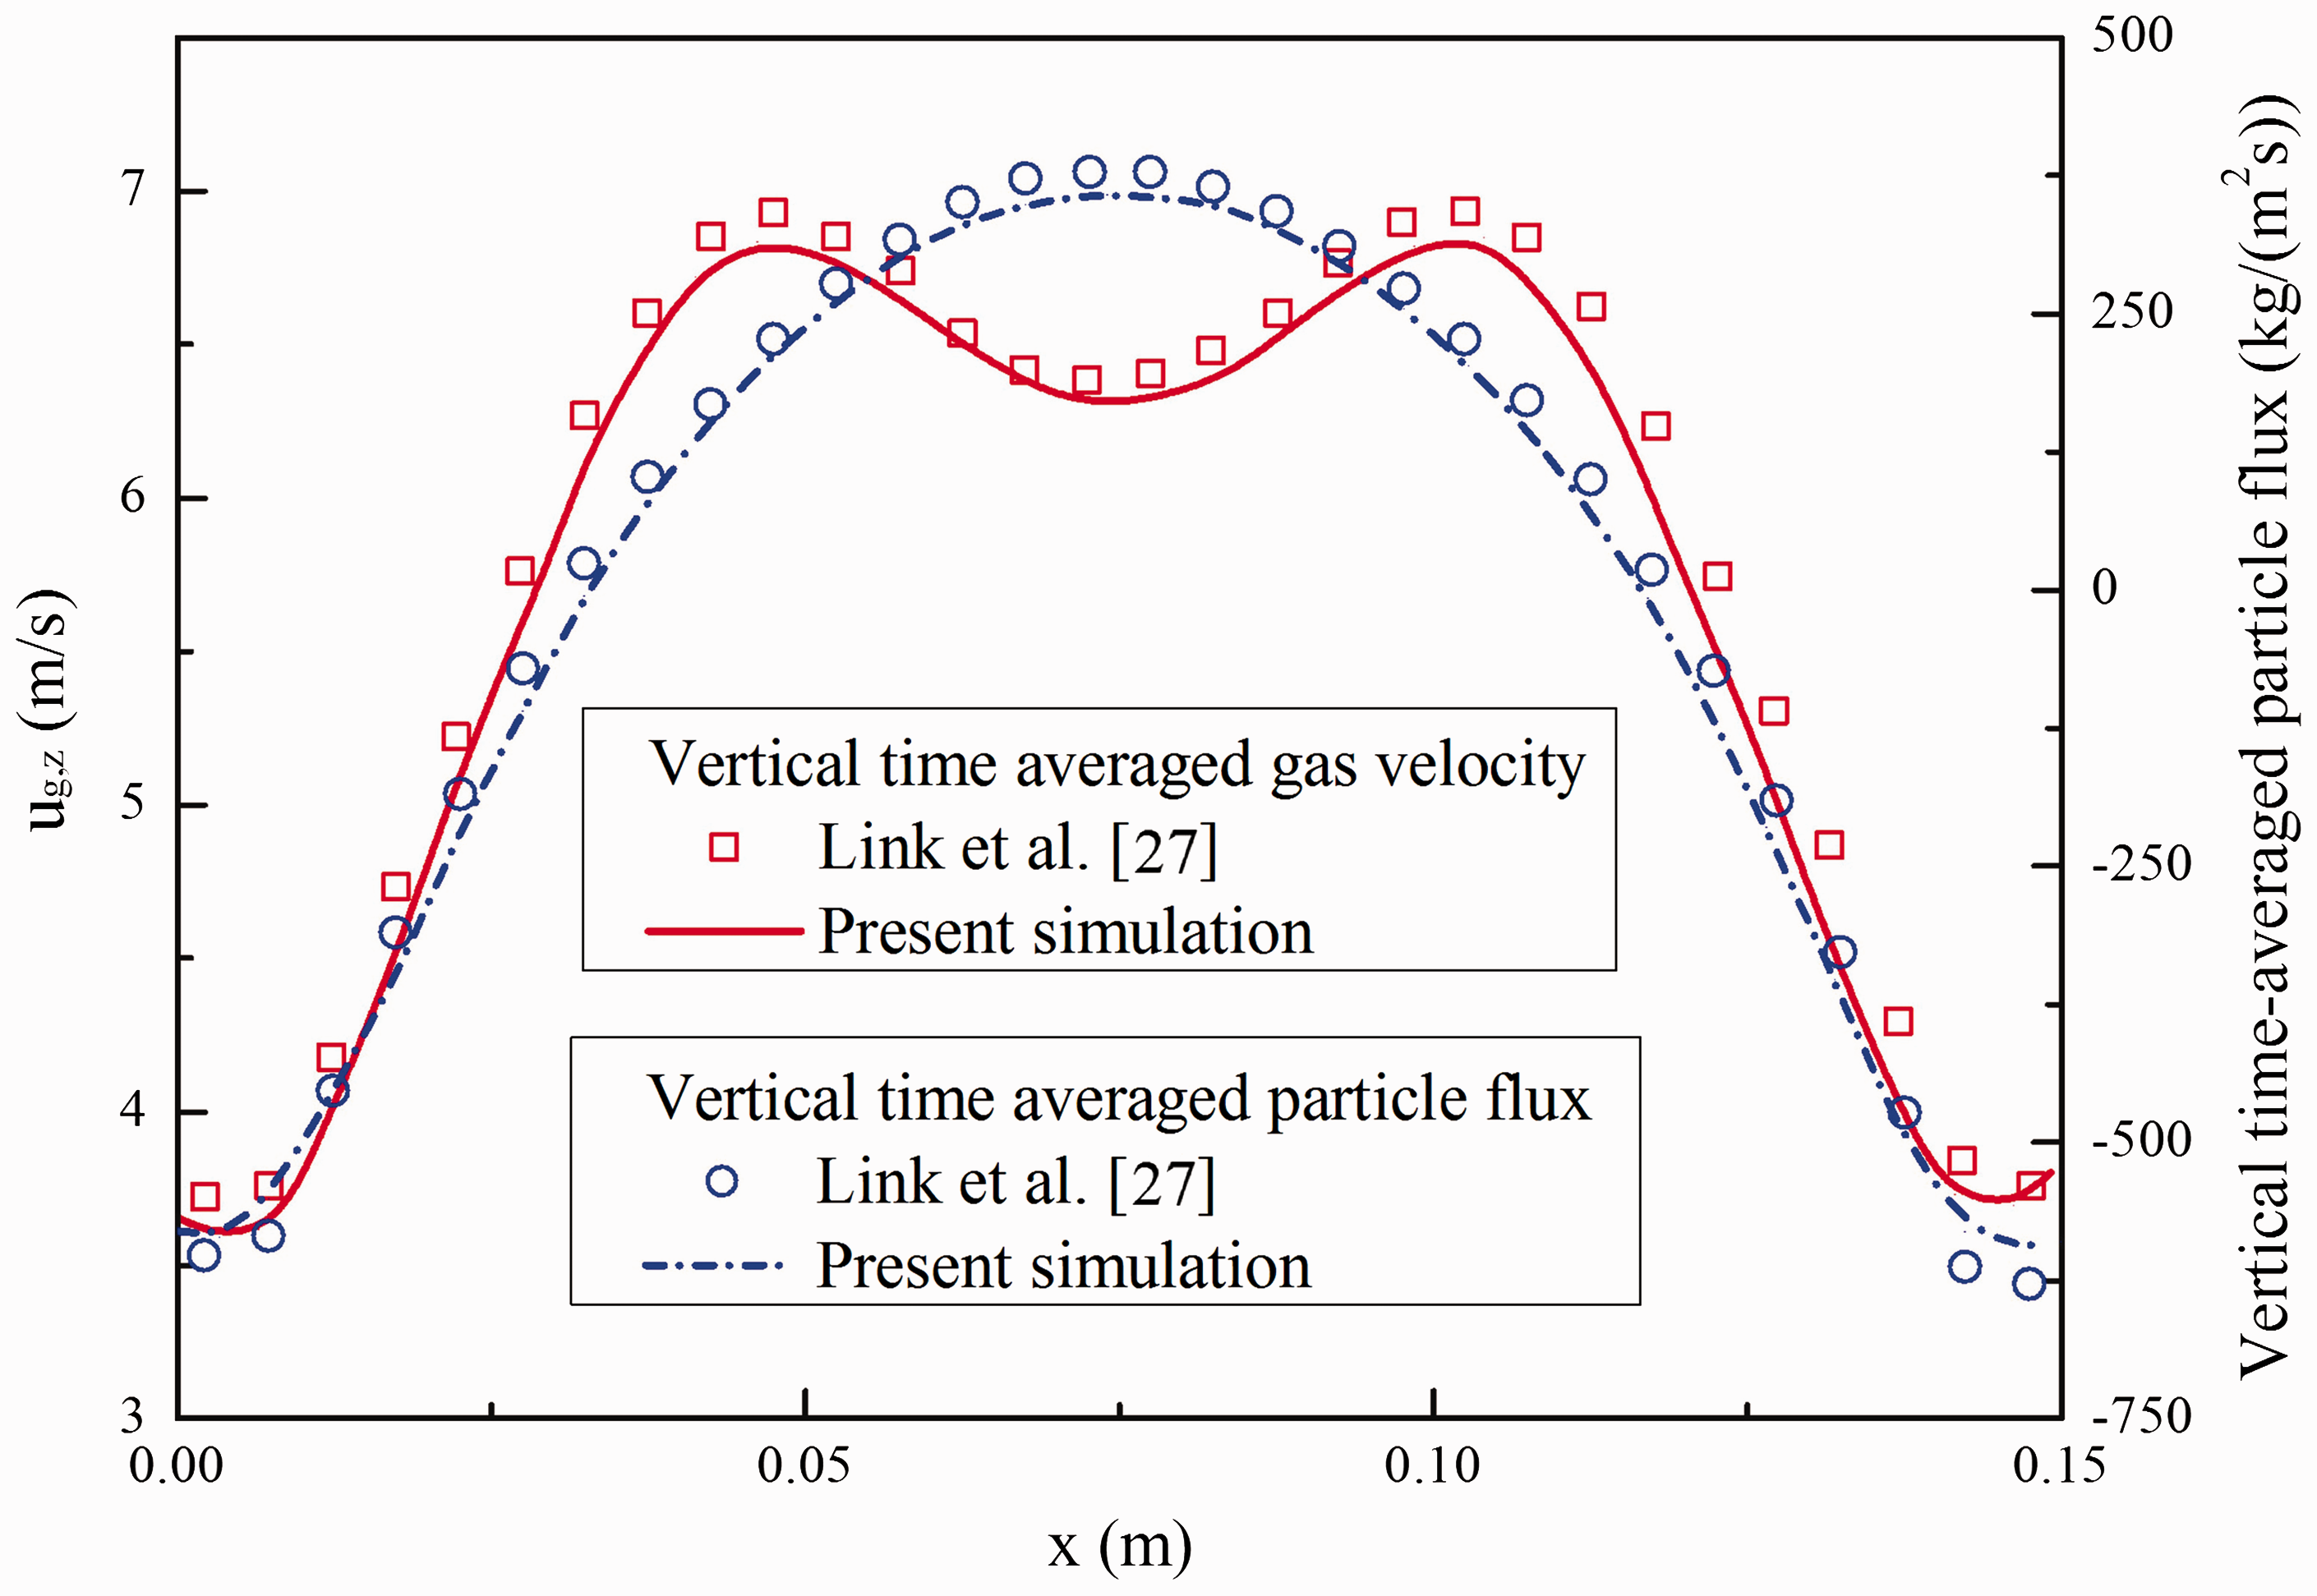
Vertical time-averaged gas velocity and particle flux in jet-in-fluidized bed regime.
Spout- and intermediate-fluidization regime
With increasing the jet velocity and decreasing the background velocity, the gas–solid flow comes to the spout-fluidization regime and intermediate/spouting-with-aeration regime. For the regimes of spout fluidization and intermediate, a periodically fluctuating pressure drop is obtained. From the pressure drop measurements and their frequency spectrums using Fourier transformation by Link et al., 27 the spout- and intermediate-fluidization regimes perform similar gas–solid flow behaviors that a spout channel is formed in the center of the bed, and it is periodically blocked by particles moving into the spout channel from the annulus. More regular pressure drop fluctuations and a lower frequency are obtained for the spout-fluidization regime, as the intermediate-fluidization regime has a larger jet velocity, the spouting becomes more violent and it takes less time to remove particles in the channel. Figures 9 and 10, respectively, show the flow regimes of spout fluidization and intermediate, of which the background velocities are both 1.5 m/s and the jet velocities are 30 and 40 m/s, respectively. The transient snapshots show the process of bubble forming, propagating, and collapsing, in other words, spout channel forming and blocking. A snapshot from the experiment 27 is shown in Figure 9(e) and compared with the numerical predictions. The injected bubbles continuously take particles to the upper part of the bed and, after the bubble collapses, particles fall down in both sides, which happen periodically in a regular pattern. But in the intermediate-fluidization regime, as the jet velocity is larger, the bed height is much higher and the spouting is more violent than that in spout-fluidization regime. It is observed that the spout channel is blocked by fewer particles. Several bubbles are found in the upper part as new bubbles are formed before the former bubble collapses. It is also found that the jet is slightly off center and swinging from one side to the other alternately.
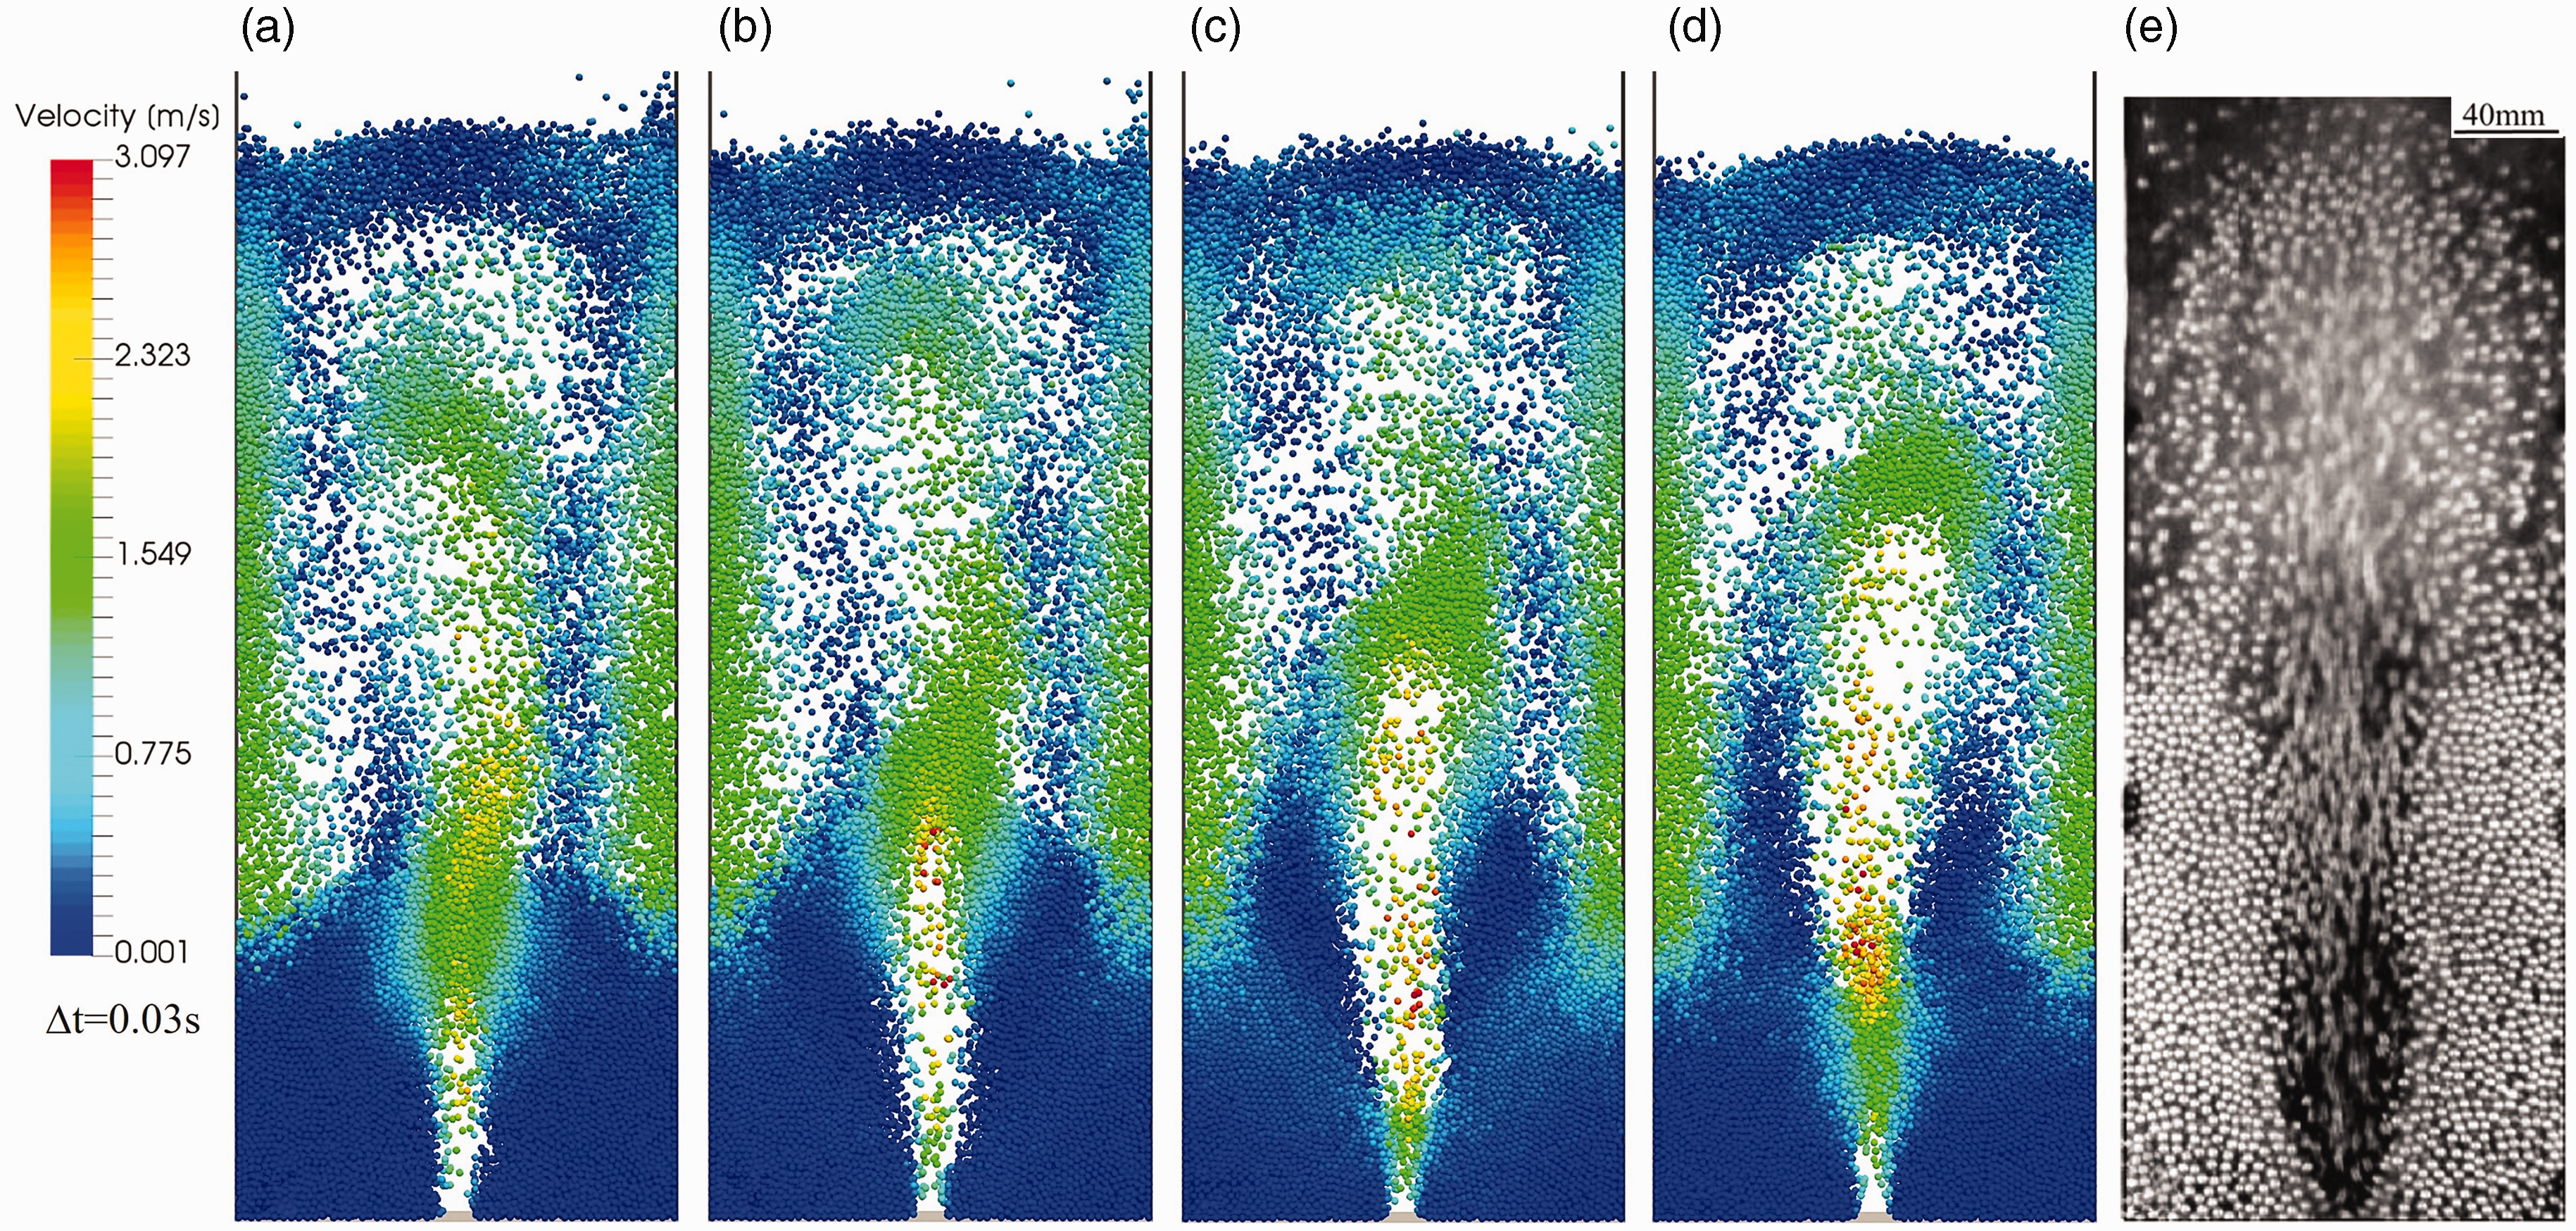
Particle flow patterns in a typical cycle with a time interval 0.03 s in spout-fluidization regime: (a)–(d) compared with (e) a snapshot of the experiment. 27
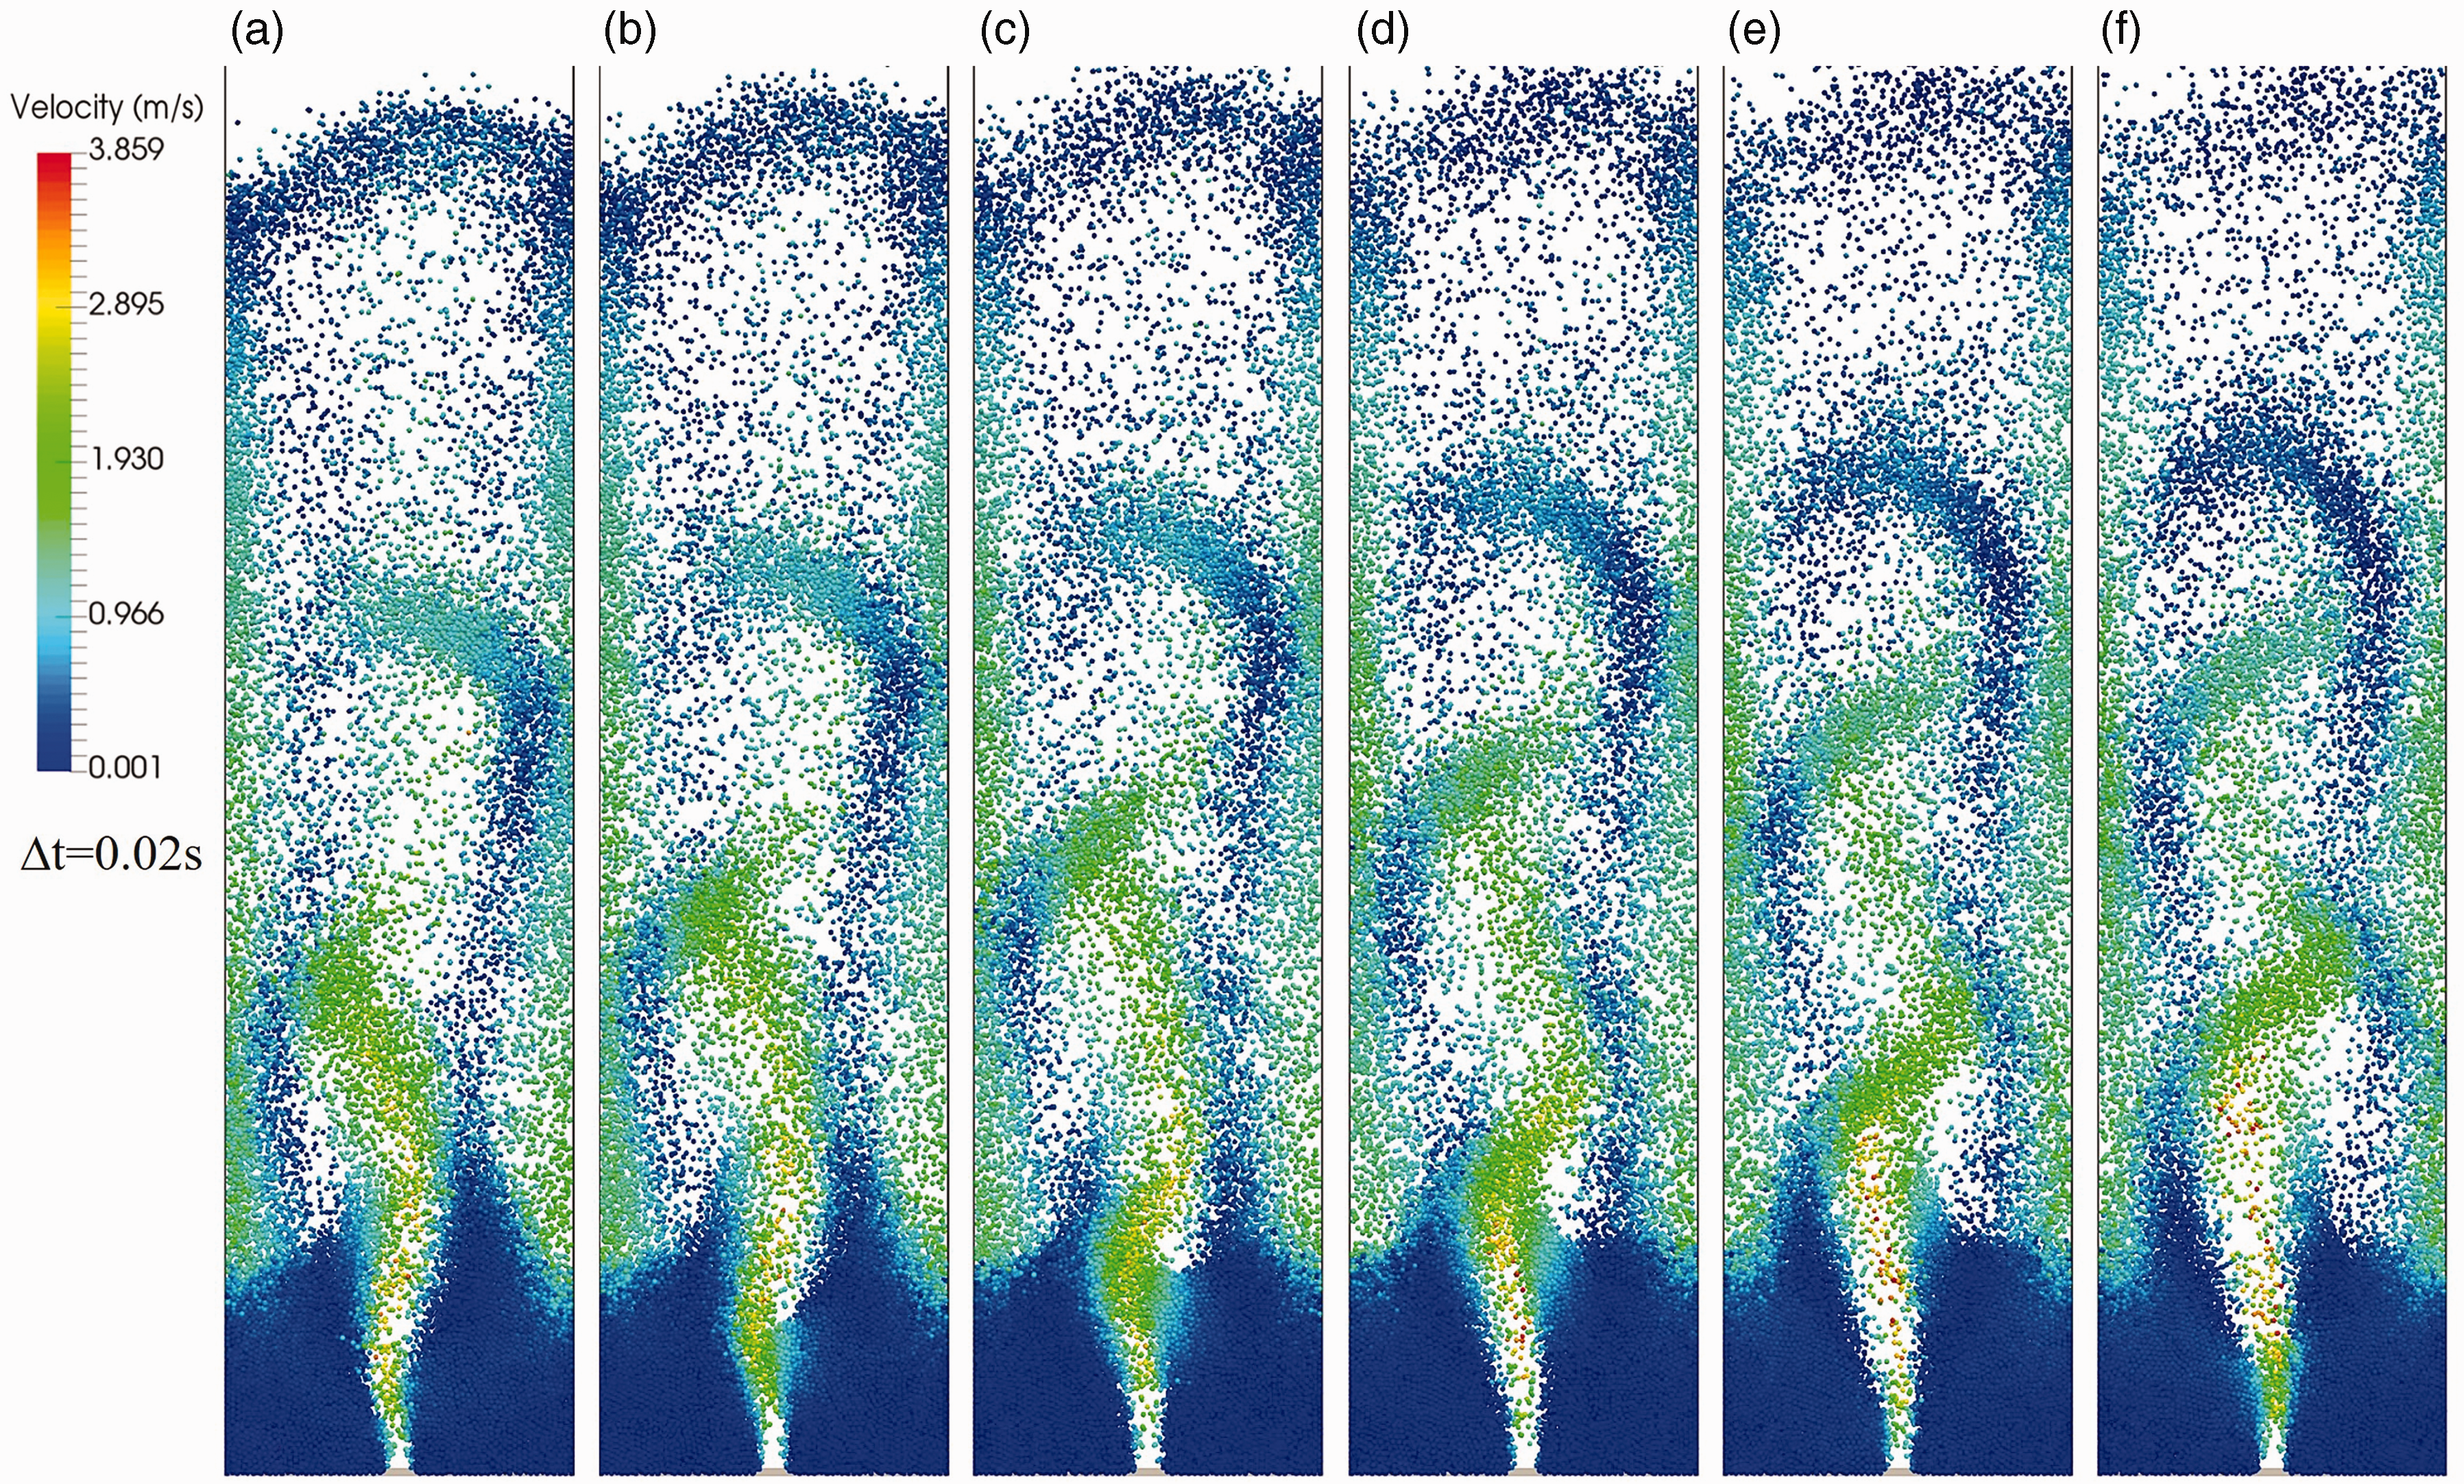
Particle flow patterns in a typical cycle with a time interval 0.02 s in intermediate-fluidization regime: (a)–(f).
As details are provided for the spout-fluidization regime, more detailed results of this regime are compared with the measurements in Link et al., 27 to get a quantitative investigation on the accuracy of the present model. Figure 11 draws the curves of pressure drop fluctuations monitored from the present simulations and the experiment 27 (with the dynamic pressure drop measurements at a frequency of 1000 Hz at the point 0.01 m above the inlet). Comparing the experimental result with the numerical result using the Van der Hoef drag law, a coincident fluctuation pattern is found and the amplitude is in good agreement with each other, though the simulated frequency is a bit higher than the experimental one. A dominant frequency between 5 and 6 Hz is found in Link et al., 27 and, in the present simulation, it is between 6 and 7 Hz. On the other hand, the result obtained using the Gidaspow drag law shows inconsistent fluctuations. Figure 12 shows the profiles of vertical time-averaged gas velocity and particle flux evaluated in the present simulation compared to the results in Link et al., 27 using the Koch and Hill 28 drag relation which is also derived from LBM simulations. The comparison also shows fairly good agreements. The picture that contains the time-averaged porosity and velocity distributions is also shown in the figure. It illustrates that in spout-fluidization regime, the jet is quite stable, and the gas continuously goes through the spout channel above the inlet and takes particles from the channel to the upper part.
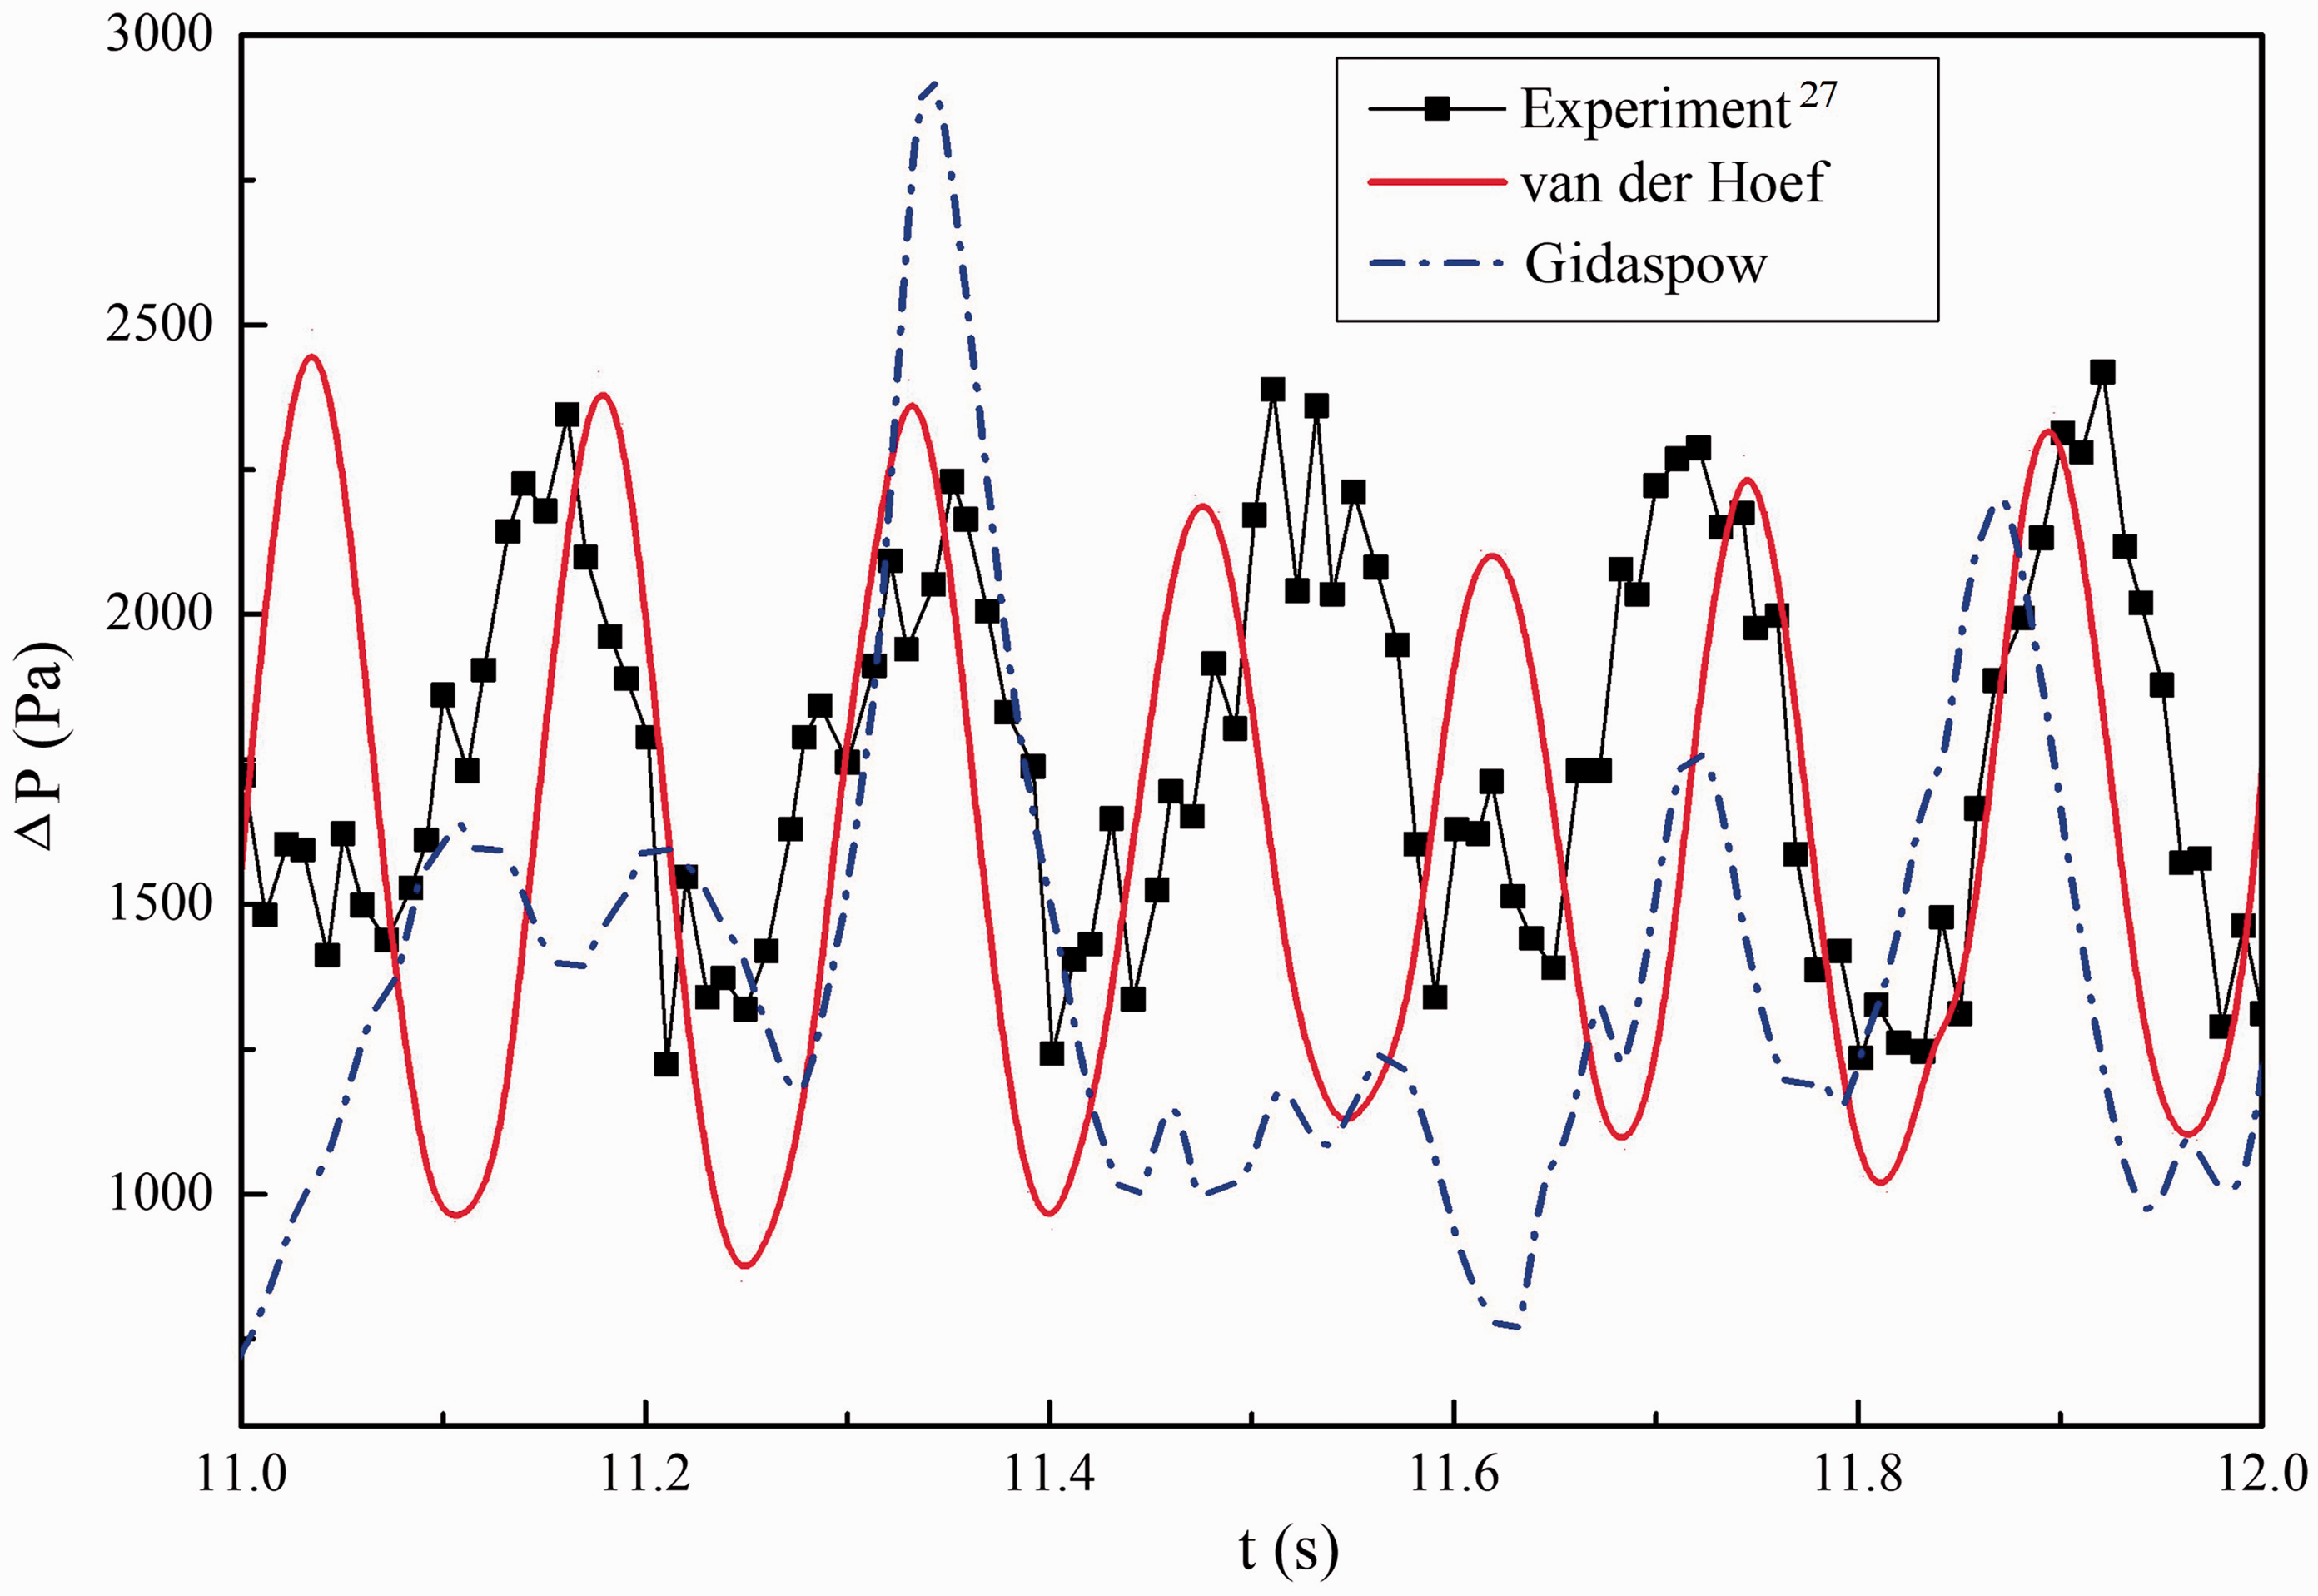
Pressure drop fluctuation in spout-fluidization regime.
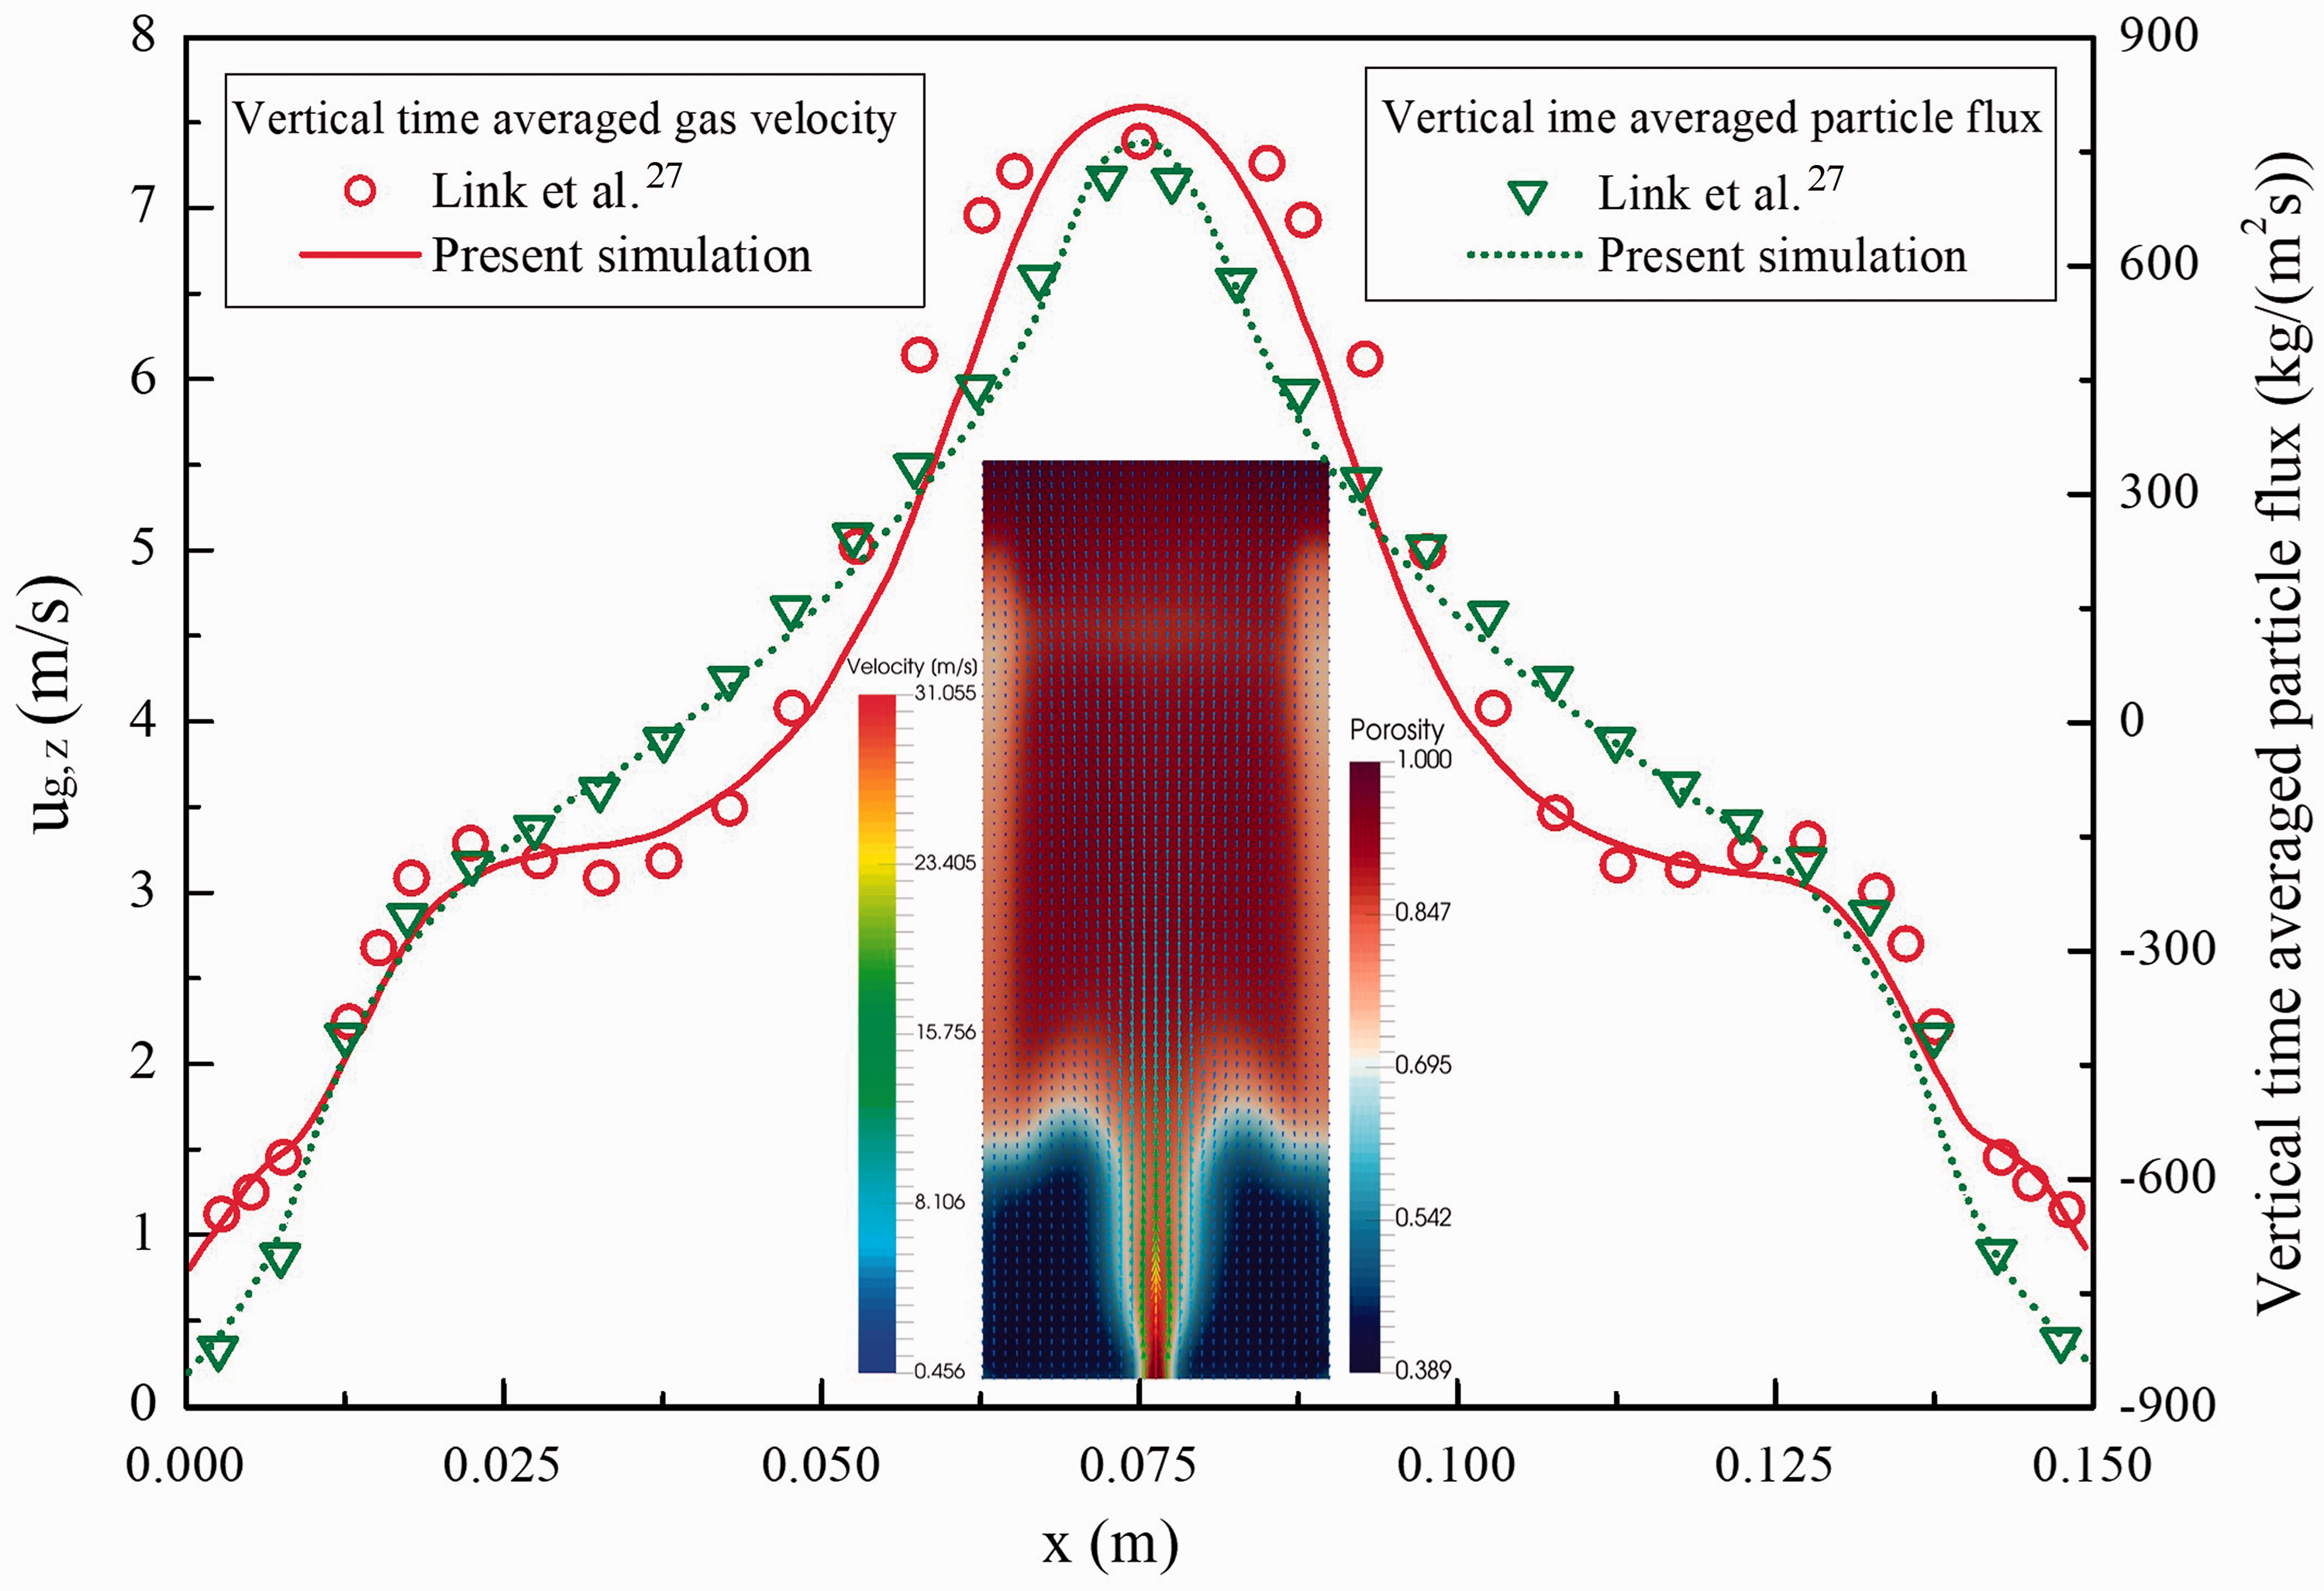
Vertical time-averaged gas velocity and particle flux in spout-fluidization regime.
Conclusions
CFD-DEM simulations of gas–solid flows are performed using OpenFOAM. A drag law derived from LBM simulations is incorporated into the CFD-DEM framework for the two-way coupling of gas and solid. The particle collision is directly resolved using the soft sphere model. The gas–solid flow regimes including slugging bed, jet-in-fluidized bed, spout fluidization, and intermediate are simulated to investigate the accuracy of the present modeling framework for predicting different gas–solid behaviors. The conclusions can be drawn as follows:
The drag law proposed by Van der Hoef et al.
29
derived from LBM simulations overcomes the discontinuity of the popular Gidaspow
22
drag law and predicts more accurate bubble size in a packed bed. The simulated gas–solid behaviors in slugging-bed flow regime qualitatively agree well with the experimental results. A randomly swinging jet and irregular pressure drop fluctuations are predicted in jet-in-fluidized bed regime, the time-averaged gas velocity and particle flux are in good agreement with the previous simulations.
27
For spout- and intermediate-fluidization regimes, qualitatively agreements are obtained for gas–solid flow behaviors. For spout-fluidization regime, the pressure drop fluctuation and the time-averaged profiles of gas velocity and particle flux are quantitatively in good agreement with the previous simulations.
27
Footnotes
Declaration of conflicting interests
The author(s) declared no potential conflicts of interest with respect to the research, authorship, and/or publication of this article.
Funding
The author(s) disclosed receipt of the following financial support for the research, authorship, and/or publication of this article: Authors are grateful to the support of AECC Shenyang Engine Research Institute.