
Abstract
Horizontal impact tests of stainless steel–reinforced concrete piers with different reinforcement ratios at different impact velocities were carried out by using the ultra-high drop weight impact test system. Degree of piers damage after impact was comprehensively analyzed by measuring the acceleration of the impact body, the displacement of the top of the pier specimens, the strain of the steel bars, the rotation of the pier bottom, and the crack development of concrete. The test results showed that under the same impact velocity, with the decrease in reinforcement ratio, the peak acceleration of the impact body, the displacement of the top of pier specimens, the strain of steel bars, and the pier bottom rotation all increase. To a certain extent, increasing the reinforcement ratio of bridge piers can effectively reduce impact damage.
Introduction
With the improvement of the national economy, shipping has made great progress. With the increase of navigation and sea-crossing bridge, ship–bridge collisions are also increasing. Because of the large impact force when the pier was hit, method of judgment of the damage degree of pier after collision has become an important issue.
Sha and Hao 1 , 2 carried out the non-linear finite element simulation of ship impacting square pier and carried out the numerical simulation and scale model test of rigid body affecting circular concrete pier. Zhang et al. 3 carried out a scale model test of rigid body affecting prefabricated columns and discussed their mechanical properties and failure modes under impact loads. Chung et al. 4 and Do et al. 5 , 6 carried out numerical simulation analyses of automobile impact on ordinary reinforced concrete and prefabricated concrete column piers and obtained the simplified impact load and failure mode of the pier. Liu et al. 7 studied the performance and failure mechanism of axially compressed reinforced concrete cylindrical piers under lateral impact. L Tian and C Zhu 8 established a damage-assessment method for reinforced concrete columns based on their vertical residual bearing capacity after impact and analyzed the protective effect of protective measures on the columns. Cheng et al. 9 carried out a numerical study on the dynamic response of reinforced concrete columns under impact and analyzed the impact speed, mass, shape of impact body, reinforcement ratio, and strength grade of concrete on deformation and impact force. Liu et al. 10 used the finite element method to study the failure mode and transformation mechanism of reinforced concrete columns with axial compression under lateral impact load. Demartino et al. 11 and Cai et al. 12 carried out an experimental study on impact resistance of reinforced concrete piers with reduced size. Zhang et al.13–15 and Zhou et al.16–18 have studied the impact resistance of stainless steel–reinforced concrete. But they all focus on the dynamic response of stainless steel–reinforced concrete.
Overall, most of the existing studies focus on the mechanics of reinforced concrete piers subjected to impact loads, while few studies focus on post-accident evaluation. With the more and more application of stainless steel–reinforced concrete, the research on damage evaluation of stainless steel–reinforced concrete piers under lateral impact has not been carried out. Therefore, this article took the application of stainless steel–reinforced concrete piers of Hong Kong-Zhuhai-Macao Bridge as the research background and conducted the experimental research on the damage degree of stainless steel–reinforced concrete piers with different reinforcement ratios under horizontal impact loads by using ultra-high multi-functional drop hammer impact testing machine. The damage degree after impact was evaluated by the acceleration of the impact body, the displacement of the top of the pier specimens, the strain of the steel bar, the rotation of the pier bottom, and the crack development of concrete. The research results will have important reference significance for the impact resistance design of the stainless steel–reinforced concrete piers and the reinforcement of the piers after the impact accident.
Experimental program
Design of the specimen
In this experiment, two specimens were designed, which were made of C40 concrete, and the number of longitudinal bars was 8 and 10, respectively. The section diameter of the specimens was 340 mm and the height was 2200 mm. The stainless steel bar used in the test was S2304 duplex stainless steel bar, and the stirrup was HRB335 steel bar. The design parameters and material properties of the specimens are shown in Table 1, and the detailed drawing of the reinforcement of the specimens is shown in Figure 1.
Specimen design parameters.


Detailed drawing of reinforced concrete (unit: mm).
Test device
The experiment was completed on an ultra-high drop hammer impact test machine. By adjusting the vertical height of the drop hammer, the free-falling body of the drop hammer was used to pull the car forward at different speeds. The weight of the drop hammer was 200 kg, the weight of the impact body was 1.2 t, and the vertical axis pressure of 250 kN was applied on the top of the specimen, as shown in Figure 2.

Ultra-high drop hammer impact test system diagram.
During the test, the acceleration of the impact body, the displacement of the top of the specimens, the strain of the steel bar and concrete, and the crack development of concrete were collected and recorded, as shown in Figures 3 and 4.
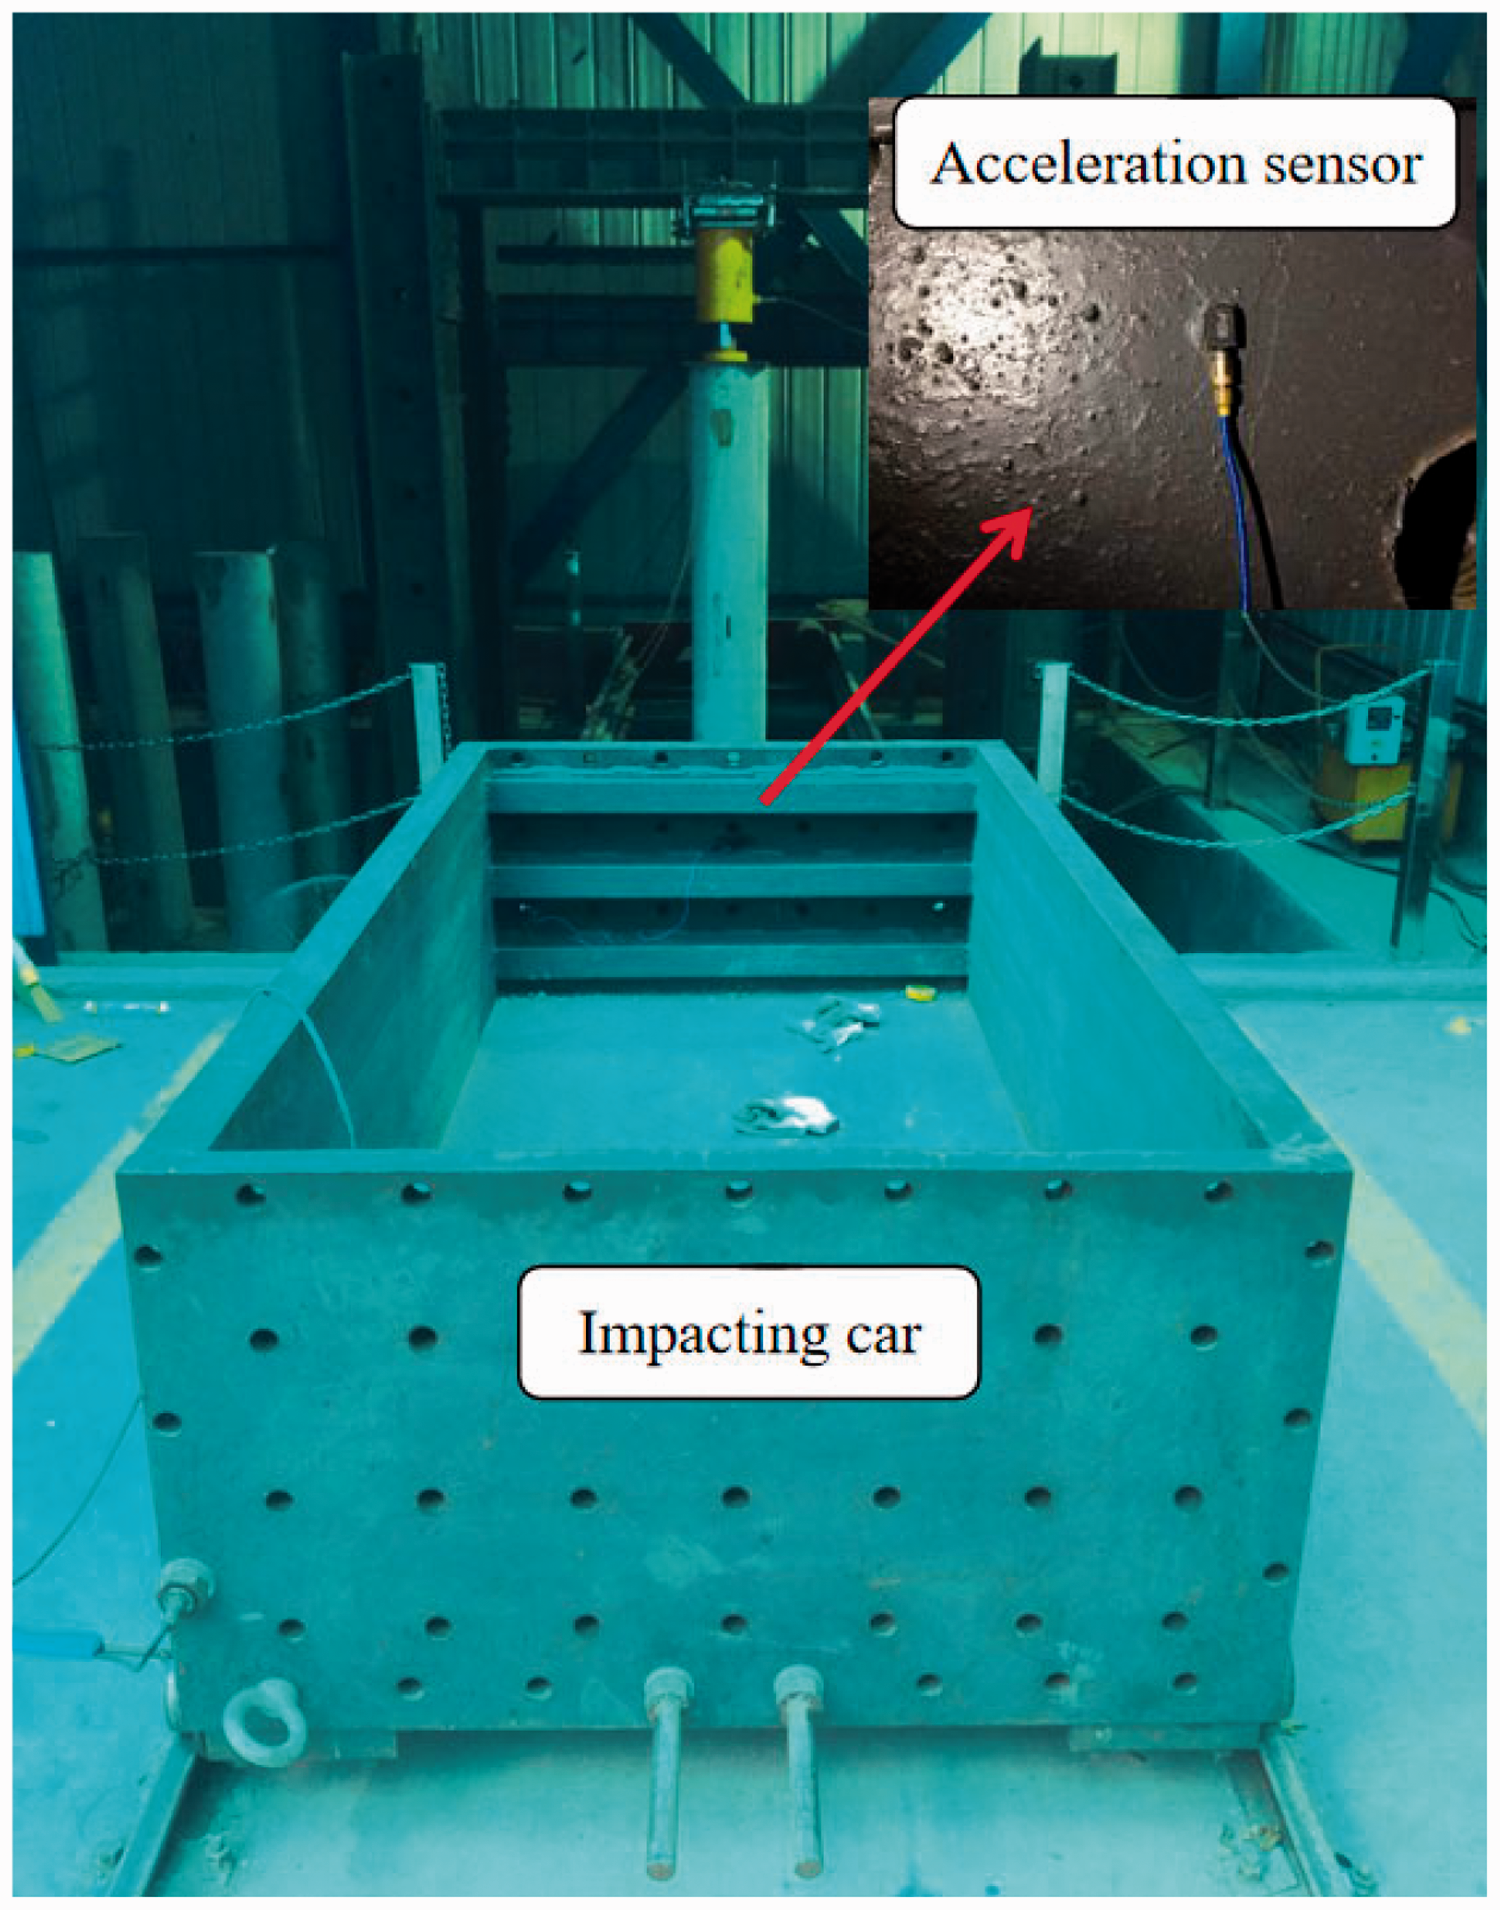
Acceleration sensor.

Top displacement gauge.
The drop hammer was lifted to a certain height and released. It will pull the trolley to hit the specimens. The impact test was carried out at four different velocities of 1.28, 2.18, 2.85, and 3.39 m/s, respectively. Acceleration was measured by an acceleration sensor placed on the head of the impact vehicle.
Results and discussion
Time history curve for the acceleration
Figures 5 and 6 were acceleration–time history curves under four different impact velocities, respectively. The collision process was very short. The acceleration–time history of each specimen at different impact velocities had experienced a process of rapid rise and then rapid decline, and finally tended to balance. The maximum acceleration of A1 specimen under different impact velocities in Figure 5 was 68.71, 156.42, 232.27, and 285.13 m/s2, respectively. The maximum acceleration of A2 specimen under different impact velocities in Figure 6 was 81.26, 189.49, 290.44, and 371.81 m/s2, respectively. At the same impact velocity, the peak acceleration of A1 specimen was less than that of A2 specimen. The peak acceleration directly reflected the maximum impact force; it showed that the increase in the reinforcement ratio can reduce the impact on the pier. Four different impact velocities and acceleration peaks were fitted to get the relationship as shown in Figures 7 and 8.

Acceleration–history curve of the A1.

Acceleration–history curve of the A2.

Relationship between acceleration peak and velocity of the A1.

Relationship between acceleration peak and velocity of the A2.
As can be seen from Figures 7 and 8, the peak acceleration increases with the increase in impact velocity. The correlation coefficient between the initial impact velocity and the maximum acceleration of the specimens was above 0.99 by one fitting, so the impact velocity and the maximum acceleration can be regarded as a linear relationship.
Top displacement and steel strain
The top displacement–time history curves of the two specimens under different impact velocities are shown in Figures 9 and 10. It can be seen from the figures that when the impact body started to contact the pier specimens, the displacement curve rose rapidly, and the beginning time and the maximum time of the displacement curve were consistent with the acceleration–time history curve. The maximum displacement of A1 specimen under three different impact velocities in Figure 9 was 42.99, 58.22, and 73.94 mm, respectively. The maximum displacement of A2 specimen under three different impact velocities in Figure 10 was 50.74, 71.15, and 89.20 mm, respectively. At the same impact velocity, the maximum displacement of A2 specimen was significantly larger than that of A1 specimen. It also showed that the increase in the reinforcement ratio can reduce the impact on the pier.

Top displacement history of the A1.

Top displacement history of the A2.
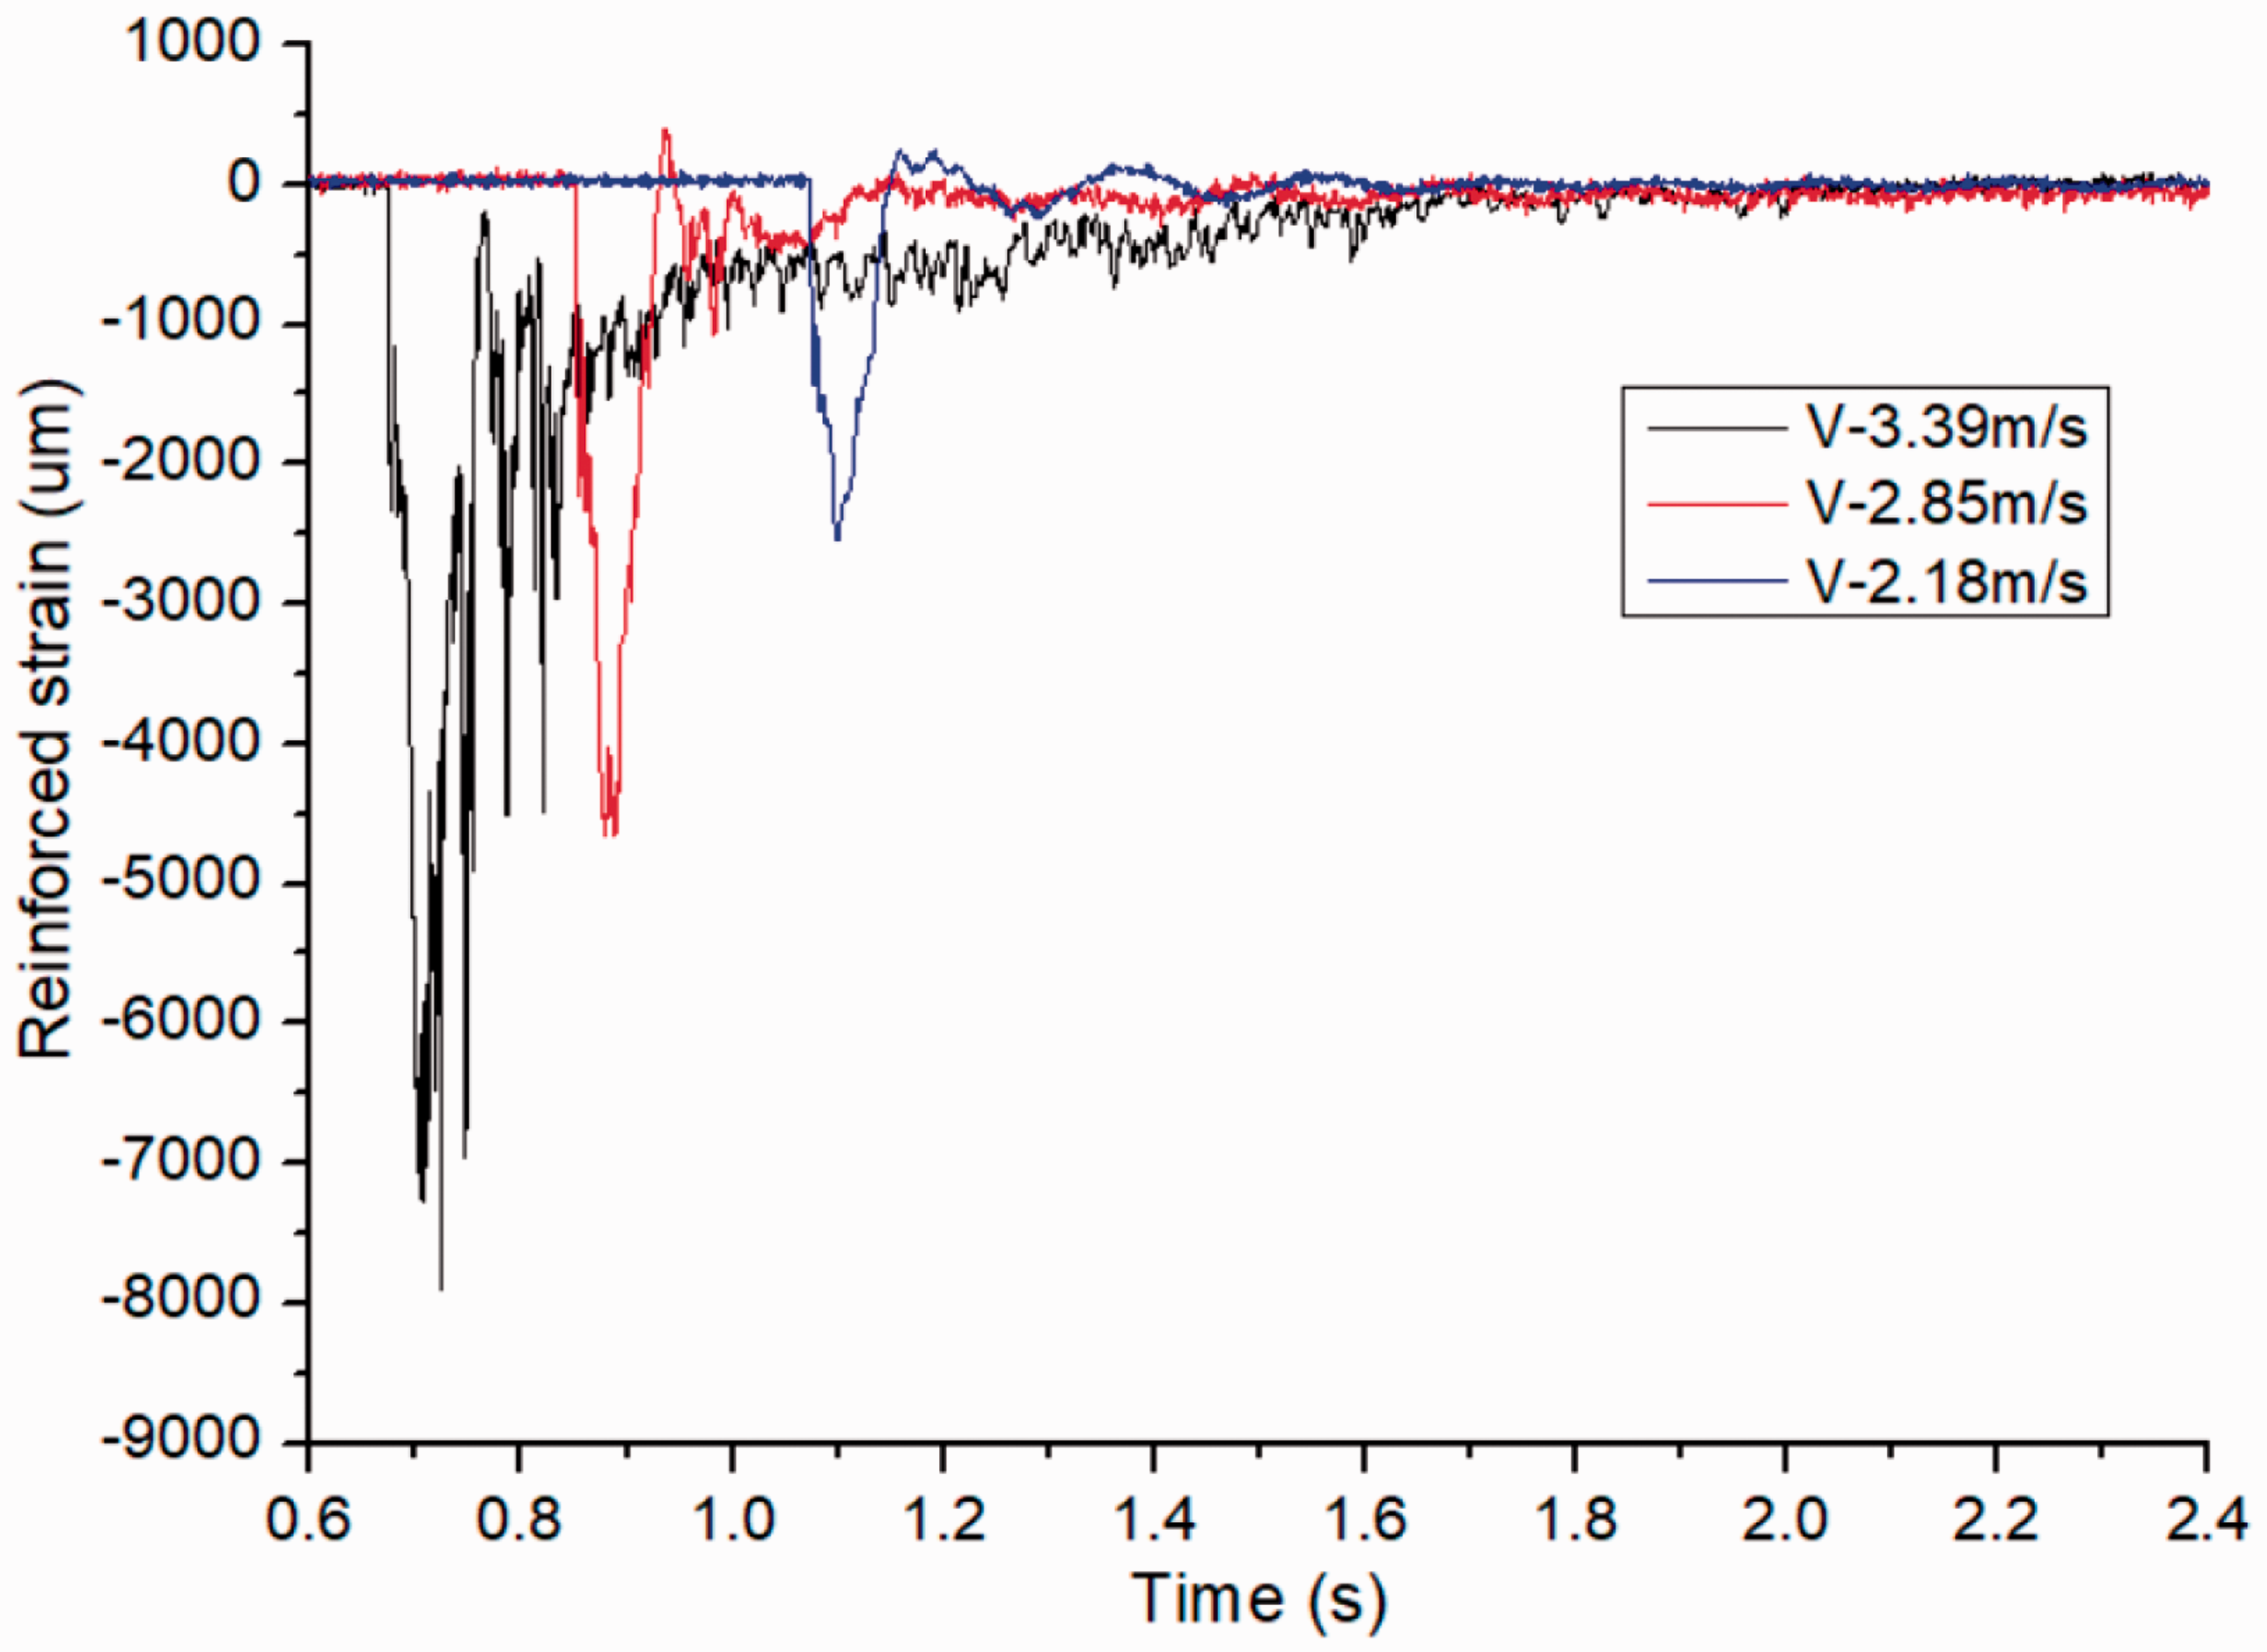
The strain–time history curves of steel bar at pier bottom of two specimens under different impact velocities are shown in Figures 11 and 12. It can be seen from the figures that the time when the strain curve of steel bars began to change and reached its maximum was consistent with the acceleration–time history curve and displacement–time history curve. The strain deformation of the reinforcement was mainly compressive strain, which was consistent with the actual situation. The maximum micro-strain of A1 specimen under three different impact velocities in Figure 11 was 1932, 3426, and 6812 um, respectively. The maximum micro-strain of A2 specimen at three different impact velocities in Figure 12 was 2535, 4658, and 7920 um, respectively. At the same impact velocity, the maximum strain of A2 specimen was larger than that of A1 specimen.

The reinforcement strain–time history curve of the A1.
The reinforcement strain–time history curve of the A2.
According to the impact test under different impact velocities, the relationship between the velocity of the specimen and the pier bottom rotation is shown in Figure 13. With the increase of impact velocities, the rotation of the pier bottom increased approximately linearly, and the growth rate of the A2 specimen was larger than that of the A1 specimen. It showed that the increase in the reinforcement ratio reduced the impact damage of the pier.

Relationship between velocity and the pier bottom rotation.
Crack development analysis
The crack development of the two specimens is shown in Figures 14 and 15. At the impact speed of 1.28 m/s, no cracks were found in both specimens. The initial crack development of each specimen started from the bottom area of the front side of the specimen and the region corresponding to the impact point of the reverse side of the specimen. With the increase of the impact velocity, the crack began to extend from the bottom of the front side to the middle direction, while the crack on the reverse side developed toward the middle and upper part. When the impact velocity reached a certain level, large cracks appear at the bottom of the front side, and some concrete at the bottom of the reverse side was crushed.
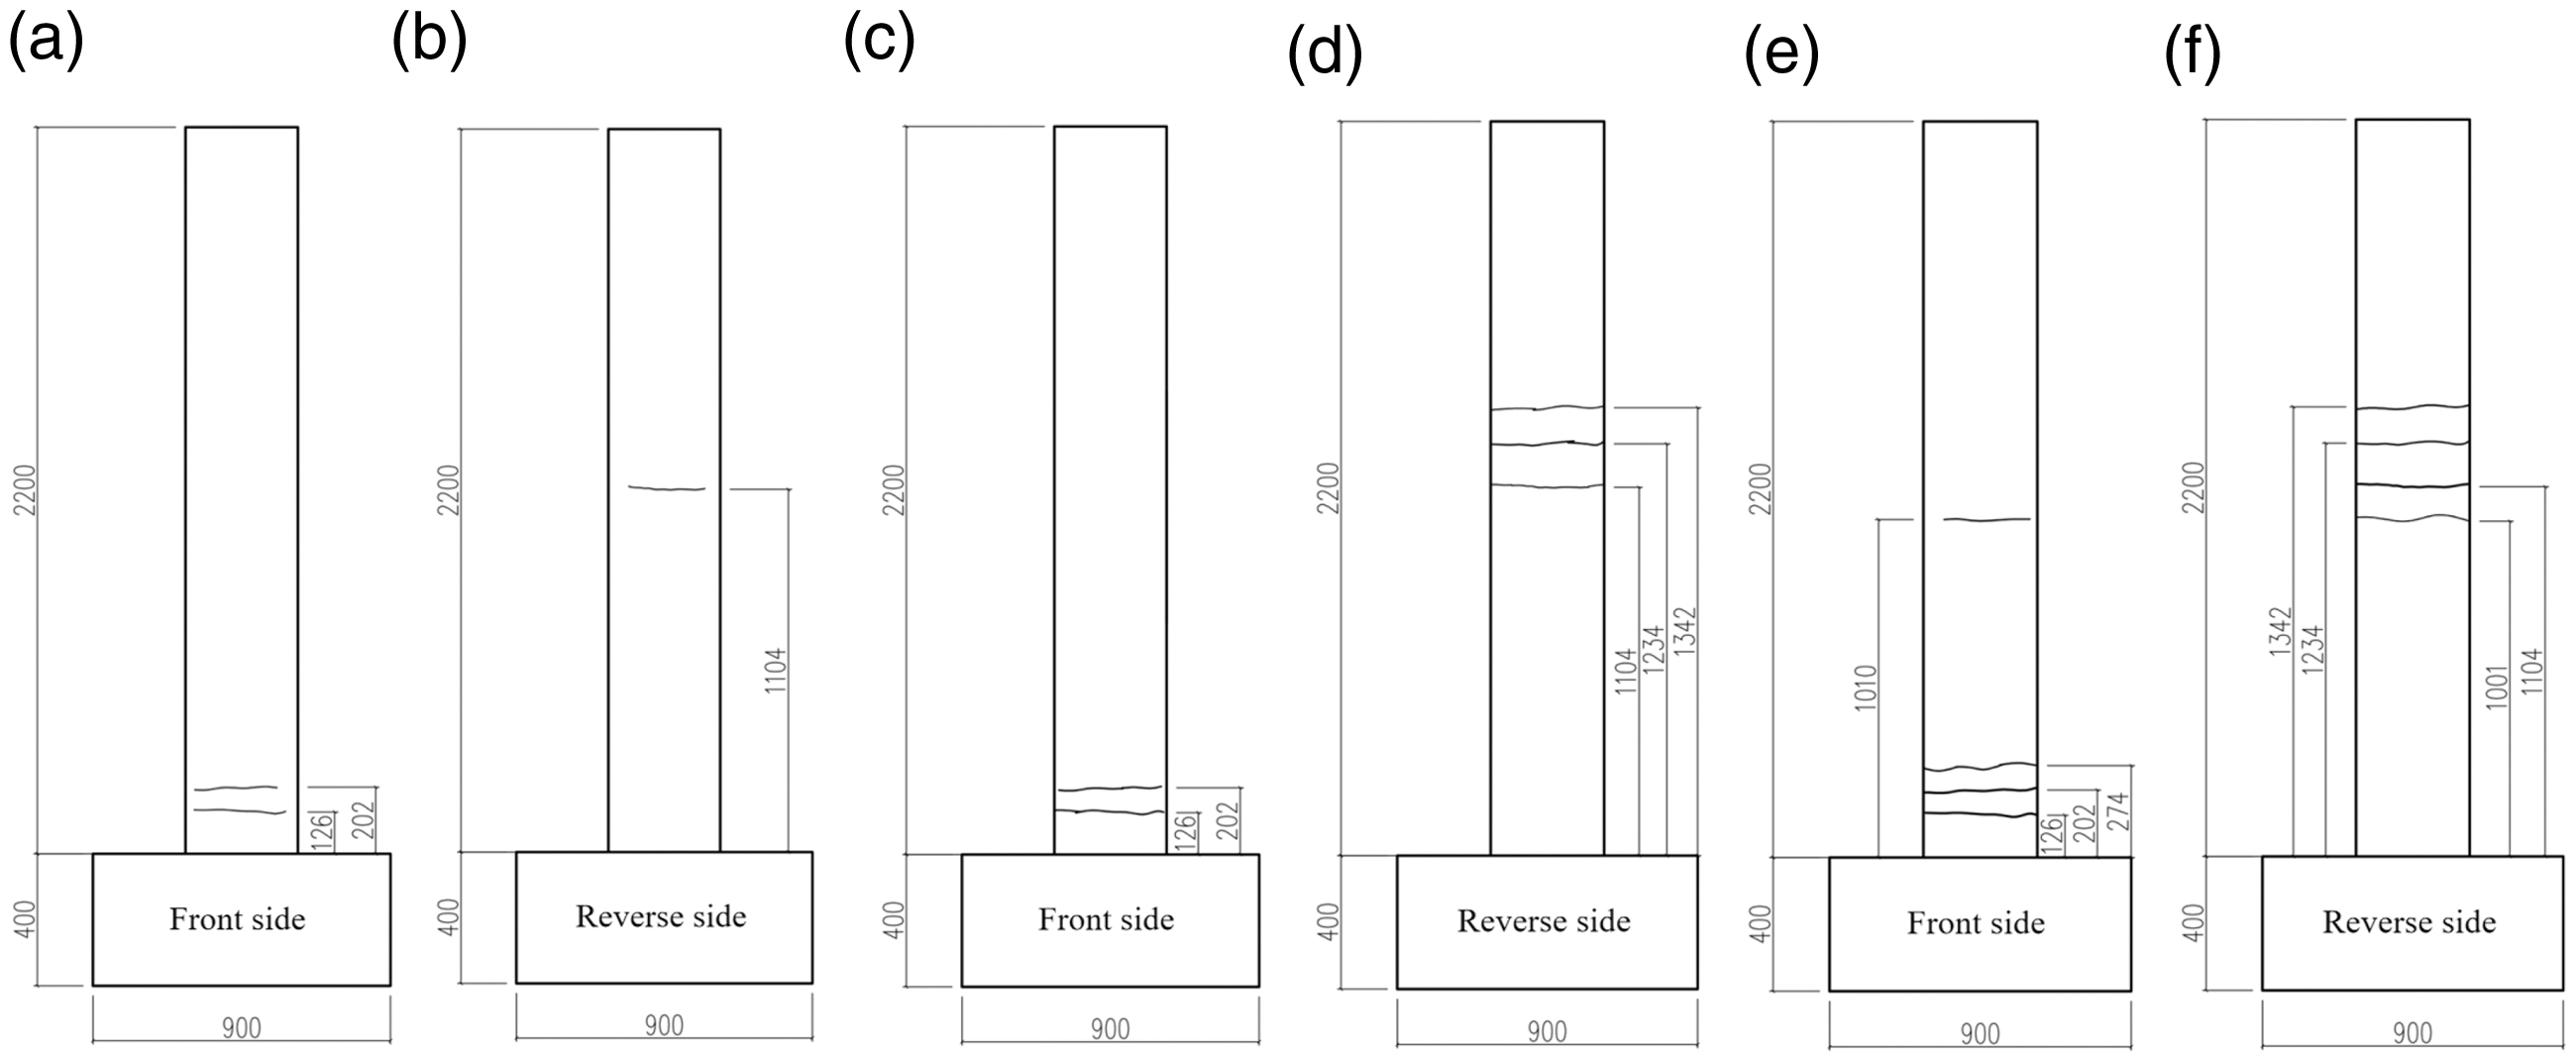
The crack development under different velocities of the A1 (unit: mm). (a) v-2.18 m/s, (b) v-2.18 m/s, (c) v-2.85 m/s, (d) v-2.85 m/s, (e) v-3.39 m/s, and (f) v-3.39 m/s.

The crack development under different velocities of the A2 (unit: mm). (a) v-2.18 m/s, (b) v-2.18 m/s, (c) v-2.85 m/s, (d) v-2.85 m/s, (e) v-3.39 m/s, and (f) v-3.39 m/s.
The maximum crack width of A1 specimen under three different impact velocities in Figure 14 was 0.03, 0.06, and 0.09 mm, respectively. The maximum crack width of A2 specimen at three different impact velocities in Figure 15 was 0.05, 0.08, and 0.12 mm, respectively. At the same impact velocity, the maximum crack width of A2 specimen was larger than that of A1 specimen.
Damage analysis
Through impact test at different impact velocities, the damage degree of the specimens was evaluated by the top displacement, pier bottom rotation, steel strain, and crack development, as shown in Table 2.
Evaluation of damage degree.

Comprehensive analysis of all evaluation indicators showed the damage degree of A1 specimen was lower than that of A2 specimen under the same impact condition. This was mainly due to the increase in the reinforcement ratio which reduced the impact damage of the pier.
Conclusion
With the increase of impact velocity, the acceleration of impact body increased continuously, and the peak acceleration had a linear relationship with impact velocity. With the decrease in reinforcement ratio, the acceleration peak of impact body, the top displacement peak of pier specimen, and the peak strain of reinforcement increase at the same impact velocity. With the decrease in reinforcement ratio, the peak values of acceleration, top displacement, and reinforcement strain increase at the same impact velocity. The peak acceleration increased by up to 30%. Under lateral impact load, the cracks began to develop from the bottom area of the front side of the specimen and the region corresponding to the impact point of the reverse side of the specimen. With the increase of impact energy, the concrete at the bottom of the back of the specimen was crushed. The failure mode of the bridge piers under lateral impact load was related to the speed and the reinforcement ratio. To some extent, increasing the reinforcement ratio of the bridge piers can effectively reduce the impact damage.
Footnotes
Handling Editor: James Baldwin
Data availability
The datasets used and analyzed during the current study are available from the corresponding author on reasonable request.
Declaration of conflicting interests
The author(s) declared no potential conflicts of interest with respect to the research, authorship, and/or publication of this article.
Funding
The author(s) disclosed receipt of the following financial support for the research, authorship, and/or publication of this article: This work was supported by the National Natural Science Foundation of China (No. 51678164, No. 51478118), the Guangxi Natural Science Foundation Program (2018GXNSFDA138009), the Guangxi Science and Technology Plan Projects (AD18126011), the Scientific Research Foundation of Guangxi University (XTZ160590), GDHVPS (2019), and the Guangxi special experts special funds granted for Dr Bo Wu.