
Abstract
Stainless reinforced equal-strength replacement piers are used to solve the problems of steel corrosion, surplus strength, and resource waste for piers in marine environments. In this study, an ultrahigh drop weight impact test system was applied for a comparative experimental model of the horizontal impacts between two groups of stainless reinforced replaced concrete piers. The impact forces and displacements, strain time–history curves, crack propagations and distributions, and concrete damages, were analyzed during the experimental test. The results showed that the original specimen had consistent change trends with the stainless reinforced equal-strength replaced specimens in regard to maximum impact, steel bar and concrete strains, displacement peaks, and other aspects. Furthermore, under equal impact energies, the relative ratios were found to all range at ±5%, and the fracture quantities and distributions, as well as the concrete damages, were approximately consistent. These research results will potentially provide technical support for the future designs of anti-impact stainless reinforced concrete piers.
A number of serious ship-bridge collision events have occurred almost every year with the development of large bridges across rivers and straits. These ship-bridge accidents have caused severe casualties, property losses, and environmental damages.1–4 Also, with economic developments and the deepening research regarding solutions to the problems of steel corrosion, an increasing number of important cross-sea bridges have utilized stainless-steel reinforcing bars to replace common reinforcements.5–7 In current studies and engineering applications, uniform-section replacements are mainly adopted. However, considering that the strengths of stainless-steel reinforcements are much higher than normal, these methods have been found to display such problems as surplus strength and resource waste. This research study’s aim was to apply stainless reinforcements to the equal-strength replacements of ordinary reinforcements in order to solve the problems of steel corrosion and surplus strength.
In recent years, some researchers have conducted related theory and experimental studies on stainless-steel reinforced concrete structures. The results indicated that the corrosion resistance of stainless-steel reinforced concrete is higher than that of ordinary concrete,8–10 while the adhesive strengths of the two were found to be basically the same. 11 It was observed that stainless steel reinforced concrete beams and columns have good ductility and energy dissipation capacities.12,13 The impact mechanical properties of the concrete materials and beam components were examined in this study in order to obtain the damage linear viscoelastic constitutive relationship of the concrete materials, 14 as well as the relationship between the beam deformations and their dynamic characteristics. Also, the impact velocities under the low-speed impact loads, 15 and the influence law of the stirrup reinforcement ratios on the dynamic responses of steel reinforced deep beams under impact loads were also examined. 16 It is known that confinement coefficients are important factors which influence the critical damage energy of components.17,18 The research results regarding the impact mechanical properties of concrete piers and column components have shown that, under horizontal impact conditions, the cross-section bending strength of the piers can be greatly influenced by the dynamic action. 19 Furthermore, the load durations and peaks are important factors which determine the damage mode of the structural components. 20 Increases in longitudinal and stirrup reinforcement ratios can effectively improve the collision resistance of reinforced concrete columns, 21 while increases in longitudinal reinforcement ratios and section sizes can significantly reduce the displacement of column nodes. However, the effects of the increases in stirrup reinforcement ratios have not yet been obvious. 22 It has been determined that increases in the longitudinal reinforcement ratios can improve the lateral bearing capacities of frame columns. The larger the loading rate is, the greater the increases in amplitude will be. 23 The research results regarding the impacts of the mechanical properties of stainless-steel reinforced concrete members have shown that the change trends of the impact forces, displacement peaks, and impact energies are relatively consistent with the quadratic function curve. 24 It can therefore be concluded that stainless-steel reinforced concrete structures have better impact resistance than ordinary reinforced concrete structures. 25 However, at the present time, research studies regarding stainless reinforcement equal-strength structures replacing ordinary structures are rare. Therefore, analyzing the benefits of the mechanical properties of stainless-steel equal-strength reinforcements when they have replaced ordinary reinforcements under horizontal load impacts could potentially solve the problems of using stainless-steel equal-cross-section reinforcements to replace ordinary reinforcements in current studies and engineering applications, such as surplus strength and resource waste.
This study based its examinations on the engineering applications of stainless-steel reinforced concrete bridge piers of the Hong Kong-Zhuhai-Macau Bridge, and used these as the research background. In this research study, stainless-steel reinforcements were used for the equal-strength (unit cross-section bearing capacity of the component reinforcement) replacements of ordinary steel bars in the bridge piers, in order to explore the impact mechanical properties of the stainless-steel reinforcements. The results of this study potentially provide valuable references for future anti-collision designs, as well as the evaluations of stainless-steel reinforced concrete piers.
Experimental survey
Specimen design
In this study, a comparative experiment research method was used to examine the impacts of the mechanical properties of stainless-steel equal-strength reinforcement replacing ordinary steel. In the experiment, two sets of cylindrical pier contrast specimens were designed, of which one set was a stainless-steel reinforced concrete column and the other set was an ordinary reinforced concrete column. The specimen had a column radius of 170 mm and a height of 2200 mm. There were 10 longitudinal bars in the specimen, with symmetrical reinforcements in the direction of the circular section. The longitudinal reinforcement in the ordinary reinforced concrete column was an HRB335 steel bar, and the stainless-steel reinforcement was S2304 bi-phase stainless-steel (UGIGRIP 1.4362) produced by the UGITECH Co. of France. The stirrup was composed of Grade-I HPB300 ordinary steel, with a diameter of 8 mm, welding construction, and a concrete strength of C40. The design parameters of the pier model are shown in Table 1.
Design parameters of the experimental specimen.

S represents the stainless reinforcement (S2304).
In the experiment, the steel bars of the specimens were stretched in order to obtain the yield strengths, ultimate strengths, and bearing capacities of both the stainless-steel and the ordinary reinforcements. Also, the yield strength of the stainless-steel reinforcement was the stress value when the residual strain was 0.2%, as shown in Table 2.
Basic parameters of the steel bar.

Meanwhile, 12 cubic specimens (150 × 150 × 150 mm3) were made as per the requirements, and compression tests were then completed on the specimens.
There is a formula for the vertical bearing capacity of the component

N—standard value of axial bearing capacity;
φ—the stability coefficient of the axial compression member,
NC—concrete bearing capacity, NS—bearing capacity of steel bar.
For reinforced concrete members, the section area of the reinforced bar
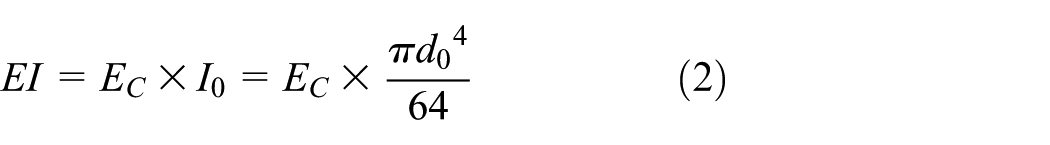
According to formulas (1) and (2), two sets of the relative ratios between the bearing capacity and stiffness were obtained for the equal-strength replaced piers, as shown in Table 3.
Contrast in the equal-strength replaced pier specimens.

Table 3 shows that, after approximating the equal-strength replacements of the two sets of stainless-steel bars, the vertical bearing capacity of the bridge pier specimen was changed. However, the relative ratio was less than 1%. Therefore, it could be assumed that the replacement had little influence on the vertical bearing capacity of the members. Then, posterior to the equal-strength replacement, the bending stiffness of the cross-section was found to be decreased. However, the relative ratio was less than 2%. Therefore, it was regarded that the equal-strength replacement had little impact on the bending stiffness of the component.
Experimental apparatus
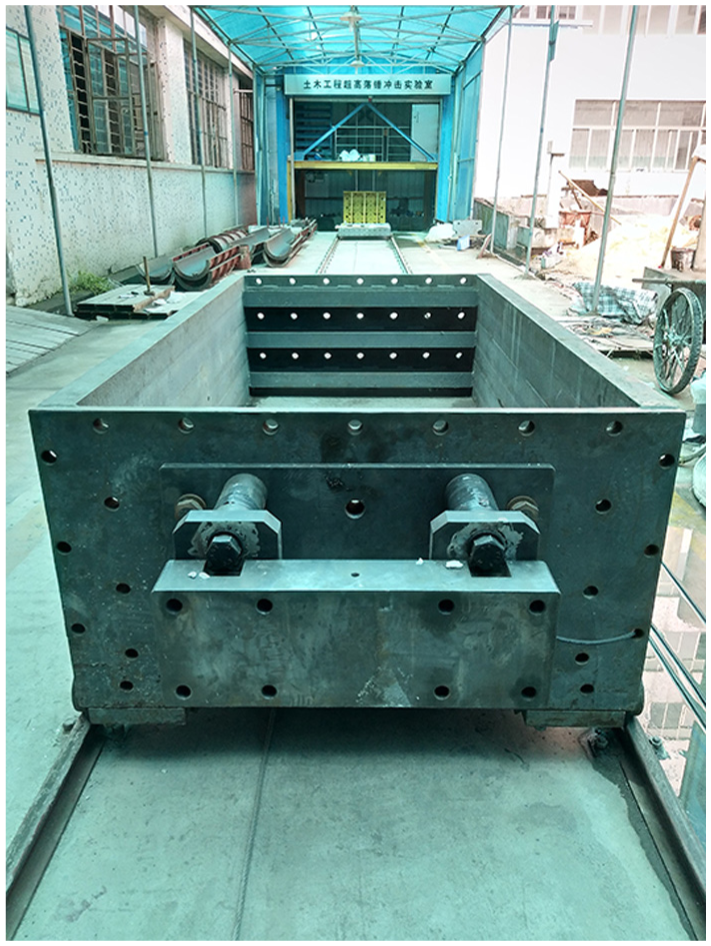
This study’s impact test was completed using an ultrahigh heavy drop hammer impact test machine, which was composed of a vertical drop hammer and a horizontal impact. The system could realize both vertical and horizontal impacts, as shown in Figure 1. The kinetic energy of the horizontal collision test car (hereinafter referred to as the car, as shown in Figure 2) was provided by the vertical hammer driving system (Figure 3). The test car was 2.08 m (L) × 1.15 m (W) × 0.64 m (H), and was equipped with a 590 mm (L) × 220 mm (B) rigid impact hammer in the front. There were four specially designed steel round cylinder installation pressure sensors located between the hammer and the car. The track was equipped with a laser speed measurement system at the end in order to measure the transient speed when the collisions occurred.

Multifunction super-high heavy hammer test machine system.
Horizontal traction impact test machine

Vertical drop hammer device.
The impact speed (kinetic energy) of the car was related to the lifting height and mass of the drop hammer, as well as the mass of the car. Among these, the maximum lifting height of the drop hammer was 18 m. Also, the mass variation scope of the drop hammer was between 166 and 1500 kg, and this study’s test selected 166 kg. The mass of the test car was 1200 kg, which could be changed through a counter-weight mass block. However, 1200 kg was selected for this test.
The pier specimen was fixed on a rigid base with four prestressed bolts prior to the test, which was approximately equivalent to the constraint of the fixed end. Then, 250 kN of axial pressure was imposed on the upper end of the column using an oil jack which was installed on the beam of the reaction frame, as shown in Figure 4. After installing the reinforced concrete specimen, an impact test was performed by lifting the drop hammer to the heights of 2, 4, 6, and 8 m, respectively. For all of the test items, the distance from the impact points to the column bottoms was 1100 mm (e.g. the center of the specimen). The equivalent design of the heights and locations of impact points was made in accordance with the location and distribution of the impact force which had resulted from ship-bridge collisions.

Impacted specimen.
Data acquisition
In this study’s experiment, the impact forces, reinforcement and concrete strains, specimen displacements, crack developments, and concrete damages of the two sets of specimens under horizontal impact-collision loads were collected. Among these, the impact force was measured using a pressure sensor placed on the front of the impacted car. The dynamic strains of the reinforcement and concrete were measured using a strain gauge. There were six steel strain gauges, and four concrete strain gauges, designed in this experiment, and their distribution is detailed in Figures 5 and 6. The lateral dynamic displacements of the specimens were measured using displacement meters. In this experiment, four displacement meters were designed on the specimens’ backs, from top to bottom, at 100, 800, 1500, and 2,100 mm (Figure 7). The concrete damages in the specimens’ major damage regions were tested using a ZBL-U520 nonmetal ultrasonic detector, For the specimen whose lower end was fixed, the upper part was subjected to axial pressure (reverse friction force), the maximum concrete damages occurs on the back side of the impact point and the impact direction of the clamped end, so in the experiment, 20 points in the impact area and the bottom area were detected. The entire collision process was recorded using a high-speed photography method.
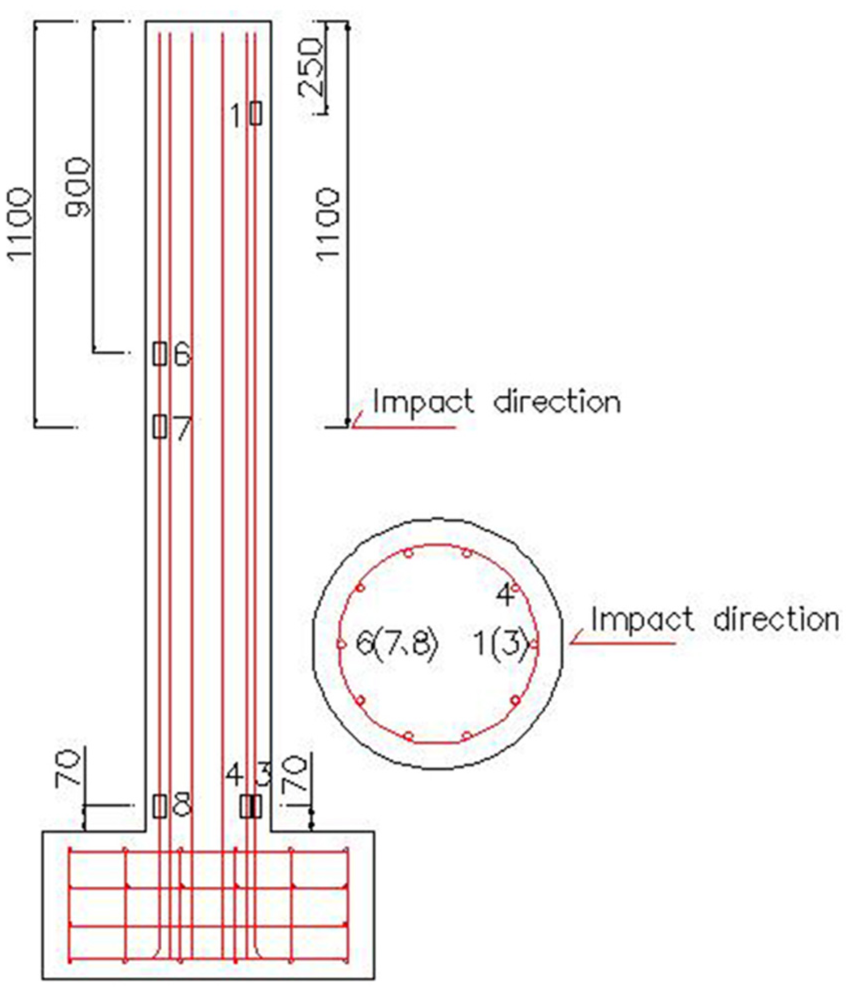
Reinforcement strain measuring points (mm).

Concrete strain measuring points (mm).

Displacement measuring points (mm).
Experimental results and analyses
A horizontal impact test was used to obtain the dynamic response data of the ordinary reinforced concrete piers, and the stainless reinforced concrete piers, following the equal-strength replacement under different impact energies. These mainly included the following: an impact time–history curve; displacement time–history curve; strain time–history curves of the steel reinforced and concrete piers; damage status in some parts of the specimens; and crack derivation and propagation. In order to compare the dynamic response of the two groups of specimens, the zero point of time is defined as the time when the car reaches the laser terminal of the orbit end, that is, when the acquisition system is triggered. In order to describe the dynamic response of the two groups of specimens more clearly, the appropriate abscissa (impact time) was selected to show the time–history curves under different working conditions.
Impact time-history curve
Figure 8 shows the impact time–history curves under the conditions of the drop hammer lifting to 6 and 8 m, respectively. It can be seen from the figure that, within a certain range, the original specimen had a consistent impact time–history curve, as well as an impact peak change trend similar to the equal-strength replaced specimen.
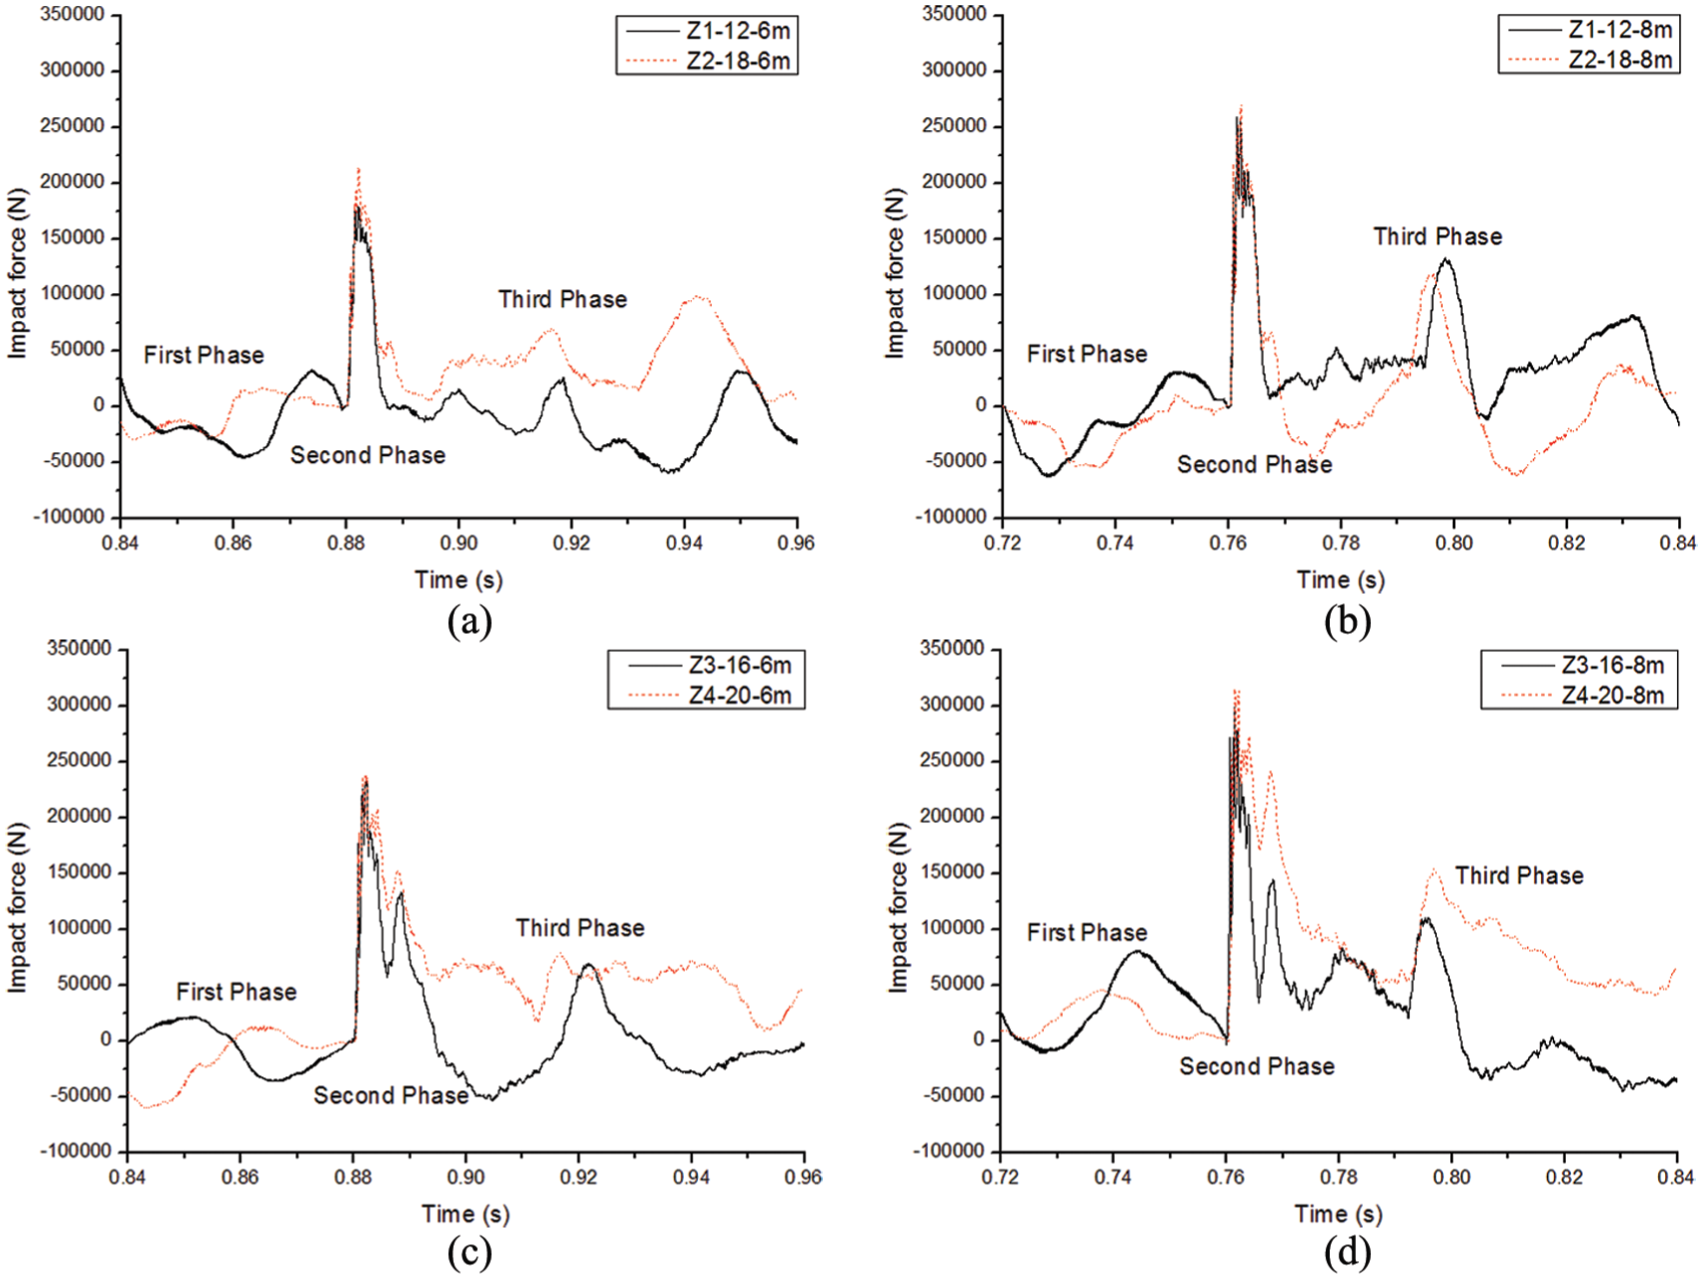
Impact time–history curve. (a) Impact force history of Z1-12-6 m and Z2-18-6 m. (b) Impact force history of Z1-12-8 m and Z2-18-8 m. (c) Impact force history of Z3-16-6 m and Z4-20-6 m. (d) Impact force history of Z3-16-8 m and Z4-20-8 m.
The time history of the impact force can be divided into three phases. The first phase is defined from the zero of time to the end of the first peak when the car is in contact with the impacted specimen, in this phase, the impact of the impact fluctuates near zero. It can be seen from the diagram that the height of drop hammer is different, and the time of the first phase is different; the time when the height of drop weight is 6 and 8 m is about 0.88 and 0.76 s, respectively. The second phase comes to the end of the first peak from the contact between the car and the impacted specimen, at the beginning of this phase, the impact force sharply increases, and the peak value of the impact force is mainly proportional to the impact velocity (or to the initial kinetic energy). Then, the impact force is gradually reduced to zero under the reacting force of the impacted specimen. In the third phase, the impact force fluctuates near zero and gradually stabilizes to zero.
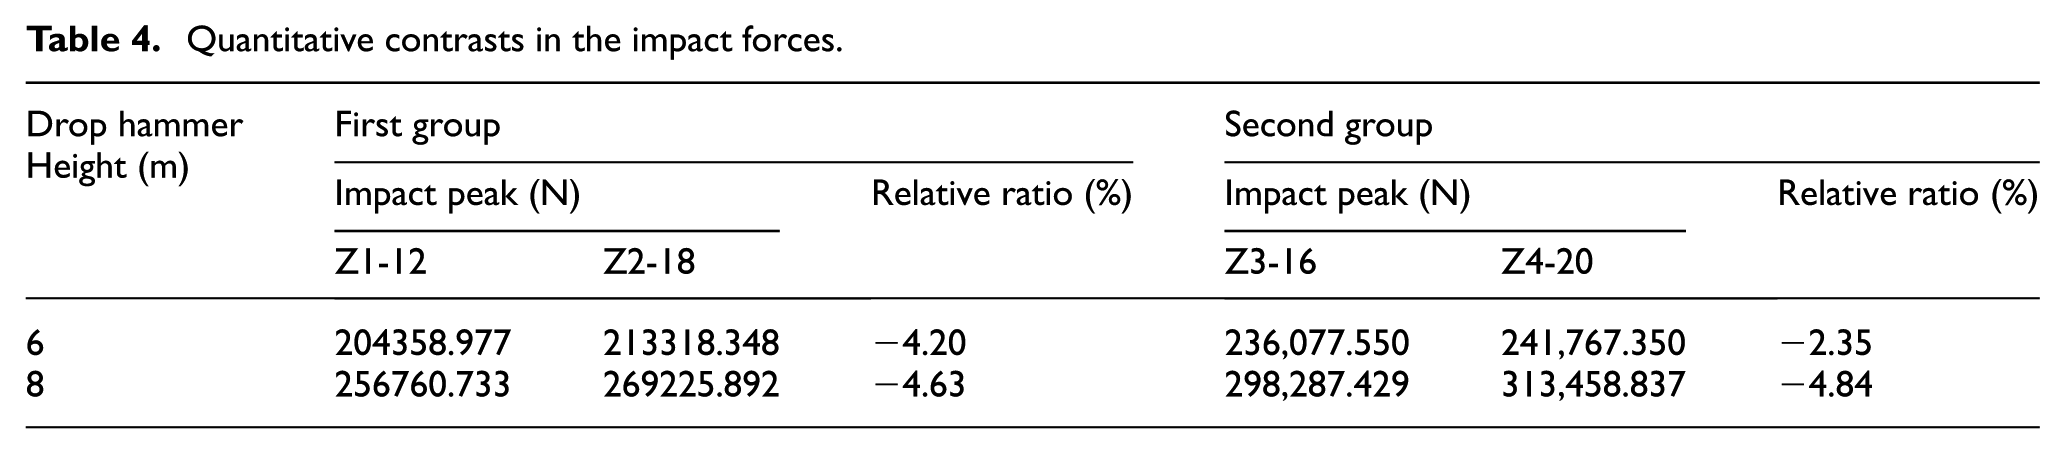
Table 4 shows that, under the same impact energy, the impact peak of the replaced stainless reinforced equal-strength concrete bridge piers had a relative ratio within the range of ±5%, in which the impact peak of the stainless-steel reinforced concrete specimens was determined to be slightly smaller than that of the ordinary ones. For example, when the drop hammer height is 6 m, the impact force peak of Z1-12 is 204358.977N, while the impact force peak of Z2-18 is 213318.348N. According to the impulse theorem, the impact force of Z1-12 specimen is longer. These results may have been due to the fact that the stainless-steel reinforcements had stronger strength and toughness, which improved the energy absorption capacities of the concrete specimens.
Quantitative contrasts in the impact forces.
Strain time–history curve
Figures 9 and 10 detail the strain time–history curves of the reinforced steel bar and concrete in this study’s horizontal impact test. It can be seen from the figures that the equal-strength replaced specimens had basically the same strain time–history curve and peak change trend as the reinforced steel bar and concrete. Like in the section “Impact time–history curve,” the strain time–history curves of the reinforced steel bar and concrete can also be divided into three phases, and the trend of each phase is similar to the impact time–history curve. In the first phase, the time when the height of drop weight is 6 and 8 m are also about 0.88 and 0.76 s, respectively. In addition, the peak value of the strain of the reinforced steel bar and concrete are mainly proportional to the impact velocity (or to the initial kinetic energy). Finally, the strain fluctuates near zero and gradually stabilizes to zero, too. It shows that the strain and impact force are synchronous, and the accuracy and reliability of the test system is also explained from the side.
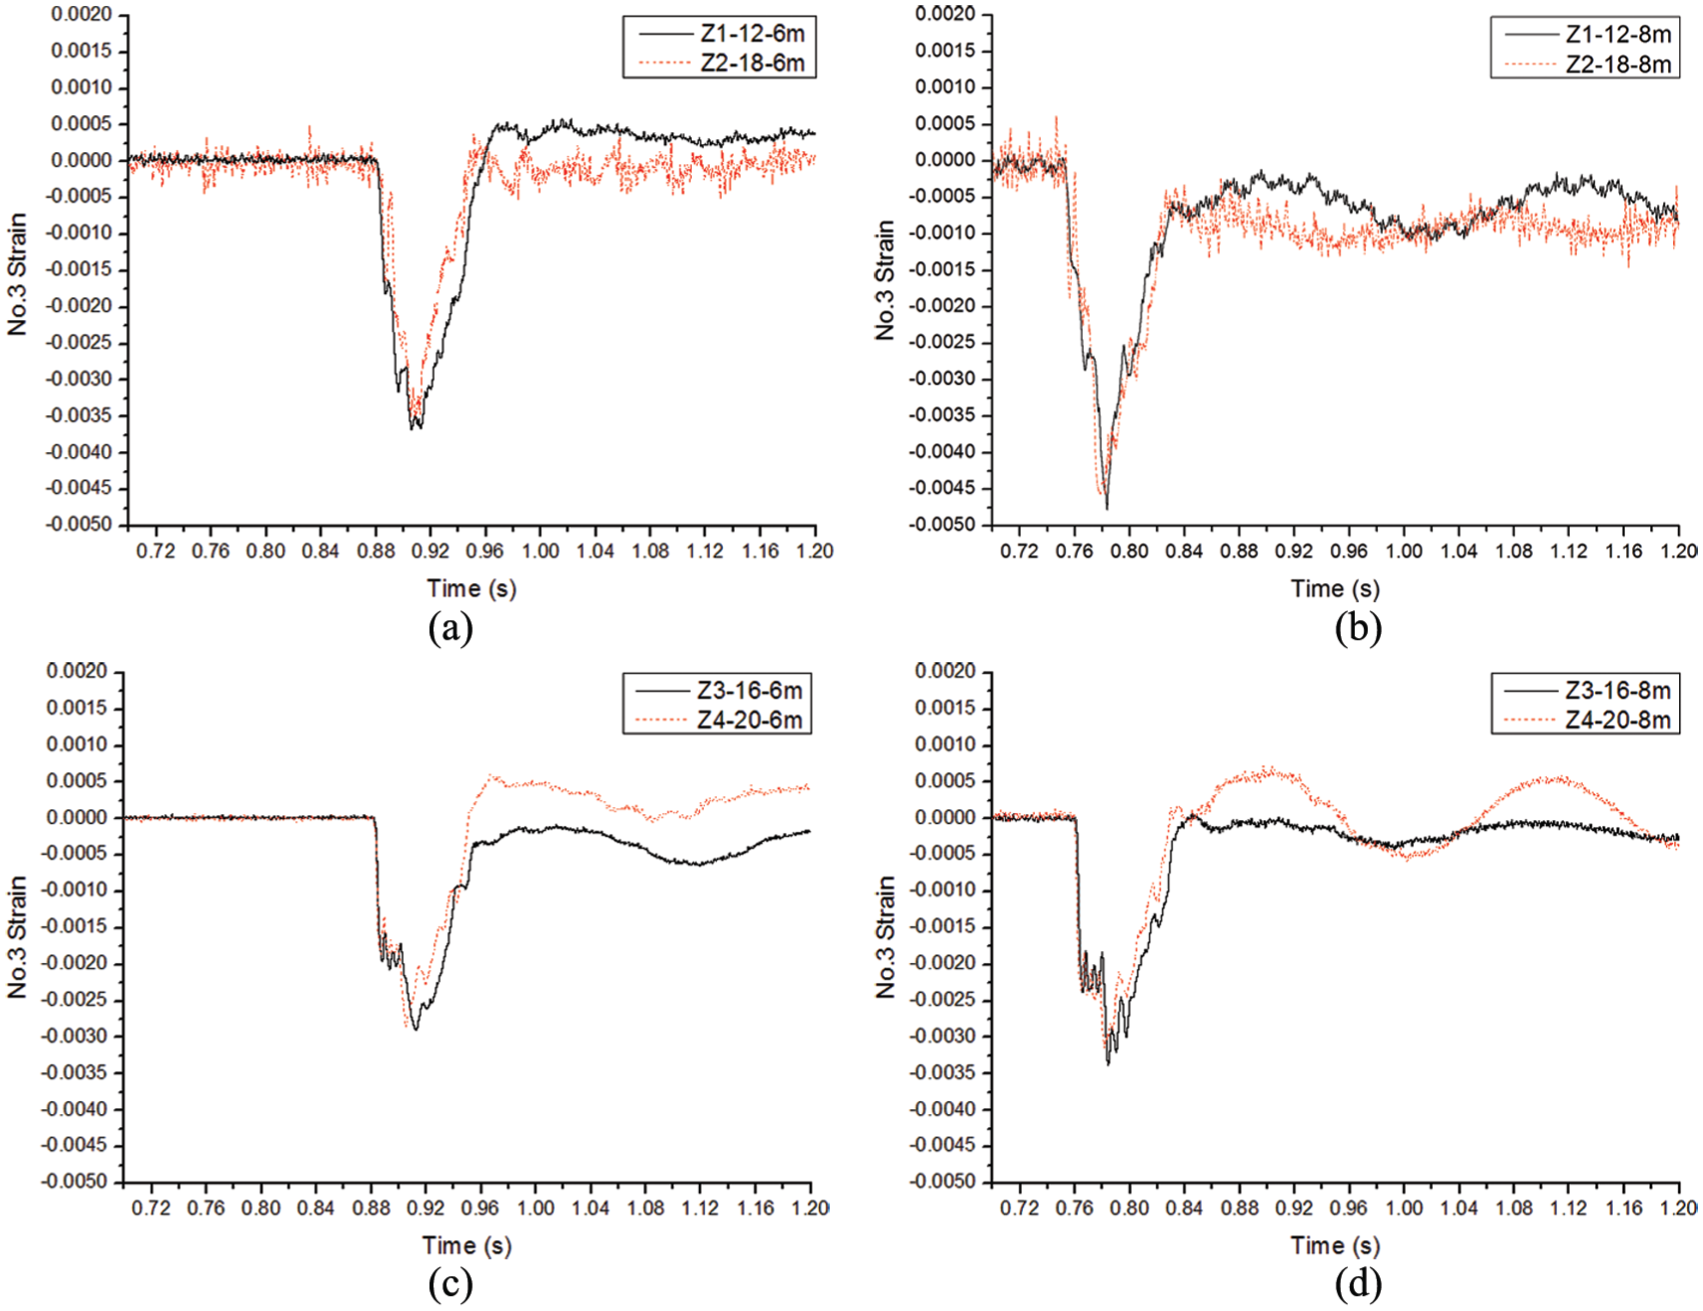
Strain time–history curve of the No. 3 steel bar. (a) No.3 reinforcement strain time–history curve of Z1-12-6 m and Z2-18-6 m. (b) No.3 reinforcement strain time–history curve of Z1-12-8 m and Z2-18-8 m. (c) No.3 reinforcement strain time–history curve of Z3-16-6 m and Z4-20-6 m. (d) No.3 reinforcement strain time–history curve of Z3-16-8 m and Z4-20-8 m.

Strain time–history curve of the No. 4 concrete. (a) No.4 concrete strain time–history curve of Z1-12-6 m and Z2-18-6 m. (b) No.4 concrete strain time–history curve of Z1-12-8 m and Z2-18-8 m. (c) No.4 concrete strain time–history curve of Z3-16-6 m and Z4-20-6 m. (d) No.4 concrete strain time–history curve of Z3-16-8 m and Z4-20-8 m.
According to Tables 5 and 6, the relative ratios of the steel reinforcement and concrete strain were both within the range of ±5%, both for the original specimen and the stainless reinforced equal-strength replaced specimen under the same impact energy.
Quantitative contrast of the reinforcement strain.

Quantitative contrast of the concrete strain.

Displacement time–history curves
Figure 11 shows the displacement time–history curves under the conditions of the drop hammer lifting to 6 and 8 m, respectively. Like the impact time–history curve in the section “Strain time–history curve,” the displacement time–history curves of the reinforced steel bar and concrete can also be divided into three phases, and the trend of each phase is similar to the impact time–history curve and the strain time–history curve. It can be seen that the displacement time-history curve, along with the displacement peak change trend of the equal-strength replaced specimen, were basically the same. Table 7 presents that, under the same impact energy, the relative ratios of the displacement peaks were within the range of ± 5% for the stainless reinforced equal-strength replaced concrete piers.

Displacement time–history curves. (a) Top displacement history of Z1-12-6 m and Z2-18-6 m. (b) Top displacement history of Z1-12-8 m and Z2-18-8 m. (c) Top displacement history of Z3-16-6 m and Z4-20-6 m. (d) Top displacement history of Z3-16-8 m and Z4-20-8 m.
Quantitative contrast of the displacement at the tops of the specimens.

Analysis of the cracks
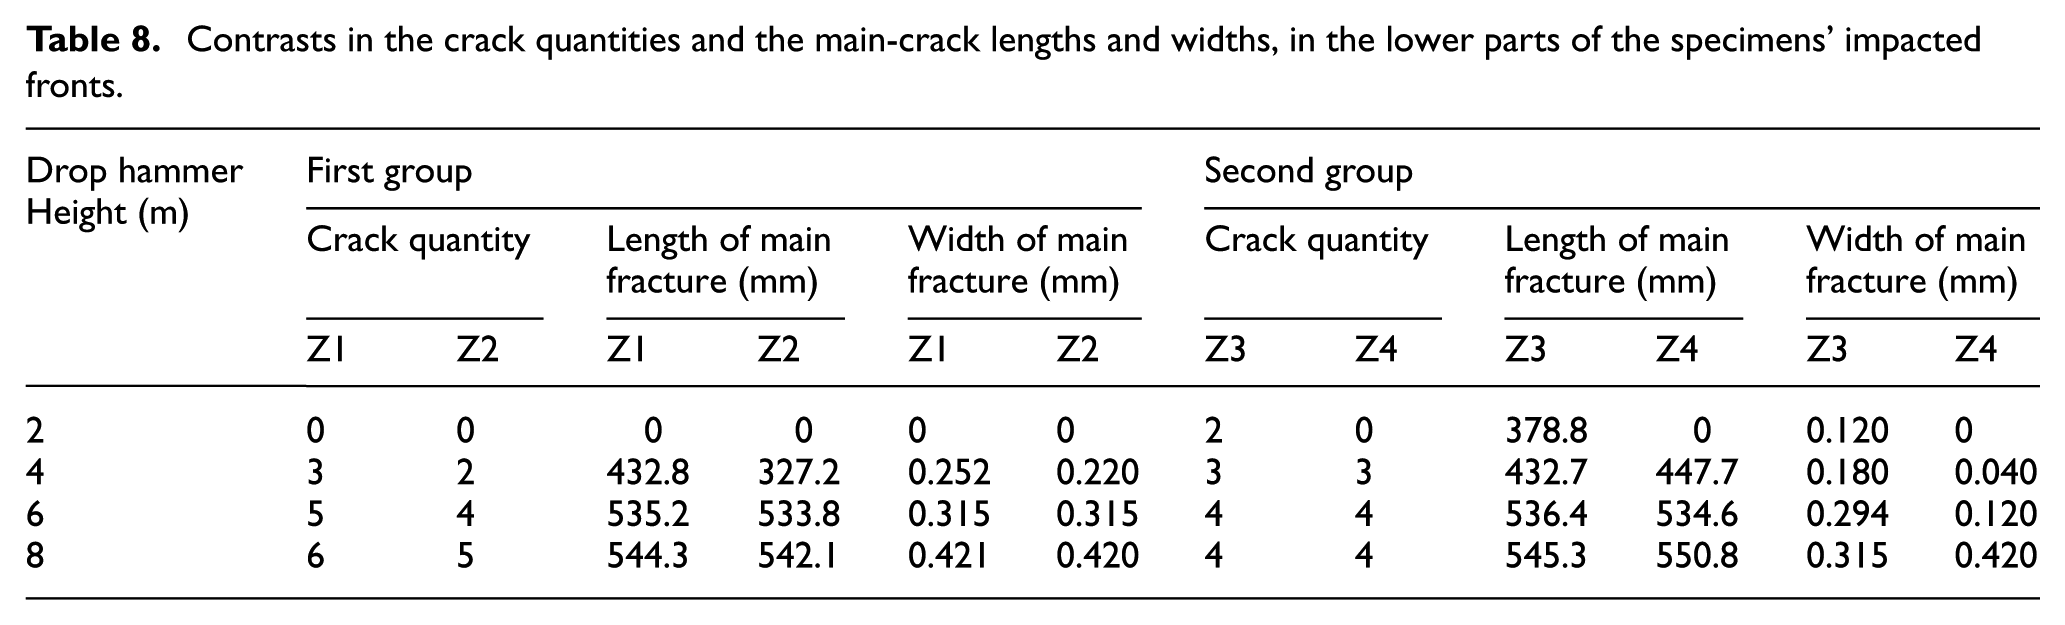
The cracks of the two sets of specimens were determined to all start to occur from the impacted bottom surfaces of the specimens. With the increased impact energy, regional cracks continued to derivate and propagate. Meanwhile, under certain impact energies, the cracks occurred and propagated in the central impacted surfaces of the specimens, and the impacted back areas which corresponded to the impact points. It was found that, when the impact energy reached a certain degree, large cracks occurred at the bottom of the impacted surfaces, and the concrete was partially crushed at the back areas of the impacts. The crack propagation characteristics were determined to be very consistent with the main force characteristics of the specimens. Figure 12 is the damage of the front and back bottom of the specimen after the impact test. Tables 8 and 9 show the crack quantities, lengths, and maximum widths in the lower part of the specimen fronts, and the upper parts of the backs of the specimens under the different energy degrees.

Post-impact damage of the front and back bottom of the specimen. (a) Z1-12. (b) Z2-18. (c) Z3-16 and (d) Z4-20.
Contrasts in the crack quantities and the main-crack lengths and widths, in the lower parts of the specimens’ impacted fronts.
Contrasts in the crack quantities and the main-crack lengths and widths, in the central parts of the specimens’ impacted backs.

From Figure 12, we can see that horizontal bending cracks occur at the bottom of each member’s impact surface, and the fracture patterns and failure modes are the same. These cracks are similar to typical bending cracks in nature, so the failure mode of members is bending failure. The concrete in the back compression zone is partially crushed and the main tendons are flexed. Some tensile steel will yield while some will not yield; according to the strain value of the steel bar in Table 5 with a height of 8 m and the stress–strain formula (
It can be seen from Tables 8 and 9 that, as the impact energies increased, the crack quantities, lengths, and widths of the equal-strength replaced specimens displayed consistent change trends. Also, under the same impact energies, the crack quantities, and main-crack lengths and widths were found to be approaching that of the stainless reinforced equal-strength replaced concrete piers.
In general, when the height of the drop weight is 8 m, the tensile steel of Z1-12, Z2-18 and Z4-20 specimens have been yielded, and the tensile steel bars of Z3-16 fail to yield, At the same time, from Figure 12 and Tables 8 and 9, it can be seen that the concrete damage at the bottom area of the Z3-16 specimen after the cumulative impact is lighter and the width of the crack in the bottom area is small, which indicates that Z3-16 has not reached the critical failure state in this test. For Z1-12, Z2-18, and Z4-20, the concrete damage in the bottom area of the specimen after the cumulative impact is serious and the width of the crack is large, showing that the specimen has exceeded the critical failure state. When the height of the drop weight is 6 m,
The analysis of the two groups of specimens shows that the critical impact energy of stainless steel reinforced concrete specimens is larger than that of ordinary reinforced concrete specimens with equal strength, at least 726J, which indicates that the impact resistance of the stainless steel reinforced concrete specimens is stronger, that is, the steel bars can be used to replace the ordinary steel bars in the bridge piers.
Concrete damage test
Table 10 shows the acoustic parameter values of the concrete damages close to the bottoms of the stainless reinforced equal-strength replaced specimens. It can be seen that, after the concrete damages occurred, the amplitude and frequency had no obvious change laws, while the acoustic velocity displayed significant change laws. After each horizontal impact, the value of the acoustic velocity became gradually reduced with the stability changes. Therefore, it could be used to determine the concrete damage conditions before and after the replacement. It was observed that, through several impacts with the same energy, the average acoustic-velocity change rates for Z1-12 and Z2-18 of the first group were −3.67% (i.e. the rate of change between the average sound speed before the first impact and the average sound velocity after the last impact) and −2.27%, respectively. Meanwhile, those for Z3-16 and Z4-20 of the second group were −2.84% and −2.78%, respectively. Therefore, it was determined that the acoustic-velocity change rates of the stainless reinforced equal-strength replaced concrete piers were relatively similar.
Acoustic parameter variations following the concrete damages.

Conclusion
In this research study, impact contrast experiments were carried out on two sets of stainless reinforced equal-strength replaced pier specimens, in order to analyze the specimens’ impact forces, strains, and displacement time–history curves, as well as the crack and concrete damages, and other dynamic responses, which occurred under the horizontal impact conditions. The main conclusions were as follows:
The stainless reinforced equal-strength replacements were found to display no impact on the vertical bearing capacities of the specimens. Since the relative ratio of the bending stiffness was less than 2%, it was considered that the equal-strength replacements had no impact on the bending stiffness of the component.
The original specimens and the equal-strength replaced specimens were found to have consistent impact forces, reinforcement and concrete strains, displacement time–history curves, and peak change trends. Under the same impact energies, the relative ratios of the impact peaks, reinforcement and concrete strain peaks, and displacement peaks were all within the range ± 5% for the stainless reinforced equal-strength replaced concrete piers.
Under the same impact energies, the impact crack quantities and distributions, as well as the concrete damages, were found to be approximately consistent for the stainless reinforced equal-strength replaced concrete piers.
In this study, based on the above conclusions, it was considered feasible to utilize stainless reinforced equal-strength replaced pier specimens for ordinary pier specimens. However, given the impact of test errors and structural reliability, it was suggested to increase the strength of stainless steel by 5% to 10% during the engineering designs of future equal-strength replacements.
Footnotes
Handling Editor: Nuno Maia
Declaration of conflicting interests
The author(s) declared no potential conflicts of interest with respect to the research, authorship, and/or publication of this article.
Funding
The author(s) disclosed receipt of the following financial support for the research, authorship, and/or publication of this article: The research described in this paper was sponsored by the Major Project (Natural Science) of Department of Education of Guangdong Province (2014KZDXM064), the Science and Technology Innovation Project of Department of Education of Guangdong Province (2013KJCX0188), and the Civil Engineering Technology Research Center of Guangdong Province.