
Abstract
In this study, stainless steel bars with the same diameter were used to replace ordinary stressed steel bars in reinforced concrete bridge piers. An ultra-high drop hammer impact test system was adopted for multiple horizontal impact tests on two groups of reinforced concrete bridge pier specimens. Based on the study results, it was determined that the maximum impact force of the stainless steel–reinforced concrete specimen, strain occurred in the steel bar and concrete, and the maximum displacement at the specimen’s top was found to be smaller than that before the same diameter replacement under the same impact energy. These results indicate that the stainless steel–reinforced concrete bridge pier specimen may have strong ductility, energy absorption abilities, and impact resistance under the impact load.
Introduction
Due to the fact that stainless steel exhibits superiority in strength, ductility, corrosion resistance, and maintenance costs,1–4 its use in replacing ordinary reinforced concrete (RC) structures has become a developing trend. At the present time, more than 3400 tons of stainless steel have been used in the Hong Kong–Zhuhai–Macao Bridge, which is currently under construction in China. It has been mainly used for the precast concrete pier shafts, tower bases, bearing pad stone, bearing platforms, and abutments of bridges. Researchers have carried out a great deal of theoretical and experimental research regarding stainless steel–reinforced concrete (SSRC) structures.5–16 Among these, the existing research studies regarding the corrosion resistance of SSRC structures9–11 have indicated that their corrosion resistance is somewhat higher than that of ordinary RC. The uniaxial tensile and low cycle test research on different types of stainless steel have been studied by Zhou, 12 and the results have shown that stainless steel displays strong ductility, along with a resistance to fatigue damage. A beam end cohesion test of SSRC was carried out by Michigan Technological University. 13 Also, an experimental study and nonlinear finite element analysis were performed on SSRC beams by S Alih and A Khelil 14 and the obtained model calculation results were found to be consistent with the experimental results. The beam and column seismic performance test of SSRC, which was conducted by Zhang et al.,15,16 determined that SSRC beams and columns have strong ductility, as well as energy dissipation capacities.
With the construction of various cross-river and cross-sea bridges, and the development of large-scale, rapid and specialized ships, accidents involving ships colliding with bridges have become increasingly frequent. The research regarding the performance of SSRC structures under the action of impact could potentially provide a basis for enhancing the impact resistance performance of SSRC structures. In recent years, researchers throughout the world have conducted a series of studies regarding RC structures under impact loads. Also, studies have begun on the mechanical performances of SSRC structures. Numerical research regarding the dynamic responses of RC columns under lateral impact loads has been conducted by Zhang et al. 17 Through experimental research, the influence of the reinforcement ratio on the lateral impact properties of RC columns has been analyzed by Feng et al. 18 Also, a series of experiments and theoretical studies on the dynamic response of steel tube concrete beams and columns under lateral impact loads have been performed by Ren et al. 19 and Wang et al. 20 The dynamic responses and damage assessment of RC columns under impact loads have been studied by Tian et al. 21 Researchers have also conducted extensive experimental testing of the impact resistance designs of RC beams.22–24 Numerical research regarding the impact resistance of RC axial compression columns under lateral impact loading has been carried out by Thilakarathna et al., 25 and experimental research has been implemented on the failure mode of RC beams under impact loads by Tachibana et al. 26 Remennikov and Kaewunruen 27 have conducted experimental research on the impact resistance of RC columns. M Goldston et al. 28 have carried out impact experimental research on glass fiber–reinforced plastic RC beams. S Aghdamy et al. 29 have conducted research on lateral impact response of concrete-filled double-skin tube columns using horizontal-impact-testing system. Wang et al.30,31 have implemented experiment on cement composite under impact loads. Han et al. 32 have carried out transverse impact research on high-strength concrete-filled steel tubes, and M Yousuf et al. 33 have conducted transverse impact test research on stainless steel tube concrete structures. At the same time, the impact resistance of SSRC columns still remains an open question. In this study, stainless steel bars with the same diameter of the RC bridge piers of the Hong Kong–Zhuhai–Macao Bridge were used to replace the ordinary reinforcement, which became the application case of this research study’s background. An ultra-high multifunctional drop hammer impact test system was applied for the experimental research of the dynamic response of SSRC bridge piers under an impact load. The results of this study could potentially provide valuable references for impact resistance designs, as well as the evaluations of SSRC bridge piers.
Experimental program
Design of the specimen
In this experimental study, four cylindrical specimen piers were designed, namely, two SSRC columns and two ordinary RC columns. The pier specimens were constructed from C40 concrete, with column section diameters of 340 mm, and column heights of 2200 mm. The experimental stainless steel bars were S2304 duplex stainless steel reinforcement bars, which were produced by UGITECH Co., France (UGIGRIP1.4362). The longitudinal reinforcement bars used in the ordinary RC bridge pier specimens were HRB335 reinforcement bars. There were 10 longitudinal reinforcements among the bridge pier specimens. The longitudinal steel reinforcements were symmetrical reinforcements in the direction of the circular cross section. In the bridge pier specimens, the stirrup was Grade-I HPB300 ordinary steel, with a diameter of 8 mm, and of a welding construction. The bridge pier specimen design parameters are shown in Table 1, and the steel material properties are shown in Table 2.
Design parameters of specimens.

S represents the stainless steel reinforcement.
Material properties of steel reinforcements.

Test device
This study’s experiment was conducted using an ultra-high drop hammer impact test system at the Foshan University Structures Laboratory. The test system consisted of two parts: a vertical drop hammer and a horizontal impact, as shown in Figure 1. By adjusting the vertical height of the drop hammer, the free fall of drop hammer could be used as the traction of a car with different motion rate levels. The mass of the drop hammer was 196 kg, and the impacting car body was 1.2 tons. The bridge pier specimen was fixed with high-strength bolts at the bottom, and the specimen’s top was imposed with 250 kN of vertical axis pressure, of which the axial pressure was provided by a jack connected with a sliding counterforce frame, as shown in Figures 2 and 3.

Ultra-high drop hammer impact test system diagram.

Horizontal impact test machine.
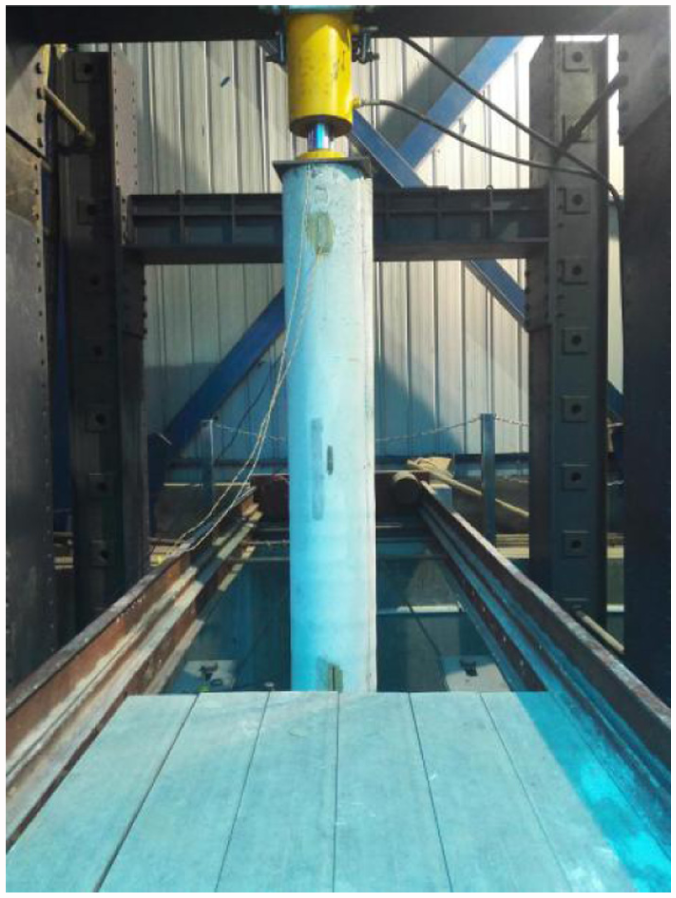
Bridge pier specimen.
Data acquisition
The main purpose of the test was to determine the dynamic response of the bridge pier specimen under a horizontal impact load. During the process of the test, the reinforcement strain, concrete strain, and specimen displacement were collected. According to the mechanical characteristics of the specimen, six reinforced strain gauges and four concrete strain gauges were arranged, as illustrated in Figures 4 and 5. Four displacement meters were arranged at 100, 800, 1500, and 2100 mm on the back of the specimen, from top to bottom.
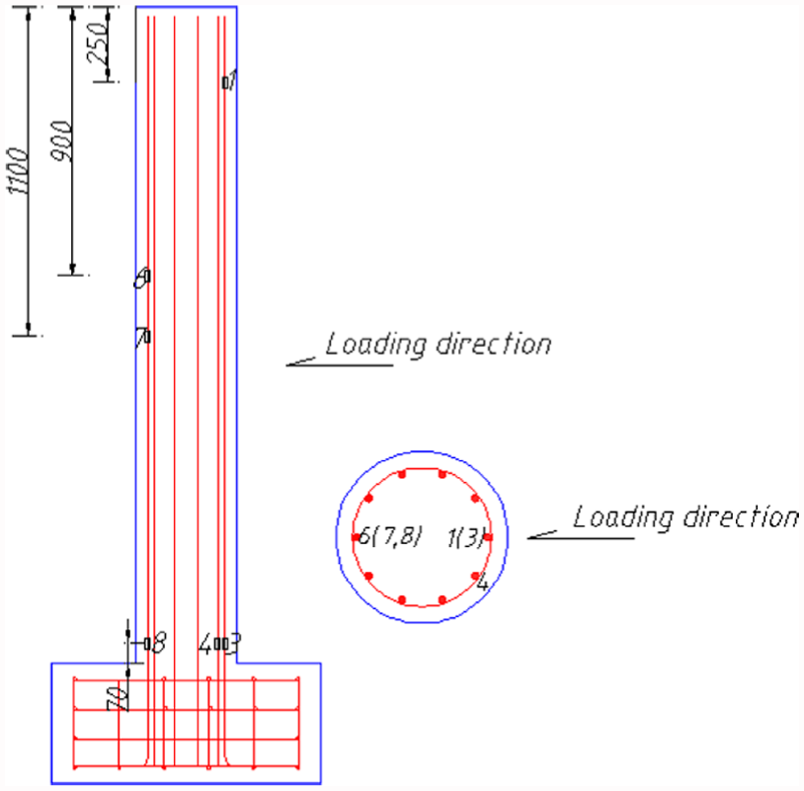
Details of the reinforcement strain measurement point (mm).

Details of the concrete strain measurement point (mm).
The drop hammer was lifted to a certain height and then released in order to track the car’s impact on the specimen. The impact velocity was obtained using a laser velocity measuring system set at the end of the track, and the impact force was measured using a pressure sensor set at the impacting car’s head.
Results and discussion
A horizontal impact test was applied to obtain the dynamic response of the SSRC bridge piers through the replacement of the ordinary RC bridge piers and the uniform section under different impact energies. This mainly included the impact time-history, displacement time-history, and steel concrete strain time-history curves.
Time-history curve of the impact force
Figures 6 and 7 show the impact force history curves of the drop hammer when it was lifted to 6 and 8 m, respectively. As viewed from the perspective of the impact curves before and after the replacement of the same diameter, these impact curves were approximately triangular complex curves, which were divided into the two stages of rise and drop. The collision process was very short, and the impact time history of each specimen twice underwent the processes of a quick uplift and then a rapid decline, before the impact was finally completely unloaded. During the impact process, when the impacting car initially contacted the specimen, the impact rose rapidly, which triggered the first peak. Then, the pier specimen was restored to a normal position before the second peak. Under the same impact energy, the change trends of the impact time-history curve before and after the replacement of the same diameter were roughly the same. However, the impact time was slightly different. With an increase in the impact energy, the impact peak of the specimen also increased. The impact peak of the ordinary RC bridge pier specimen (Figure 6) was 285.176 kN and that of the SSRC bridge pier specimen was 236.707 kN. As illustrated in Figure 7, the impact peak of the ordinary RC bridge pier specimen was 317.289 kN and that of the SSRC bridge pier specimen was 269.763 kN. As can be seen from the above data, under the same impact energy, the impact peak of the SSRC bridge pier specimen was lower than that of the ordinary RC bridge pier specimen before the same diameter replacement. This was mainly due to the fact that the stainless steel bars had high strength and toughness, which improved the energy absorption capacity of the concrete specimens.
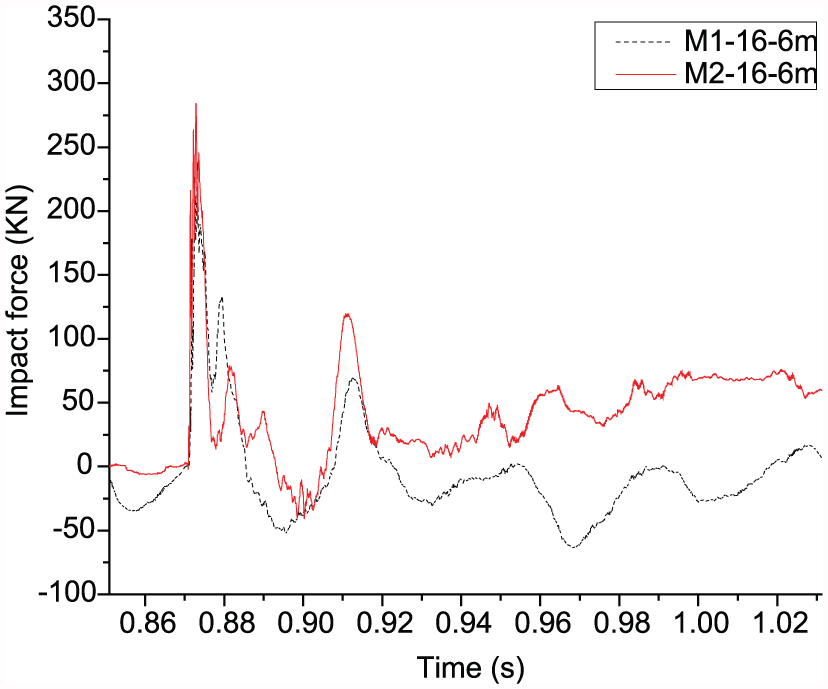
Impact force history of the M-16-6 m.

Impact force history of the M-16-8 m.
For each of the specimens, there were at least four recorded impacts according to the plan of the energy level ascension. For example, the drop hammer was lifted to 2, 4, 6, and 8 m, respectively, in order to track the car’s horizontal impact on each specimen. In this way, the velocities of each of the impacts, as well as the maximum impact force, were obtained. The data fitting of both were used to obtain the following relationship (Figure 8).

Relationship between maximum impact force and velocity.
As can be seen from the above four images, for each of the specimens, with an increase in the initial impact velocity, the impact forces were all increased. The correlation coefficient between the initial impact velocity of each specimen and the maximum impact force through one fitting reached 0.99 or more. Therefore, for each specimen, the initial impact velocity and maximum impact force could be approximated as a linear relationship.
Displacement time-history curve
The above diagram shows the top displacement time-history curves of the specimens before and after the replacement of the same diameter with a longitudinal reinforcement diameter of 16 mm, when the drop hammer was lifted to 6 and 8 m, respectively. It can be seen from the diagram that when the impactor began to contact the bridge pier specimen, the displacement curve rose rapidly. The start change time and maximum time of displacement curve were the same as the impact time-history curve, the ordinary RC specimen (Figure 9) reached a maximum displacement of 15 mm, and the SSRC specimen reached 13 mm. As illustrated in Figure 10, the maximum displacement of the ordinary RC specimen was 19 mm and that of the SSRC specimen was 17 mm. As can be seen from the data above, under the same impact energy, the maximal displacement of the ordinary RC specimen was found to be larger than that of the SSRC specimen. With an increase in the impact energy, the maximal displacement also increased. Furthermore, a residual deformation existed in the displacement of this measuring point before and after the replacement of the same diameter.

Top displacement history of M-16-6 m.

Top displacement history of M-16-8 m.
Strain time-history curve
During the horizontal impact test, the strain time-history curve of the specimen at each position is shown in Figure 11. It can be seen from the figure that, under this impact energy, the steel bar strain gauge was pulled at the position of the specimen where the steel yield occurred before the replacement of the same diameter. Meanwhile, after the replacement of the same diameter, the stainless steel bar remained in an elastic state at this position. Figure 12 shows the strain time-history curve of the #8 steel under the impact energy, and the position of the #8 strain gauge on the specimen’s impact back corresponded to the position of the steel bar strain gauge as illustrated in Figure 11. It can be seen from the diagram that the start time and duration of the steel strain began to change until the recovery was roughly the same as the #3 steel strain, which was consistent with the occurrence time of the #3 steel strain shown in Figure 11. For example, the tensile start of the #3 steel was consistent with the #8 steel until the recovery. When the #3 steel strain reached the maximum, the #8 steel strain also reached the maximum, which was consistent with the theoretical stress state of the specimens. It can be seen from Figure 13 that the two specimens were impacted with the same energy. Also, the impact occurrence times and durations were roughly the same, and these were almost synchronous from the change start to the maximum. Prior to the impact, the steel strain curve fluctuated near the zero value, while at the moment of impact, the steel strain time-history curve reached the peak quickly at this position. Following the impact, the strain time-history curve returned to near zero. Figure 14 shows the concrete strain time-history curve at the lower part of the specimen’s back, where the position of the strain gauge was slightly different from the #8 steel bar strain gauge. It can be seen from the figure that the changes in the concrete strain value were consistent with the change frequency of the #8 steel strain value, and the change start time was the same. When the #8 steel strain reached the maximum, the concrete strain also reached the maximum. Then, after a certain amount of time, the impact returned to near zero. The above strain curve was an approximately triangular complex curve, and the strain changes in the SSRC specimen were basically the same as in the ordinary RC specimen. However, the strain maximum of the SSRC specimen was lower before the replacement of the same diameter, which was mainly due to the stainless steel’s high ductility and energy absorption abilities.

The #3 reinforcement strain time-history curve.

The #8 reinforcement strain time-history curve.

The #3 reinforcement strain time-history curve.
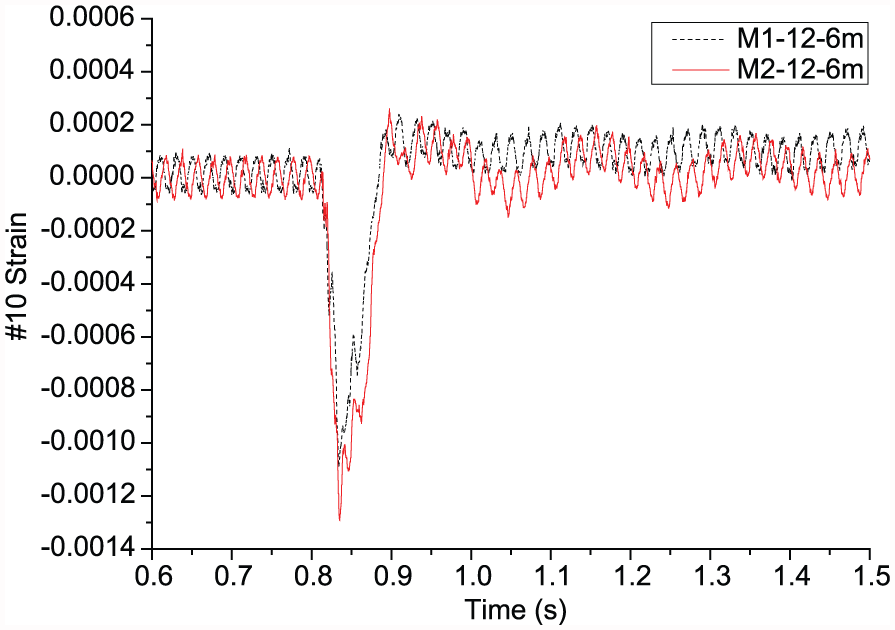
The #10 concrete strain time-history curve.
Conclusion
With an increase in the impact energy, it was found that the impact peak of each specimen gradually increased. However, under the same impact energy, the maximum impact of the SSRC specimen with an equal diameter was found to be about 16% lower than the ordinary RC specimen.
With an increase in the impact energy, the peak displacement of the pier specimen also increased. Also, under the same impact energy, the displacement peak of the SSRC specimen after the replacement of the same diameter was found to be about 13% smaller than that before the replacement of the same diameter.
For each of the specimens, the initial impact velocity and maximum impact force could be viewed as a linear relationship. Meanwhile, for the different specimens, with an increase in the initial velocity, the change rate of the maximum impact force required massive impact research testing.
Footnotes
Academic Editor: Filippo Berto
Declaration of conflicting interests
The author(s) declared no potential conflicts of interest with respect to the research, authorship, and/or publication of this article.
Funding
The author(s) disclosed receipt of the following financial support for the research, authorship, and/or publication of this article: This work was supported by the Major Project (Natural Science) of Department of Education of Guangdong Province (2014KZDXM064), the Science and Technology Innovation Project of Department of Education of Guangdong Province (2013KJCX0188), and the Civil Engineering Technology Research Center of Guangdong Province.