
Abstract
Polycrystalline diamond compact bits are one of the most widely used oil and gas drilling tools in the world. With wear, a large unbalanced lateral force and bending moment exist. These force and moment contribute not only to bit lateral vibration and whirl but also to wellbore tilt and enlargement, which will then cause early bit failure and low drilling efficiency. In this article, considering wear condition, a single cutter force model is proposed. Lateral force and bending moment models are constructed based on space-force theory. An optimal cutter layout model considering cutter wear is established. The matching approach for the optimal model is discussed based on Kriging surrogate model and genetic algorithm. Then, an optimization case is presented. The results show that the bit force models are in line with the actual drilling condition. The optimal approach is efficient. After optimization, the lateral force to weight on bit ratio is reduced by 10.99%, and the bending moment to torque on bit ratio is reduced by 30.43%. This result is a significant improvement in the force condition and stability of the polycrystalline diamond compact bit; ultimately, the whirl and tilt motion can be reduced, and the drilling efficiency can be improved.
Keywords
Introduction
Polycrystalline diamond compact (PDC) bits are widely used to drill wells for the exploration and exploitation of hydrocarbons because of their high rock-breaking efficiency. The PDC bit is composed of a matrix body, flute, blades, individual cutting teeth and so on. To date, PDC bits have comprised 75%–80% of the global market. 1
The PDC bit is mainly affected by two forces and two moments during the drilling process: weight on bit (WOB) Fw, lateral force Fl, torque on bit (TOB) Mt and bending moment Mb, as shown in Figure 1. Fw and Mt drive the PDC cutters to break rocks. Meanwhile, a PDC bit is subjected to Fl and Mb caused by the bit–rock interaction. Fl and Mb are perpendicular to the drilling direction, and they only impede rock breaking. A large unbalanced Fl is the main cause of bit whirl. In addition, Mb contributes not only to bit lateral vibration or whirl but also to wellbore enlargement and tilt. Whirl and tilt motion will cause early bit failure and low drilling efficiency.

The forces on a PDC bit.
To improve the PDC bit life and drilling efficiency, the studies of reducing the lateral force and bending moment have been carried out in recent decades. In the 1990s, the method of reducing the lateral force by changing the cutter layout was put forward to enhance the bit stability, and these bits are called ‘force-balanced’ PDC bits.2,3 The concept of a ‘global force-balanced’ bit was proposed in 2005. These bits have balanced or minimal lateral forces and bending moments. 4 Global optimization algorithms, such as particle swarm optimization (PSO) and genetic algorithms (GAs), have been used to design the cutter layout structure of ‘force-balanced’ PDC bits.5,6 A grouping cutter layout method was proposed to keep the lateral force balanced under transit drilling conditions. 7 Based on the aforementioned research, multilevel force-balanced drilling tools and methods are researched. The PDC bit will be in a good force state during the drilling process when the ratio of Mb to Mt is less than 4%, and the ratio of Fl to Fw is less than 4%. 8 A general approach of backup cutter layout to extend bit life without sacrificing rate of penetration was discussed. 9
The aforementioned studies have greatly improved the drilling performance of PDC bits. However, in those studies, the wear of a PDC bit is not considered in the process of cutter layout design, and the specific computing methods for reducing Mb are not mentioned. In fact, most PDC bits cannot maintain the global force-balanced state with cutter wear, which is one of the important factors restricting the rock-breaking efficiency and stability of PDC bits. In addition, a bit wearing is a normal state during drilling, and it is not reasonable to design a ‘global force-balanced’ bit without considering wearing conditions.
In this article, an optimal design of the global force-balanced PDC bit considering wear condition is carried out to improve drilling performance of a wear PDC bit and to achieve the balance state of lateral force and bending moment at the same time.
Development of bit force models
Single cutter force model
Existing single cutter force model
Single cutter force models can be divided into two-dimensional (2D) cutter force models (Figure 2(a)) and three-dimensional (3D) cutter force models (Figure 2(b)). The 2D cutter force model usually considers the effect of the back rake angle α, which is defined as the acute angle between the cutter surface and axis OZ (same as the drilling direction). The cutter is subjected to cutting force fc and penetration force fp during rock breaking. fc and fp are parallel to axis OY and axis OZ, respectively. Axis OY is the direction of the cutter movement.

Single cutter force models: (a) 2D single cutter force model and (b) 3D single cutter force model.
Most single cutter force experiments are based on the 2D single cutter force model. Cheatham and Daniels first performed a series of tests on the drillability of PDC cutters. They concluded that the cutting force fc is proportional to the cutting area. 10 Detournay and Defourny developed the cutter force model, which divides the cutter/rock interaction into two processes: rock cutting and frictional contact. By combining these two processes, a relationship between specific energy (E) and drilling strength (S) is obtained. This model is called the E-S model. 11 The E-S model is complemented by introducing characteristic contact length and contact strength. Contact length is an objective measure of bit bluntness, and contact strength is the maximum stress that can be transmitted at the cutter wear flat–rock interface. 12 Considering the wearing condition, the effects of the wear height, angle α, cutting area, and cutting arc length on the cutter forces were researched by systematic experiments, 13 and the cutter force model was determined to be

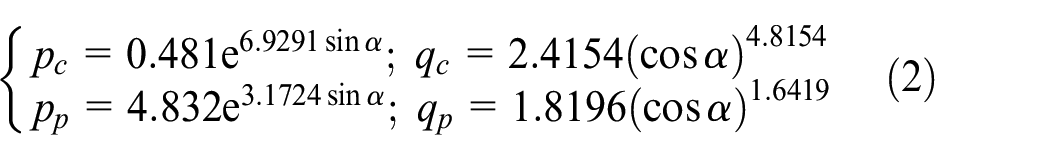
In equations (1) and (2), d is the diameter of the cutting teeth. K represents the rock drillability. A represents the cutting area which is the contact surface of the rock and cutter (the sand texture in Figure 3). Besides, the yellow zones in Figure 3 represent the cutting surface of cutter with no contact rock. L is the cutting arc length, which represents the part of the cutting tooth that is in contact with the rock during drilling (Figure 3(a)). Le represents the equivalent arc length when the area of the ordinary cutting surface is equal to that of the standard cutting surface (Figure 3(b)). hw represents the wear height of the cutting teeth (Figure 3(c)).

Cutting parameters of cutters: (a) ordinary cutting surface, (b) standard cutting surface and (c) wear height.
However, the aforementioned experimental studies lack the parameter of side rake angle β, which is defined as the acute angle between the cutting tooth surface and axis OX, as shown in Figure 2(b). This omission will result in the inaccuracy of the force model of the PDC bit.
When considering side rake angle β, the cutter is subjected to three forces, fc, fp and fl, whose directions are parallel to OY, OZ and OX, respectively (Figure 2(b)). At this point, the single cutter force model is 3D, and it more closely represents actual drilling conditions. The influence of the angle β, cutting depth, and rock properties on the cutter forces is studied by a series of experiments, and the test results show that angle β has no significant effect on forces fc and fp. Force fl approximately linearly increases with angle β. 14 Chen et al. 15 believe that the cutting force model is related to the cutting area shape which can be divided into three types. Shi 16 concluded that there is a linear relationship between the three forces fc, fp and fl as expressed in equation (3). However, the existing 3D single cutter force models are relatively rough since it does not consider the wear factor of cutters

where C1 and C2 are constants determined by the rock properties and angles α and β.
A new single cutter force model
According to equations (1) and (2) and some conclusions of the existing 3D cutter force model, a new 3D single cutter force model is proposed, as shown in equation (4)

In equation (4), force fl increases with angle β linearly, and it is 10% of force fp when angle β is equal to 30°. 16 The forces fp and fc describe the deformation in equation (1).
This 3D single cutter force model (equation (4)) is more comprehensive and accurate than the 2D model because the parameters of back rake angle, side rake angle, cutting arc length, cutting area, rock property, and wear degree are all considered.
Lateral force model of PDC bit
Based on the new single cutter force model, the lateral force model is established in this section. The cylindrical coordinate system ORΘH, whose axis OH is the centre axis of the PDC bit and parallel to the drilling direction, is established as shown in Figure 4(a). The axial component force fa (parallel to axis OH), cutting component force f′c (circumferential force) and radial component force fr (pointing towards axis OH along radial direction form cutter centre) in the coordinate system ORΘH can be obtained by decomposition and synthesis of the forces fp, fc and fl on a single cutter.

Force model of a single cutter on a PDC bit: (a) cutter force model in the cylindrical coordinate system ORΘH, (b) force analysis in plane M and (c) force analysis in plane N.
First, make plane M through the cutter centre and axis OH. Make plane N perpendicular to the axis OH and through the cutter centre, as shown in Figure 4(a). Then, only fp and fl exist, as shown in Figure 4(b), because f′c is perpendicular to plane M. Create a Cartesian coordinate system OR′H′ in the plane M. Axes OR′ and OH′ are the reverse directions of axes OR and OH, respectively. Forces fp and fl can be decomposed into axes OR′ and OH′ with equation (5) for both the inner cone cutter and outer cone cutter

In Figure 4, the axial component force fa can be obtained by adding fa1 and fa2. The radial component force fr can be obtained by the superposition of forces fr1 and fr2. The cutting component force f′c is the same as the cutting force fc because both of them are aligned with the cutting direction. At this point, the forces fa, f′c and fr in the coordinate system ORΘH can be expressed as

where γ is the normal angle of the cutter on a PDC bit.
Then, the WOB Fw and TOB Mt can be expressed as

where Nc is the amount of cutting teeth on the bit, and i is the serial number of cutters from the bit centre to the edge.
To obtain the lateral force Fl of the PDC bit, the forces fa, f′c and fr need to be decomposed and synthesized in plane N, as shown in Figure 4(c). Among them, fa can be ignored because it is perpendicular to plane N. Establish a Cartesian coordinate system O′XY, whose O′X direction is the same as axis OR. f′c and fr can be decomposed into axes O′X and O′Y

where θc represents the angle between plane M and plane ORH and is named the circumferential angle.
Then, the lateral force Fl can be represented by equation (9)

The circumferential angle θs of Fl is slightly different in different quadrants, as shown in equation (10)

Bending moment model of a PDC bit
To date, there have been no public reports on the calculation of the bending moment for PDC bits. To optimize the cutter layout design for a global force-balanced PDC bit smoothly, the bending moment model of a PDC bit is discussed in this section based on space-moment theory.
Moment of force about a point
In the space-force system, the orientation of the rotation axes, which is perpendicular to the moment plane and cross the centroid, is different because the lines of action of all the forces are not in a plane. As shown in Figure 5(a), the resultant moment of forces

Moment of force about a point in space force system: (a) The moment of forces
Take force

Figure 5(b) shows the unit vectors
Combining equations (11) and (12),

Set n forces in the space-force system:

where (x(m), y(m), z(m)) and (Fx(m), Fy(m), Fz(m)) are the projections of the mth
Then, the resultant moment
Development of the bending moment model
For a PDC bit with Nc cutters, the force state

where Hc is the axial position of the centre point of the cutter and X(i) represents the parameter X of the ith cutter (X can be

Moment of a PDC bit.
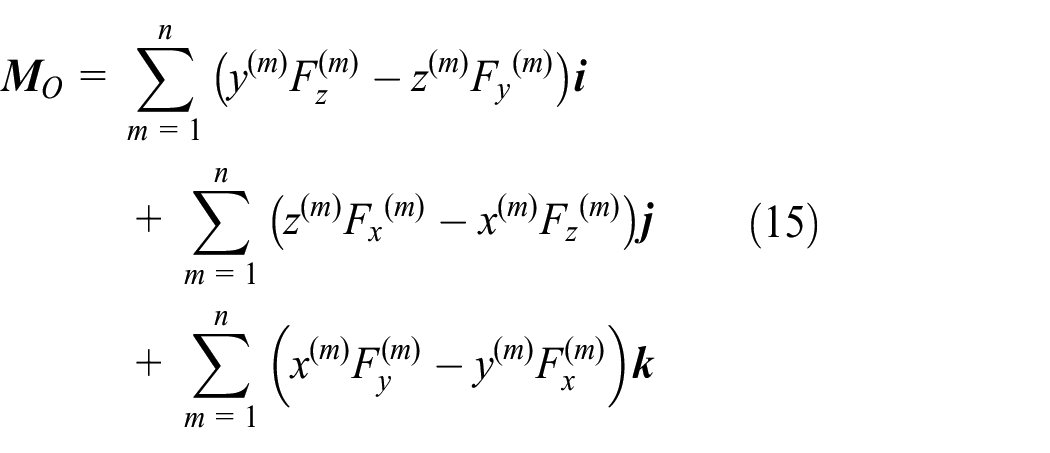
According to equation (15), the resultant force moment

In equation (17),
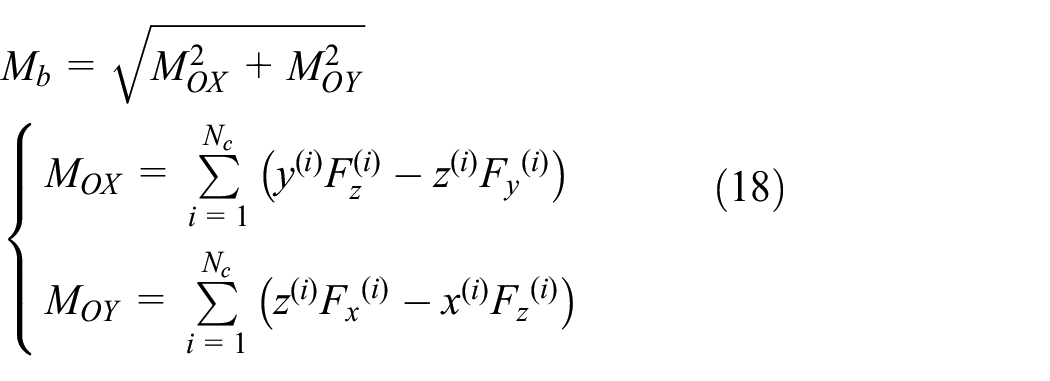
The bending moment Mb of the PDC bit is related to only MOX and MOY, since the direction of the bending moment B is perpendicular to MOZ. Mb can be expressed by equation (18)
There are unknown parameters fc, fr and fa in the lateral force model (equation (9)) and bending moment model (equation (18)). According to equations (4)–(6), fc, fr and fa are functions of the wear height hw, cutting area A and cutting arc length L.
Given the cutter layout parameters and drilling parameters of a PDC bit, cutting area A and cutting arc length L can be obtained by the zero-point traversal (ZPT) method. 17 Wear height hw can be expressed by equation (19), which can be solved by iterative computations based on abrasive wear theory 18

where
Experimental verification
To verify the correctness of the new single cutter force model (equation (4)), a rock-breaking test for PDC bits A and B is carried out as shown in Figure 7. The two bits have the same structure, except for the blade angle and back rake angle. The diameter of each bit is 100 mm and the number of cutter is 6.

Experimental PDC bits.
The WOB FW and lateral force Fl of the bits during rock breaking are mainly tested. The drilling rate is set 30 r/min, and the rock is sandstone.
Test equipment and principle
The test equipment mainly includes micro-bit rock-breaking machine, resistance strain gage, signal line, DH5923N dynamic signal analysis instrument, pressure sensor, and so on, as shown in Figure 8.
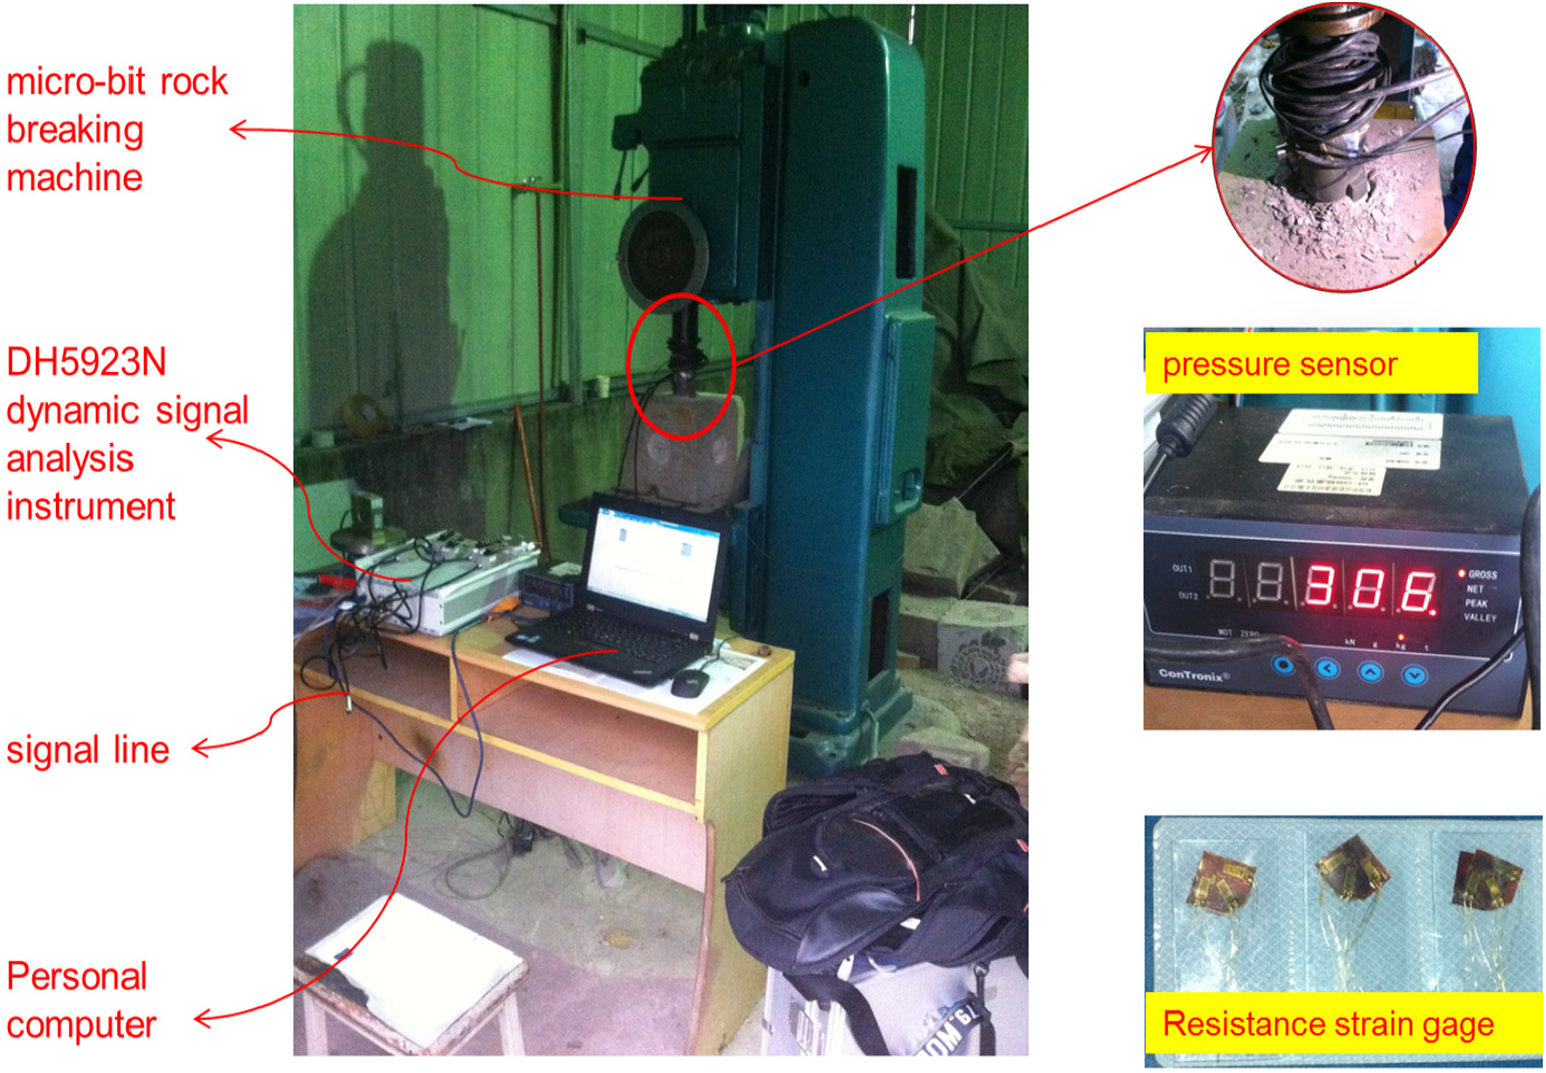
The main experimental equipment.
Figure 9 is the test schematic of bits forces during rock breaking. The test is completed on a micro-bit rock-breaking machine (No. 1 in Figure 9). The power source (No. 2) of the micro-bit rock-breaking machine provides a certain speed and WOB to drive the bit (No. 4) breaking rock (No. 5), and the rock is fixed by a holding device (No. 6). The test component (No. 3) attached to the bit converts the stress signal into an electrical signal. Then, the electrical signal is communicated to the DH5923N dynamic signal analysis instrument (No. 10) through the signal line (No. 8) and modulator (No. 9). The electrical signal is further processed and converted by DH5923N dynamic signal analysis instrument. At last, the personal computer (PC) (No. 12) picks up the signal by network cable (No. 11) from DH5923N dynamic signal analysis instrument. The forces conditions of PDC bits during drilling can be obtained by PC analysis.

Test schematic of bits forces.
Test results
The lateral forces and WOB of bits A and B are obtained from the test. There are eight groups of data: lateral forces of unworn PDC bits A and B; lateral forces of wear PDC bits A and B; WOB of unworn PDC bits A and B and WOB of wear PDC bits A and B, as shown in Figure 10. The lateral forces of both bits increase after bits wear. However, the WOB of both bits almost keeps unchanged.
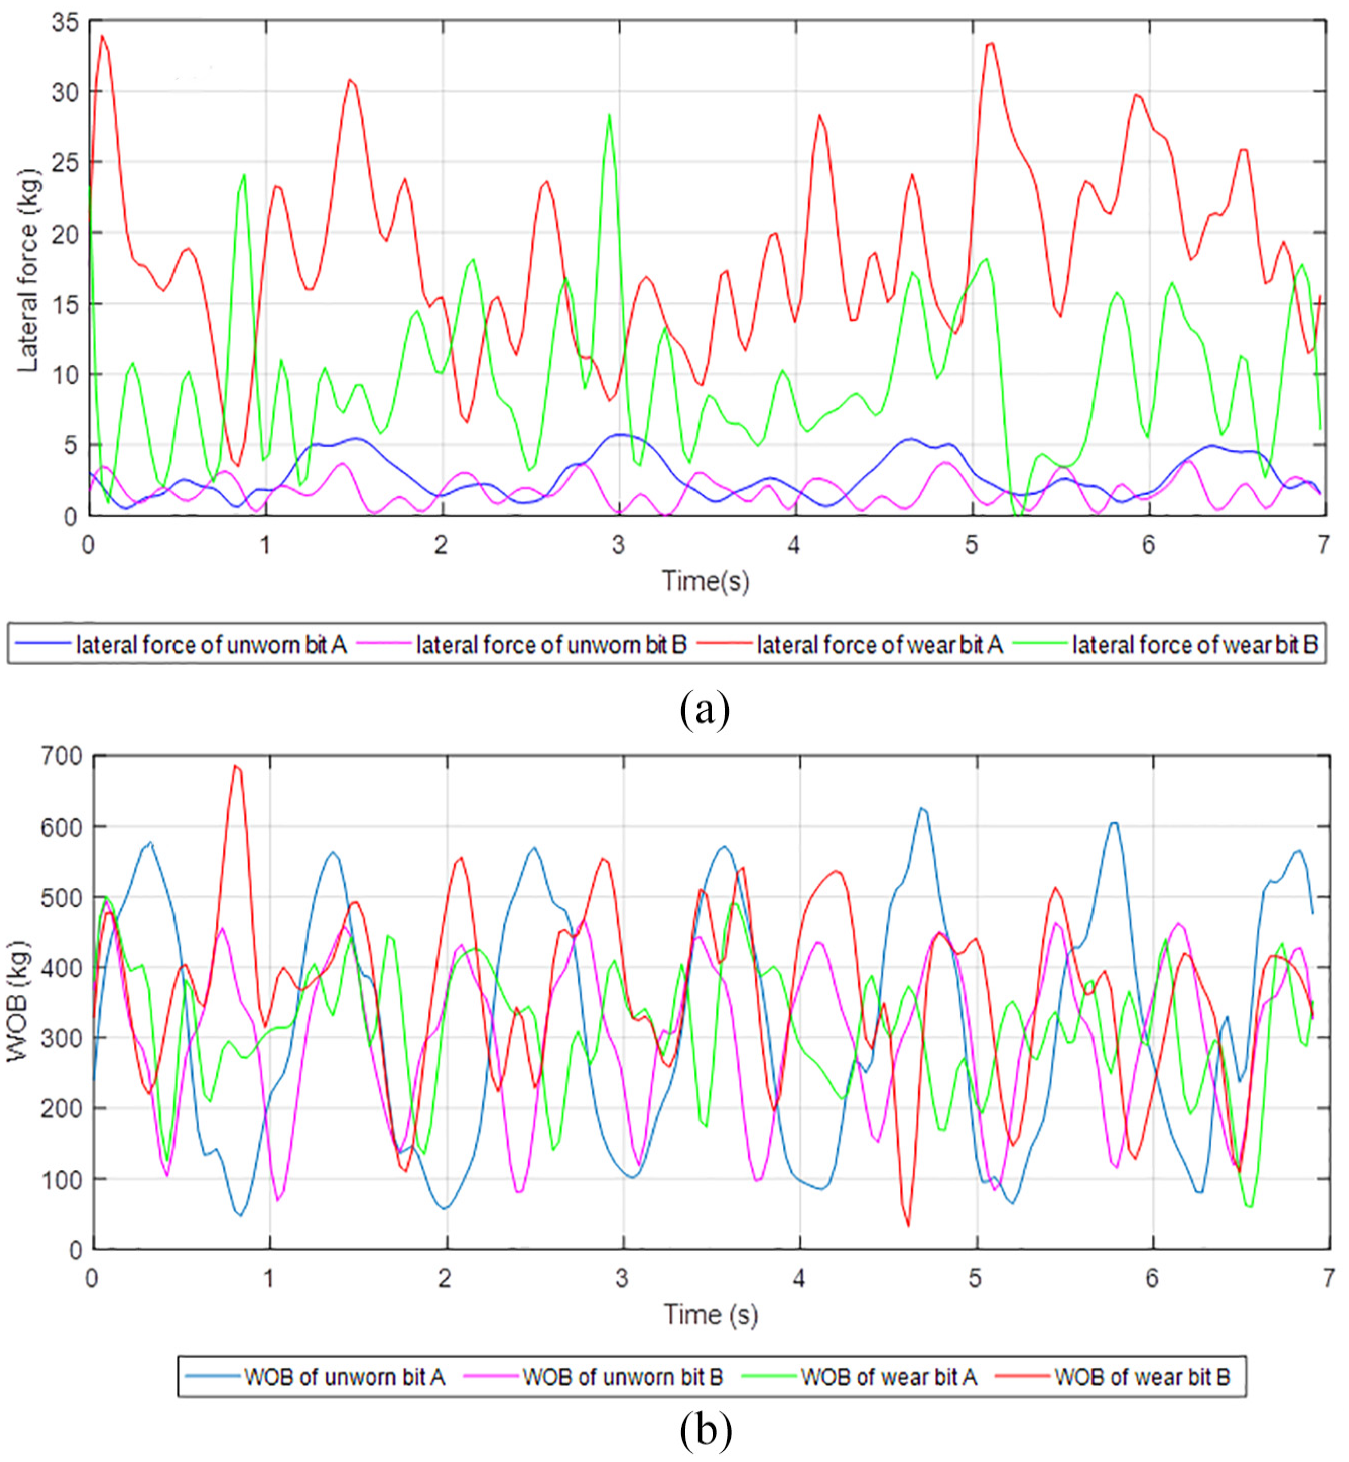
The lateral forces and WOB of bits A and B: (a) lateral forces of bits A and B under different wear condition and (b) WOB of bits A and B under different wear condition.
The calculated force values of the bits A and B can be obtained based on the established force model (equations (4)–(9)). Compared with the mean values of the test data, the maximum calculation error of forces on PDC bit is 11.2%, and the mean error is 6.45% as shown in Table 1. Therefore, the bit force models established in this section have a small error and can be used as the basis for future research.
The error of the calculated value compared with measured value.

Optimal global force-balanced PDC bit design considering wearing condition
Construction of the optimization model
Objective function
To make the PDC bit reach the global force-balanced state in all drilling moments, the optimal objective function is set to minimize the mean value of the ratio of the lateral force to the WOB and the ratio of the bending moment to the TOB throughout the drilling process, as shown in equation (20)
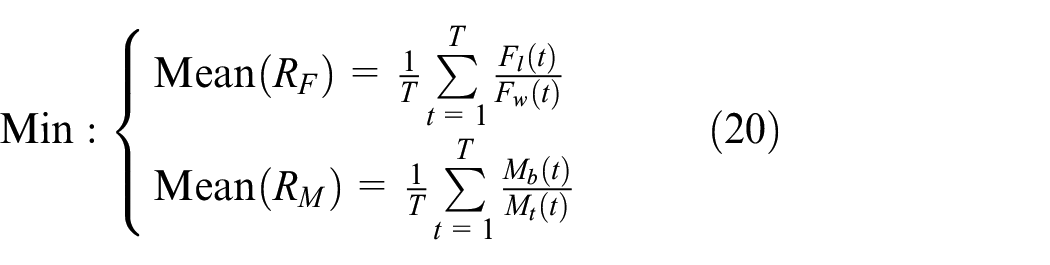
where RF is the ratio of the lateral force Fl to the WOB Fw; RM is the ratio of the bending moment Mb to the TOB Mt; t represents a moment in the drilling process; and T is the total drilling time.
In equation (20), the wear condition of PDC cutters at each drilling time t is updated by numerical iteration of the ZPT method; then, the PDC forces and moments can be obtained according to equation (9), equation (18) and the wear condition at each drilling time t.
Design variables
When the formation properties and drilling parameters remain unchanged, the lateral forces and bending moments are determined by the position of the cutting teeth on the bit. There are six position parameters, namely, the circumferential angle θc, radial position Rc and axial position Hc for determining the position of the cutter centre, and the back rake angle α, side rake angle β and normal angle γ for determining the direction of the cutter surface (Figure 11). These parameters (Rc, Hc, θc, α, β and γ) are also known as cutter layout parameters.
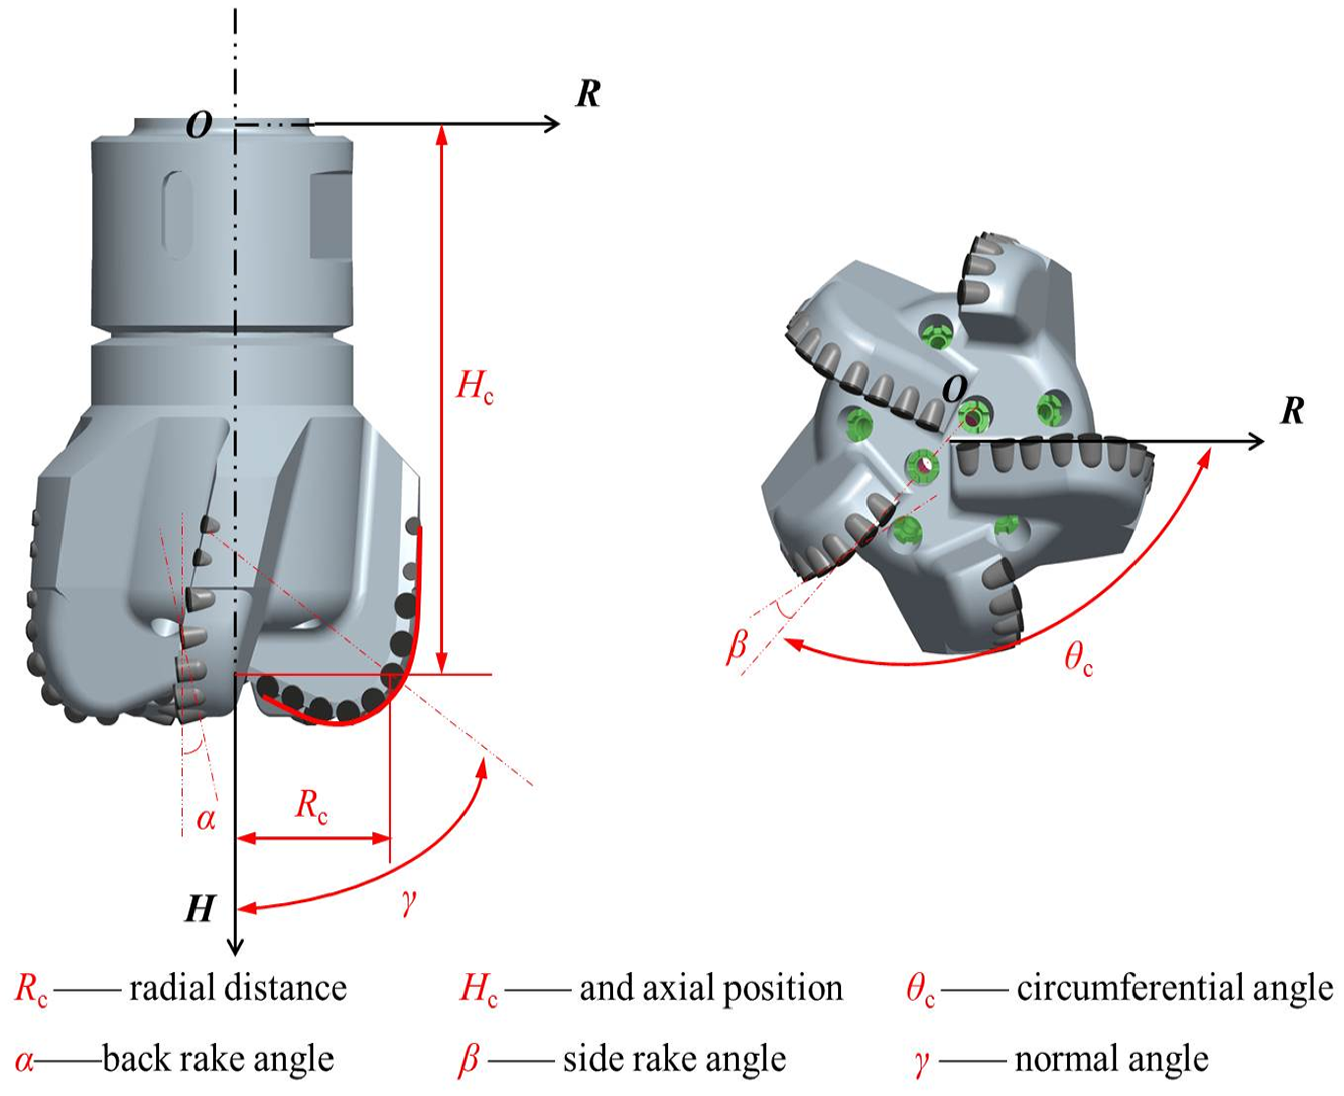
The cutter layout parameters.
The parameters (Rc, Hc and γ) at the cutter centres are difficult to adjust because they are determined by many factors, such as cutter number, cutter diameters, bit profile and cover coefficient at bottom hole. In addition, the back rake angle α is a fixed value for a particular formation. At this point, the parameters (Rc, Hc, γ and α) of all the cutters are not set as design variables in this article.
The effect of side rake angle β is to assist in chip removal. The side rake angle β can be adjusted on a large scale when the hydraulic cleaning effect is good. In addition, the circumferential angle θc has been shown to be closely related to the lateral force of the PDC bit. Therefore, the parameters (β and θc) are design variables.
The optimal model
Combined with the analysis results of the objective function and design variables, the optimal model is constructed in equation (21)

where
Optimization approach
The optimal model for a global force-balanced PDC bit has two distinct features. First, it is a multi-objective optimization (MOP) because there are two objective functions. Second, the optimization model has many independent variables. For a PDC bit with 29 cutters, the model has 58 design variables. In terms of these two features, the MOP algorithm and surrogate model technique are applied to solve the optimization model.
MOP algorithm
MOP is concerned with mathematical optimization problems involving more than one objective function to be optimized simultaneously. In the feasible region, a solution is a Pareto optimal solution if none of the solutions can dominate it. All the Pareto optimal solutions together are called the Pareto optimal solution set. The objective function values corresponding to the Pareto optimal solution set are known as the Pareto front or Pareto frontier.
There are two kinds of methods used to solve the MOP problem: the normalized method and the non-normalized method. The normalized optimal methods usually convert multiple objectives into a single objective and include the weighting, goal programming and ε-constraint methods. The normalized method is mature because it inherits other algorithms to solve the single-objective optimization problem. However, the normalized method has some drawbacks. (1) It is difficult to compare the objectives when the dimension is different. (2) It cannot address the optimal problem whose Pareto frontier is non-convex. (3) The solving efficiency is low.
The non-normalized method is a direct optimization technology based on Pareto theory. It does not require converting multiple objectives into a single objective. At present, the non-normalized algorithms are mainly based on improved intelligent algorithms such as GA, PSO, and neural network. A GA, named the elitist non-dominated sorting genetic algorithm (NSGA-II), was proposed by Kalyanmoy Deb in 2000. It is less complicated than the non-dominated sorting genetic algorithm (NSGA) because a fast non-dominated sorting approach, crowding distance and crowded comparison operator are applied in the calculating process. The total complexity of NSGA-II is mN2, where m is the number of objectives, and N is the size of the population. With properties of a fast sorting procedure, an elitist strategy and a parameterless approach, NSGA-II is one of the best MOP algorithms thus far. In this article, NSGA-II is used to find the optimal solution with the optimal model (equation (21)).
Surrogate model technology
For the optimal model (equation (21)), it takes hundreds or thousands of calculations to find the optimal solution based on NSGA-II. Each calculation requires approximately 2.5 h because the model needs to solve a series of calculations, such as the single cutter force, lateral force and bending moment of the new PDC bit, and force status of the PDC bit with different degrees of wear. Therefore, it is almost impossible to solve the optimal model using only NSGA-II because the calculation time cost is too high.
The surrogate model is an approximate model whose computation requirement is small, but its calculation result is similar to that of the original model. The computing efficiency of the surrogate model is usually hundreds times higher than that of the original model. Construction of the surrogate model requires three steps: (1) generate initial design points by a design of experiment (DOE) method, such as orthogonal array (OA), Latin hypercube (LH) and optimal Latin hypercube (OLH). 19 (2) Obtain the function value of the initial design points by experiment or emulation. (3) Construct the surrogate model based on the initial design points and the function value. There are many methods with which to construct a surrogate model; for example, the response surface model, Kriging model, radial basis functions (RBFs) and back propagation (BP) neural network approaches.
In this article, the Kriging surrogate model is used to approximate the optimization model because it has strong applicability to linear and highly nonlinear functions.
The Kriging surrogate model can be expressed as a regression model

The Kriging predictor can be set to

where

where f is the basis function for the regression model; β is a matrix of regression parameters; r represents a vector of correlation; F is the coefficient matrix of the design sites; R is the matrix of stochastic process correlations and Y is the response of the initial design points.
Then, the mean squared error (MSE)

where

where m represents the number of initial design points.
The unworn PDC bit B in Figure 7 is taken as an example to illustrate the establishment of Kriging surrogate model. The main parameters of the bit B are shown in Table 2. Two design variables are set. One is the back rake angle α, and all cutters are set at the same α. The other is circumferential angle θc of cutters 2, 4 and 6. Keep the remaining parameters of bit B unchanged.
The main parameters of PDC bit B.

Set the variation range of parameters θc and α to (170–200) and (10–25), respectively. Then, OLH is used to generate the initial design points, which are uniformly distributed in the variables interval, as shown by the red points in Figure 12(a). Calculate the corresponding lateral force Fl of each initial design points based on the constructed force models (equations (4)–(10)). Then, the Kriging surrogate model of lateral force (Figure 12(b)) can be built using equations (22)–(26) according to the mapping relationship from (θc, α) to Fl.

The construction of the surrogate model.
The other nine design points (the black points in Figure 12(a)) are generated randomly to verify the accuracy of the Kriging model. Calculate the lateral forces Fl of nine design points using equations (4)–(10). According to the parameters (θc, α, Fll) of nine points, plot the spatial points, as shown by the black dot in Figure 12(b). All the black dots are very close to the Kriging surface model. This indicates that the Kriging model is constructed correctly with a high precision.
The aforementionedis the construction process of a simple Kriging model only with two variables. When the number of design variables increases, the construction process of the surrogate model will become more complicated, which will be elaborated in the following section ‘Optimization case’.
MOP process for a global force-balanced PDC bit
In the optimal design for a global force-balanced PDC bit, the ZPT method is employed to calculate the cutting area A and cutting arc length L of each cutter. Combined with the single cutter force model equation (4), WOB and TOB model equation (7), lateral force model equation (9), bending moment model equation (18) and cutter wear model equation (19), RF and RM can be calculated. The Kriging surrogate model is used to build the function relationship between the ratio (RF, RM) and the design variables (β, θc). NSGA-II is used to find the Pareto optimal solutions and Pareto frontier. The MOP process for a global force-balanced PDC bit is shown in Figure 13.
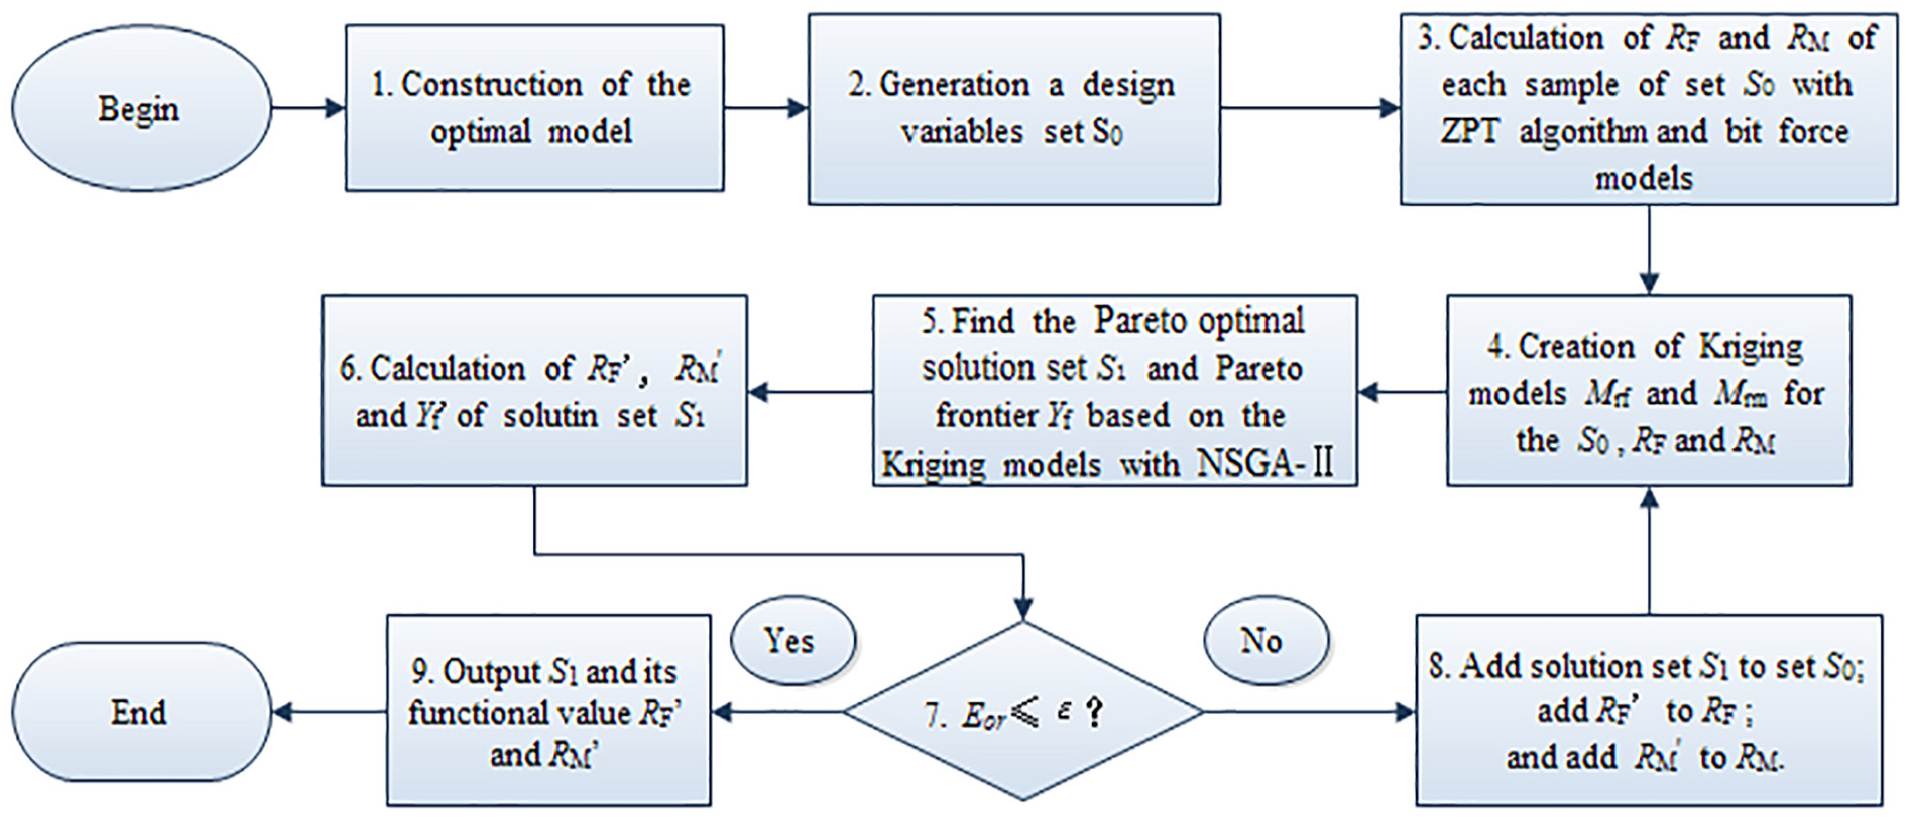
The MOP process for a global force-balanced PDC bit.
The first step (block 1) is to construct the optimal model which includes determination of the objective function, design variables and constraint condition. Then, generate a design variable set S0 (block 2). The distribution of samples in set S0 directly affects the construction and accuracy of the Kriging surrogate model. Therefore, the samples are often generated by the DOE.21–24 In this article, the optimal Latin hypercube design method (Opt LHD), which is more uniform and has higher flexibility, is used to generate the samples of set S0 because the MOP problem of the global force-balanced PDC bit has many design variables.
In the following steps, RF and RM of each sample of set S0 are obtained by the ZPT algorithm and bit force models (block 3). Then, the Kriging models Mrf and Mrm are created. Mrf represents the function relationship between S0 and RF, and Mrm represents the relationship between S0 and RM (block 4). The Pareto optimal solution set S1 and Pareto frontier Yf can be calculated by the NSGA-II algorithm based on the models Mrf and Mrm (block 5).
To verify the accuracy of the models Mrf and Mrm, the ZPT algorithm and bit force models are used to obtain R′ F and R′ M of the Pareto optimal solution S1 and the exact Pareto frontier Y′f (block 6). To determine whether the accuracy of the models Mrf and Mrm meet the requirement (block 7); the judging criteria can be given by

where

where ε represents the upper limit of error of the models Mrf and Mrm; G is an n × 2 matrix; n is the number of Pareto optimal solution set S1; and Gij represents the element in the ith row and the jth column of the matrix G.
If Eor is not smaller than ε, insert the Pareto optimal solution set S1 into set S0, and add R′F and R′M to RF and RM, respectively (block 8). Then, repeat the construction of the Kriging models and optimal process until Eor is smaller than ε. Finally, export the Pareto optimal solution set S1 and its functional values R′ F and R′ M (block 9).
Optimization case
Cutter layout parameters for a PDC bit
The cutter layout structure of the PDC bit in Figure 14 is discussed in this section. The PDC bit has 6 spiral blades and 29 cutters. The diameters of the PDC bit and cutter are 215.9 and 19 mm, respectively. The recommended revolutions per minute (RPM) is 120 r/min, and the rate of penetration (ROP) is 28.8 m/h. The design parameters of the cutter layout structure of the PDC bit are shown in Table 3.
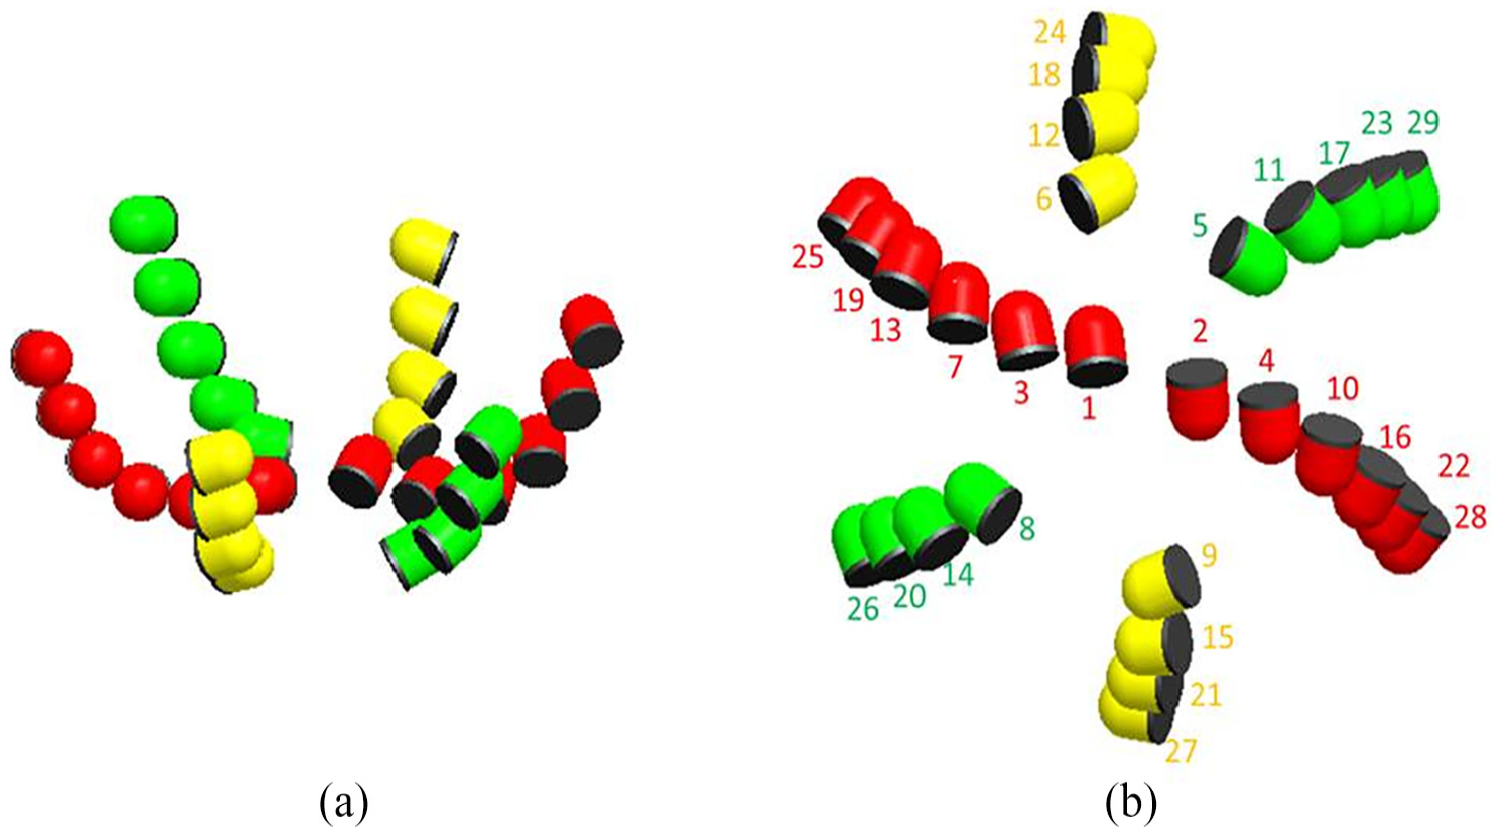
Cutter layout structure of the PDC bit: (a) front view of the cutter layout structure and (b) upwards view of the cutter layout structure.
The design parameters of the cutter layout structure.

Combined with drilling parameters (RPM and ROP) and the ZPT method, the cutting parameters (cutting arc length, cutting area, cutting volume etc.) can be solved. The result shows that the cutter layout of the PDC bit is in line with the law of equal cutting volume and has good cutting performance when the PDC bit is unworn. However, with continuous drilling, Fl, Mb, RF and RM all increase with the wear height of the cutters; this is detrimental to keeping the drilling stable and efficient and avoiding early failure of the PDC bit. This PDC bit is used as the research object in the next section.
Creation of the optimal model
There are 58 design variables for the PDC bit with 29 cutters because each cutter has two variables (β and θc). The number of design variables can be reduced according to the cutter layout characteristics of the PDC bit.
Number the spiral blades of the PDC bit from 1 to 6 counterclockwise; the blade with the first cutter is No. 1, as shown in Figure 15(a).

The blades of the PDC bit: (a) blade number and (b) structure parameters for the blade.
The spiral of the blade is an Archimedes spiral. It is expressed as

where Rp is the radius of the PDC bit; θspan is the blade span angle; θstar is the starting angle of the blade (Figure 15(b)); (Rc, θc) represents a point on the blade spiral in terms of the radial position and circumferential angle of the cutter.
Then, the design variable θc of the cutters can be replaced by the variables θspan and θstar of the blades because Rp and Rc are constants, as shown in equation (30)

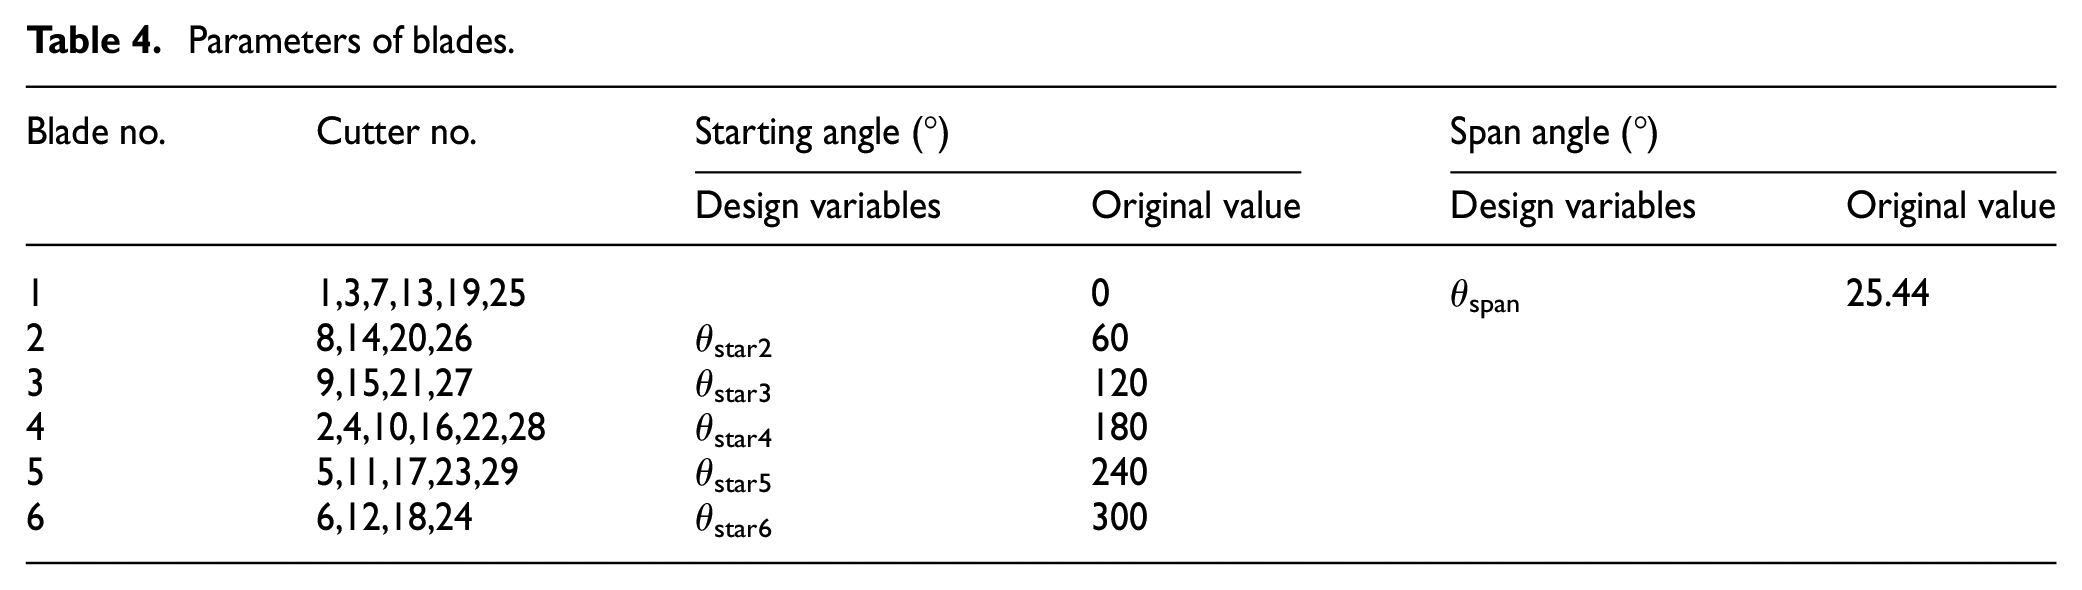
Fix θstar of blade 1 (the red curve in Figure 15(a)), take θstar of the rest of the blades as variables, and make θspan of all the blades equal. Then, the number of design variables related to θc is reduced from 29 to 6, that is, θstar2, θstar3, θstar4, θstar5, θstar6 and θspan (Table 4). θstar and θspan fluctuate around their original values, and the fluctuation amplitude is 15.
Parameters of blades.
To further reduce the variables of the optimal model, set β of the 1st and 29th cutters as design variables. The rest of the cutter β values are obtained by the linear interpolation of the two points
Finally, the optimization model can be expressed as

Generation of the design variables set
Opt LHD is used to create 100 initial design samples with eight design variables. The initial design points evenly fill the entire design space since the scatter matrix of any two variables is uniformly distributed as shown in Figure 16.
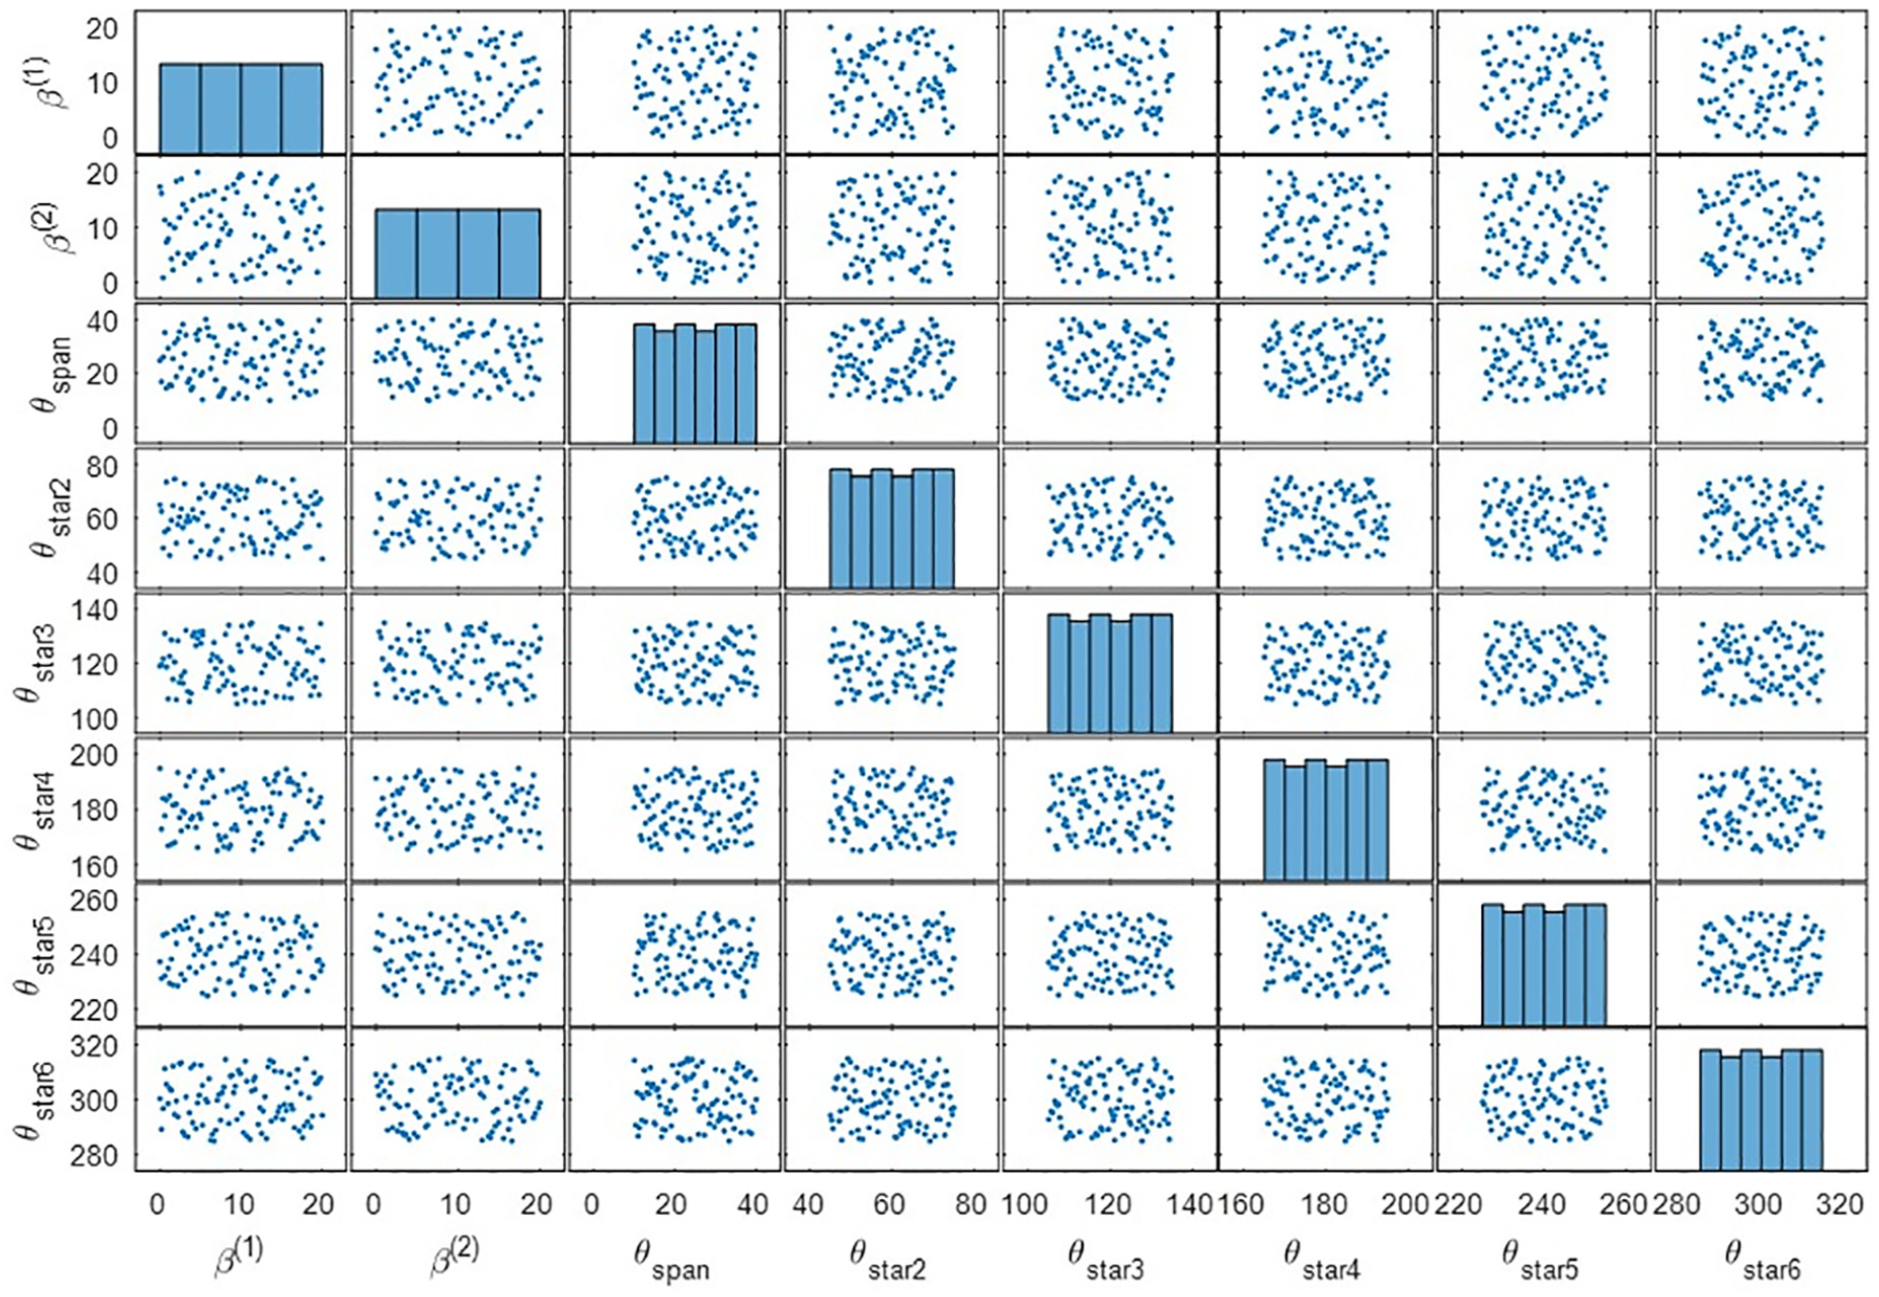
The distribution for the initial design samples.
Analysis and optimal results
The optimization model (equation (31)) can be solved according to the optimal approach described in Figure 13. ε, which represents the accuracy requirement of the Kriging models (block 7 in Figure 13), is set to 0.05. The population size of NSGA-II is set to 16, and the number of generations is set to 40. The process of finding Pareto solutions is shown in Figure 17. Abscissas and ordinates are the values of RM and RF, respectively.
During the evolving process of the first 10 generations, the distribution of the objective values (RM, RF) is scattered, and it is not convergent, as shown by the green points in Figure 17(a).
In the next 10 generations, the objective values, which are marked with the blue points in Figure 17(b), gradually converge in the lower left corner of the coordinate system. However, there is an obvious discontinuous zone between the blue points, which indicates that further optimization is needed to find a better Pareto solution set.
The distribution of the solutions from 21st generation to the 30th generation (the red points in Figure 17(c)) shows that many solutions (the red points) are improved compared with the previous 20 generations. Most of the red points concentrate on the edge of the points set. It has noticeable convergence and forms a Pareto frontier.
The solutions (the cyan points in Figure 17(d)) from 31st generation to 40th generation are still basically at the Pareto frontier generated by the 21–30 generations. The only difference is the case that the points at the Pareto frontier are denser. There is no further Pareto improvement that can be made without damaging the constraints and the optimization model, in which case, the optimization process can be terminated and the Pareto optimality is reached.
Exact the Pareto optimal set according to the Pareto theory. Forty-nine Pareto optimal solutions are obtained as shown in the red points in Figure 17(e).
Take nine points from the 49 Pareto optimal solutions. Calculate the exact values RF and RM of the nine Pareto optimal solutions according to ZPT method, the single cutter force model equation (4), WOB and TOB model equation (7), lateral force model equation (9), bending moment model equation (18) and cutter wear model equation (19). There are nine calculating results, also called non-dominated solutions (NDSs), represented by pentagrams in Figure 17(f). It is noted that the exact values RF and RM have a slight deviation from the Pareto optimal solutions, which is due to the error of the Kriging model.

The optimization process: (a) the solutions of the first 10 generations, (b) the solution distribution of the first 20 generations, (c) the solutions distribution of the first 30 generations, (d) the solutions distribution of the 40 generations, (e) the Pareto optimal set and (f) the non-dominated solutions.
For a global force-balanced PDC bit, RF should be less than 5% and RM less than 15%. There are five NDS (the pentagrams in the dotted rectangle in Figure 17(f)) whose RF is smaller than 5% and RM is smaller than 15%. The corresponding cutter layout parameters are displayed in Table 5. In contrast to traditional PDC bits, the optimal PDC bit has a side rake angle β that decreases from inside to outside the bit. The span angle of the blade θspan increases by 24.69% compared with the original PDC bit shown in Figure 14.
Cutter layout parameters of the five Pareto frontier.

Figure 18 shows the layout structure of the blades of NDSs 1, 3 and 5 (green curves). Compared with the original blades (blue curves), the optimal starting angles of blades 2, 3, 4 and 5 are all greater, while the optimal starting angle of blade 6 is smaller.

Layout structure of blades: (a) blades layout structure of Pareto frontier 1, (b) blades layout structure of Pareto frontier 3 and (c) blades layout structure of Pareto frontier 5.
As shown in Figure 19, the PDC bit of NDS 1 (green curve) has a maximal RF when the PDC bit is not worn (drilling time is equal to zero). With the gradual wear of the PDC bit, RF decreases slightly. When the drilling time is greater than 0.63, the PDC bit of NDS 1 has the smallest RF. Compared with the original PDC bit described in Figure 14, the mean RF of the PDC bit of NDS 1 is reduced by 10.99%, and the maximum RF is smaller than 5%.

RF of different PDC bits.
The mean RF of the PDC bit of NDS 3 (blue curve) is similar to that of the original PDC bit (red curve). The maximum RF is greater than 5%.
Although the PDC bit of NDS 5 (brown curve) has the smallest RF when PDC bit is not worn, RF continues to increase with the wear of the PDC bit. The maximum RF is greater than 10%.
Therefore, regarding the balance of lateral force, the cutter layout structure of NDS 1 fully meets the design requirement. The cutter layout structure of NDS 3 basically meets the requirements.
As shown in Figure 20, the PDC bits of NDSs 1, 3 and 5 all have smaller RM compared with the original PDC bit, and the RM values are smaller than 15%. Therefore, the cutter layout structure of NDSs 1, 3 and 5 are all in line with the bending moment balanced design.
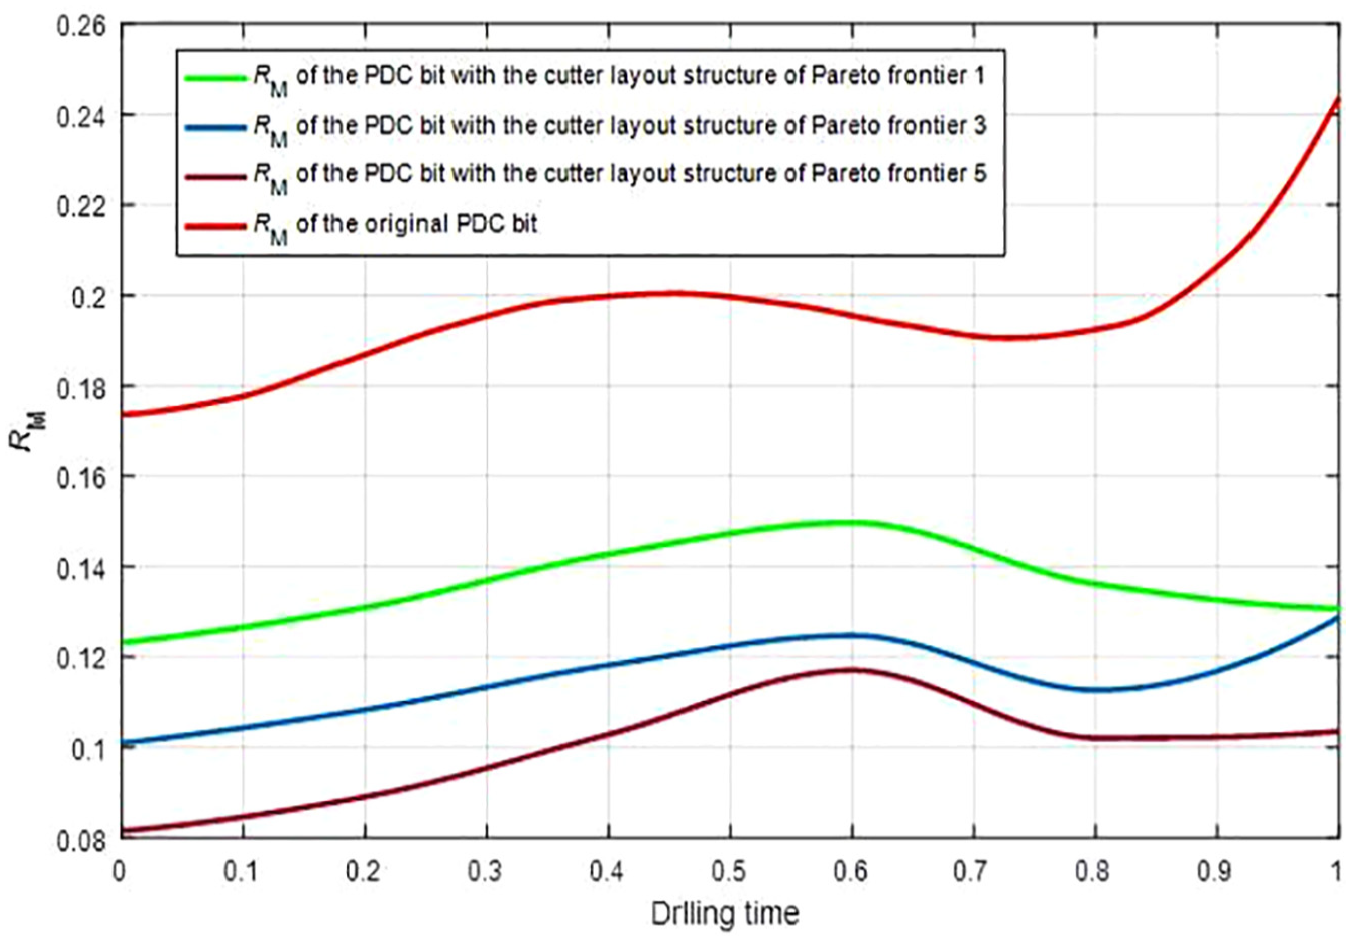
RM of different PDC bits.
Combined with the aforementioned analysis, the cutter layout structure of NDS 1 is selected as the final optimal result. Compared with the original PDC bit, RF of the optimal PDC bit is reduced by 10.99% and RM is reduced by 30.43%. The maximal RF is lower than 5%, and the maximal RM is less than 15%. The optimal results satisfy the global force-balanced PDC bit design.
A set of cutter layout structures corresponding to the minimum RF and RM can be obtained by the optimization approach proposed in this article. A PDC bit with this cutter layout structure is capable of maintaining a balance of the lateral force and bending moment during the drilling process even with continuous wear of the cutting teeth, which means that the lateral vibration degree and the probability of whirl of the PDC bit is reduced. Furthermore, trip times can be reduced, and drilling efficiency can be improved.
Discussion
To date, all the research of cutter layout design for force-balanced PDC bits has focused on the new PDC bit, without considering cutter wear. In fact, a bit wearing is the normal state during drilling, and lateral force and bending moment are no longer balanced after bit wears. It is not reasonable to design a ‘lateral force-balanced’ bit or ‘global force-balanced’ bit without considering wearing conditions.
To solve the aforementioned problems, we have performed a series of studies. An algorithm ZPT 17 was created to solve the cutting parameters of the worn teeth, and ZPT makes it possible to calculate force status of wear PDC bit. Then, mechanical properties study 25 of wear PDC bit was analysed based on ZPT method. Cutter layout optimal design of a PDC bit with wear was carried out 18 to reduce the lateral force.
In this article, the optimal design for cutter layout is further studied. A single 3D cutter force model is proposed, and it is more comprehensive and accurate because the parameters of side rake angle, wear degree, back rake angle, rock property, and so on are considered. The lateral force model is recreated based on the 3D single cutter force model. In addition, the bending moment model is constructed based on space-force theory, since there is no public report on the method of calculating the bending moment of PDC bit. The established single cutter force model, lateral force model and bending moment model make it possible to analyse the global force-balanced state of wear PDC bits. Then, cutter layout optimal design of a PDC bit to achieve global force-balanced state is carried out with NSGA-II and Kriging surrogate model. After optimization, the lateral force to WOB ratio is reduced by 10.99%, and the bending moment to TOB ratio is reduced by 30.43%. This result is a significant improvement in the force condition and stability of the PDC bit; ultimately, the whirl and tilt motion can be reduced, and the drilling efficiency can be improved. This study perfects the theory and approach to design a global force-balanced PDC bit by cutter layout optimization and reduces the whirl and tilt motion of PDC bit and further improves drilling efficiency.
Conclusion
A new optimization approach for global force-balanced PDC bits considering wear condition is proposed in this article; this approach can improve the drilling properties of the bit. The detailed conclusions are as follows:
The lateral force model and bending moment model are obtained by the synthesis of the forces and moments of all the cutters based on the new single cutter force model, which considers cutter layout parameters and wear condition. The use of the lateral force model and bending moment model allow the design of a global force-balanced PDC bit.
The optimal design model for a global force-balanced PDC bit is proposed. The side rake angle β and circumferential angle θc are set as the design variables. The optimal objective function is set to minimize the mean values of RF and RM for worn cutters at all drilling times. The optimal model is more similar to actual drilling requirements because it considers lateral force, bending moment and cutter wear.
The optimal approach is proposed to solve the optimal model. The Kriging surrogate model is used to build the functions between the ratios (RF and RM) and the design variables (β and θc). NSGA-II is used to find the Pareto optimal solutions and Pareto frontier. The optimal approach makes the optimization process more efficient.
An optimization case for a PDC bit with 29 cutters is presented. After optimization, RF is reduced by 10.99% and RM is reduced by 30.43%. The PDC bit is capable of maintaining the balance of lateral force and bending moment with wear. The lateral vibration degree and the probability of whirl of the PDC bit can be reduced, and the drilling efficiency can be improved.
Footnotes
Handling Editor: Liyuan Sheng
Declaration of conflicting interests
The author(s) declared no potential conflicts of interest with respect to the research, authorship, and/or publication of this article.
Funding
The author(s) disclosed receipt of the following financial support for the research, authorship, and/or publication of this article: This paper is supported by Sichuan Science and Technology Programme (grant no. 2019YJ0536) and National Natural Science Foundation of China (grant no. 51904263).