
Abstract
This study aimed to explore the relationship between factors causing accidents and riding risk perception of electric cyclists, and to assess the contribution of these factors to active involvement in accidents. A self-completion questionnaire survey was carried out among 215 electric cyclists in China. The questionnaire included measures of perception of other road users’ driving behaviors, perception of violations, and self-awareness. An evaluation model of riding risk perception was established through factor analysis method. Then correlation and significance analysis was conducted for both level indicators and background variables. This article concluded that the electric cyclist’s perception of motorists’ driving behaviors, pedestrians’ behaviors, and cyclists’ riding behaviors would increase as the electric cyclist’s age grew. Female’s perception of violations was stronger than that of male, while female was weaker than male in self-awareness. Moreover, the riding years, frequency, and experience were positively correlated with riding risk perception. This article can provide guidance for the safety of electric bicycle riding.
Introduction
As a convenient means of transport, electric bicycles have developed rapidly in many developing countries. For example, in China, in 2018, the number of cars was 240 million while the number of electric bicycles was more than 300 million. However, electric cyclists are more likely to cause accidents than other traffic participants. It is commonly acknowledged that the designed speed and the weight of bicycle itself are two main factors affecting the safety character. 1 Therefore, quantities of studies have carried out to identify variables which may affect accident involvement in traffic. Due to the similarities in many aspects between electric bicycles and bicycles, many scholars have studied electric bicycles through bicycle safety theory. Research on riding safety of electric bicycles mainly focuses on safety character, accident analysis, and traffic conflicts.
Types of electric bicycles, risk behaviors while riding, and injury characteristics were associated with electric bike/moped riders and passengers’ injuries. Risk behavioral factors were the principal self-reported cause of injury events. 2 Using regression analyses, Haustein and Møller 3 found that riding style and electric bicycle attitude played a crucial role in both perceived safety and involvement in safety critical incidents. Yuan et al. 4 established a binary logistic model to analyze the significance of main contributing factors of crashes, which include time of incident, road users’ age and gender, crash patterns, and characteristics of road and environment. Weiss et al. 5 found that a comparison of the senior and younger electro-assisted cyclists showed a higher risk of injury for seniors in the initial analysis.
The factors that significantly affected the frequency of rear-end conflicts included the operating speeds of electric bicycles, the speed difference between electric bicycles and regular bikes, the volume of electric bicycles, the volume of bikes, and the width of bike lanes. 6 With analysis of the elasticity of the explanatory variables, Bai concluded that the presence of scooter-style electric bicycles had a considerably negative influence on the safety of signalized intersections, whereas the presence of bicycle-style electric bicycles had a minor effect. 7 Li et al. found that users of electric bicycles within heterogeneous traffic flow need more lateral space for safe riding. The cross-section of bicycle lanes should allow the completion of overtaking maneuvers, and the results suggest the cross-section needs to be wider than 3 m and no less than 2.6 m. 8 Petzoldt et al. 9 concluded that the presence of any other road user, regardless of whether it was a pedestrian, another cyclist, or a motorized vehicle, led to a considerable risk increase.
The individual’s own personality characteristics, knowledge and experience, achievement motivation, involvement, and risk information sources all have an impact on risk perception. Garbarino and Strahilevitz’s 10 research showed that female is more cognitively motivated than male. Kerzner 11 believed that risk perception differs in age. He believes that the older the age, the stronger the risk perception ability. Lobb et al.’s 12 research showed that risk perception affects behavioral intentions. There are also some studies about risk perception in ordinary cyclist. Sanders 13 found that cycling frequency seems to heighten awareness of traffic risk, particularly for cyclists who have experienced “near misses” or collisions. Useche et al.’s 14 study supported the influence of gender in the statistical explanation of risky and protective behaviors, and revealed differentiating variables predicting the riding behavior of male and female cyclists. Besides, it was also found that cycling intensity has a differential impact on self-reported crashes in older (age > 25) and younger (age ≤ 25) cyclists through a multi-group path model differentiating cyclists by age group. 15
Because of essential difference between electric bicycles and ordinary bicycles, it is necessary to improve the research on the riding perception risk of electric cyclists. Tova used variance analysis to conduct risk perception studies of electric cyclists and car drivers, and found that driver’s driving skills and driving experience have an impact on driving behavior. 16 Johnson et al. 17 analyzed the red light behavior of Australian electric cyclists through a multivariate logistic model, and explained the factors related to the driver’s red light behavior based on the regression coefficient of the multivariate logistic model. Tunnicliff et al. 18 studied the theory of planned behavior and found that perceived behavior affects driver safety behavior, and driver’s attitude and pursuit of stimuli could lead to unsafe behavior.
Electric cyclists are the most likely to cause accidents among road traffic participants. Riders’ unsafe behaviors and traffic violations are mostly related to the rider’s own risk perception level, which includes perception of other road users’ driving behaviors, violation tendency, driving experience, and own attributes. There is a lack of in-depth research on the riding risk perception of electric cyclists and the relationship between electric cyclists’ own attribute characteristics and riding behaviors. Scholars and experts have relatively few studies of driving risk perception on electric bicycles, and electric bicycles and ordinary bicycles are managed as non-motorized vehicles. Besides, scholars tried to study the safety behavior of electric bicycle driving from the perspective of psychology and physiology, but there was no mature theoretical system. Therefore, it has practical significance to study the risk perception of electric cyclists taking into account other factors of road traffic from the psychological point of view of the electric cyclists. It provides a basis for the safe use and policy management of electric bicycles.
Research context
Evaluation system
To establish a driving risk evaluation system for electric cyclists, a complete, scientific, and reasonable evaluation system must be established. The indicators included in this evaluation system must reflect the strength and risk of electric cyclists’ risk perception as comprehensively and realistically as possible. The quality of these evaluation indicators has a great impact. Therefore, designing risk perception evaluation system must also follow some necessary principles, which include the principles of purpose, scientificity, connectivity, unity, comparability, and feasibility. It is necessary to determine a clear goal, that is, what the target system should be used for and what purpose should be achieved in order to decide which indicators to choose. The principle of scientificity is based on the premise of the purpose, and based on its design indicator system, it should have a scientific basis in determining the name and meaning of the indicator. It is practical so that it can be used to collect data and performance can then be used to make the right analysis and application. The principle of connectivity means that each specific indicator in the risk perception indicator system of the electric cyclist must be connected, so as to comprehensively understand the internal relationship between the indicators of risk perception and its regularity. Unity means that the electric cyclist’s risk perception should be regarded as a relatively independent whole, and it should be placed in the safety system of electric cyclists, and the risk perception factors should be studied from this large system. The feasibility principle requires that the proposed electric cyclist risk perception index not only has a clear meaning but also requires direct calculation of measurement or observation, and there is a possibility of obtaining both technically and economically. Although there are very few indicators of self-awareness in current risk perception research, existing indicators, such as indicators related to violations of behavior, are of great practical value and should be selected from existing indicators according to research purposes. The indicators constitute a dedicated indicator system for specific operations and analysis.
According to the basic principles to be followed in the selection of indicators, and extensively collected, combined with the relevant research of scholars, it is proposed that the three parts, that of perception of other road users’ driving behaviors, perception of violations, and self-awareness, constitute the basic framework for evaluating risk perception indicator system. Then, the three parts are gradually subdivided to find out the items in the three parts that are related to risk perception and can be described and expressed. The less relevant items are removed, while unnecessary redundant items are deleted or merged. Eventually, the evaluation system for riding risk perception of electric cyclists is assessed, as shown in Table 1. The item “perception of violations” is investigating how cyclists think that committing a violation is risky; the item “perception of speed” is about the feeling that participants experience when speeding; and the item “perception of road” is referred to infrastructure quality.
Indicators of evaluation system.

Questionnaire design
Using Likert-type’s 5-point scoring method, a questionnaire that fits China’s national conditions was designed. The questionnaire did not include personal information such as the investigator’s name, telephone number, and home address. The questionnaire consists of three scales:
Scale of electric cyclists’ individual characteristics: Collect information on personal attributes of the respondents: gender, age, education level, driving license, riding years, riding frequency, and traffic accidents in 3 years. Among them, the riding experience consists of riding years, riding frequency, and traffic accidents in 3 years.
Scale of electric cyclists dangerous riding behaviors: The respondents were asked to select some of the electric cyclist’s dangerous riding behaviors. The scale used Likert-type’s 5-point scoring method, where 1 represents “always,” 2 represents “frequently,” 3 represents “sometimes,” 4 represents “seldom,” and 5 represents “never.”
Scale of risk perception: Many experts and scholars have compiled risk perception questionnaires.19–21 Based on the contents and forms of the above questionnaires, the relevant options for influencing the safety behaviors are initially selected. Photographing the riding behavior of electric cyclists in Nanjing. Filter the related photos and describe the riding behavior. Then adjust the content of the questionnaire through expert consultation. (The experts here refer to experts in a broad sense, including experts and scholars in road traffic safety, traffic management personnel, traffic police, and experienced electric cyclists.)
Data collection
In order to obtain sufficient and valid data, the data collection of the questionnaire was conducted from November 2016 to December 2016. It was conducted in Xinjiekou area, Hanzhongmen Square, Litchi Square, and Zhonghua Gate Area of Nanjing. A total of 230 questionnaires were collected, excluding questionnaires filled with incomplete information. Finally, 215 effective questionnaires were obtained. The recovery rate reached 93.48%. Table 2 shows the descriptive statistics of the sample.
Descriptive statistics of the sample.

Factor analysis
Establish a factor analysis model
SPSS 22.0 software was used to perform factor analysis on the data obtained from the questionnaire to obtain the total variance interpretation table, as shown in Table 3 and Table 4. The abscissa is the number of factors, and the ordinate is the eigenvalue. According to the method of extracting eigenvalues greater than 1, three factors were extracted. The first factor has an eigenvalue of 5.308 and the variance percentage was 35.384%, and both were the highest among all factors. The second factor has an eigenvalue of 2.886 with a variance percentage of 19.237%. The third factor has an eigenvalue of 2.553%. Three main factors can accumulate 71.64% of variance. These three factors were successively named as perception of other road users’ driving behaviors, perception of violations, and self-awareness.
Initial eigenvalue.

Rotation Sums of Squared Loading.

The comprehensive factors of the initial factors obtained by the principal components analysis method are relatively strong, and it is relatively difficult to find the actual meaning of the factors. Therefore, it is necessary to perform factor rotation so that the load approaches the directions of ±1 and 0, and the comprehensiveness of the initial factors is reduced. The maximum variance method and orthogonal rotation method were used in this article (Figure 1).

Component diagram of the rotated space.
The factor score coefficient matrix is obtained by performing factor analysis on three aspects (perception of other road users’ driving behaviors, perception of violations, and self-awareness) in turn, as shown in Table 5.
Factor score coefficient matrix.

After adding the squares of the factor loadings of all variables in the same common factor in Table 5. The obtained values are the eigenvalues of this common factor. The resulting eigenvalues are normalized and the weights of the resulting factors are calculated. The final eigenvalues and weight values are shown in Table 6.
Eigenvalue and weight.

Determination of indicator weight
The variance maximum orthogonal method is used to rotate the component matrix to obtain the component score coefficient matrix, as shown in Table 7.
Score coefficient matrix.

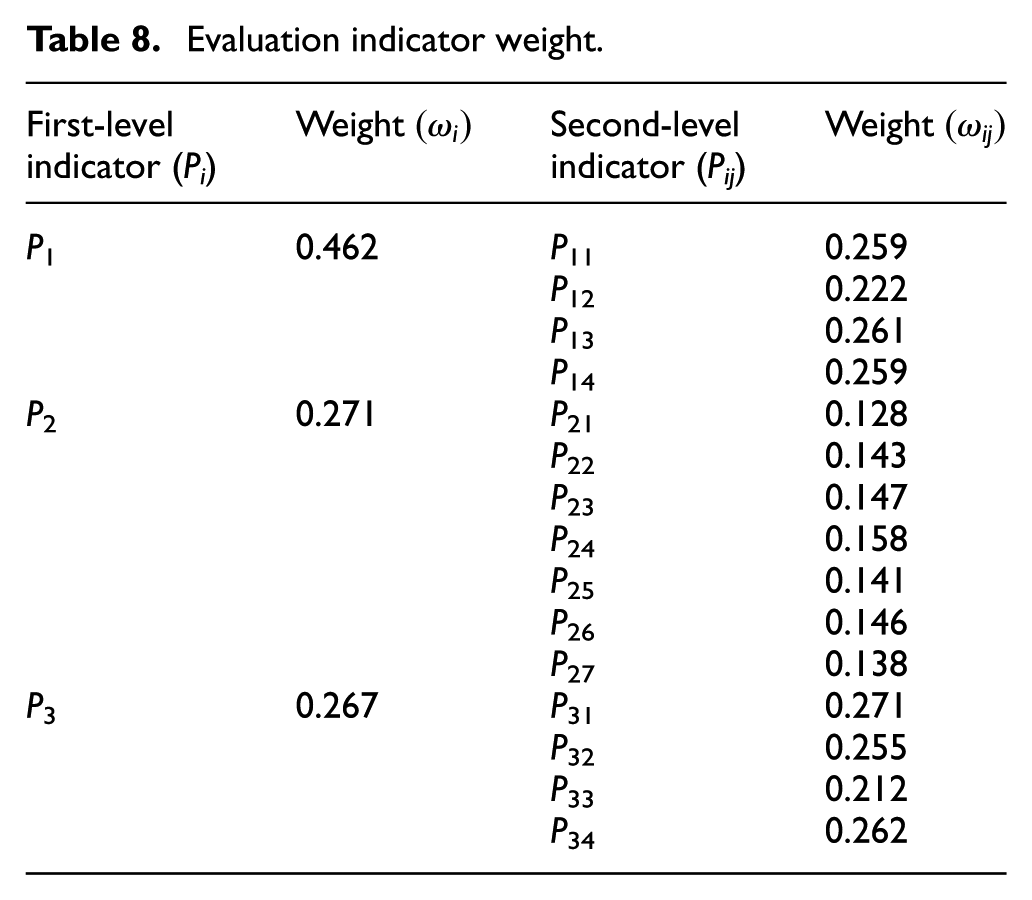
The normalization of the factor score matrix of Table 6 finally yields the weight of cognitive evaluation indicators for riding risk of electric cyclists, as shown in Table 8.
Evaluation indicator weight.
Riding risk perception model
According to the various indicator weights of the driver’s driving risk perception evaluation model, the riding risk perception evaluation model of electric cyclists is built. The function is shown in


where P represents the electric cyclist’s perception of risk, Pi represents the first-level indicator score of electric cyclist’s riding risk perception, Pij represents the second-level indicator score of electric cyclist’s riding risk perception, ωi represents the first-level indicator weight, and ωij represents the second-level indicator weight.
Finding and discussion
The Jonckheere–Terpstra test and the Kruskal–Wallis test were used to assess the first-level indicators of electric cyclists’ riding risk perception and background variables, as shown in Table 9. First-level indicators of riding risk perception with the p-value less than 0.05 which indicates the significance will be selected. The second-level indicators included in the selected first-level indicators of riding risk perception and background variables were further tested for detailed correlation and significance, as shown in Table 10.
Results of Jonckheere–Terpstra test and the Kruskal–Wallis test.

Relationship between indicators of driving risk perception and background variables.
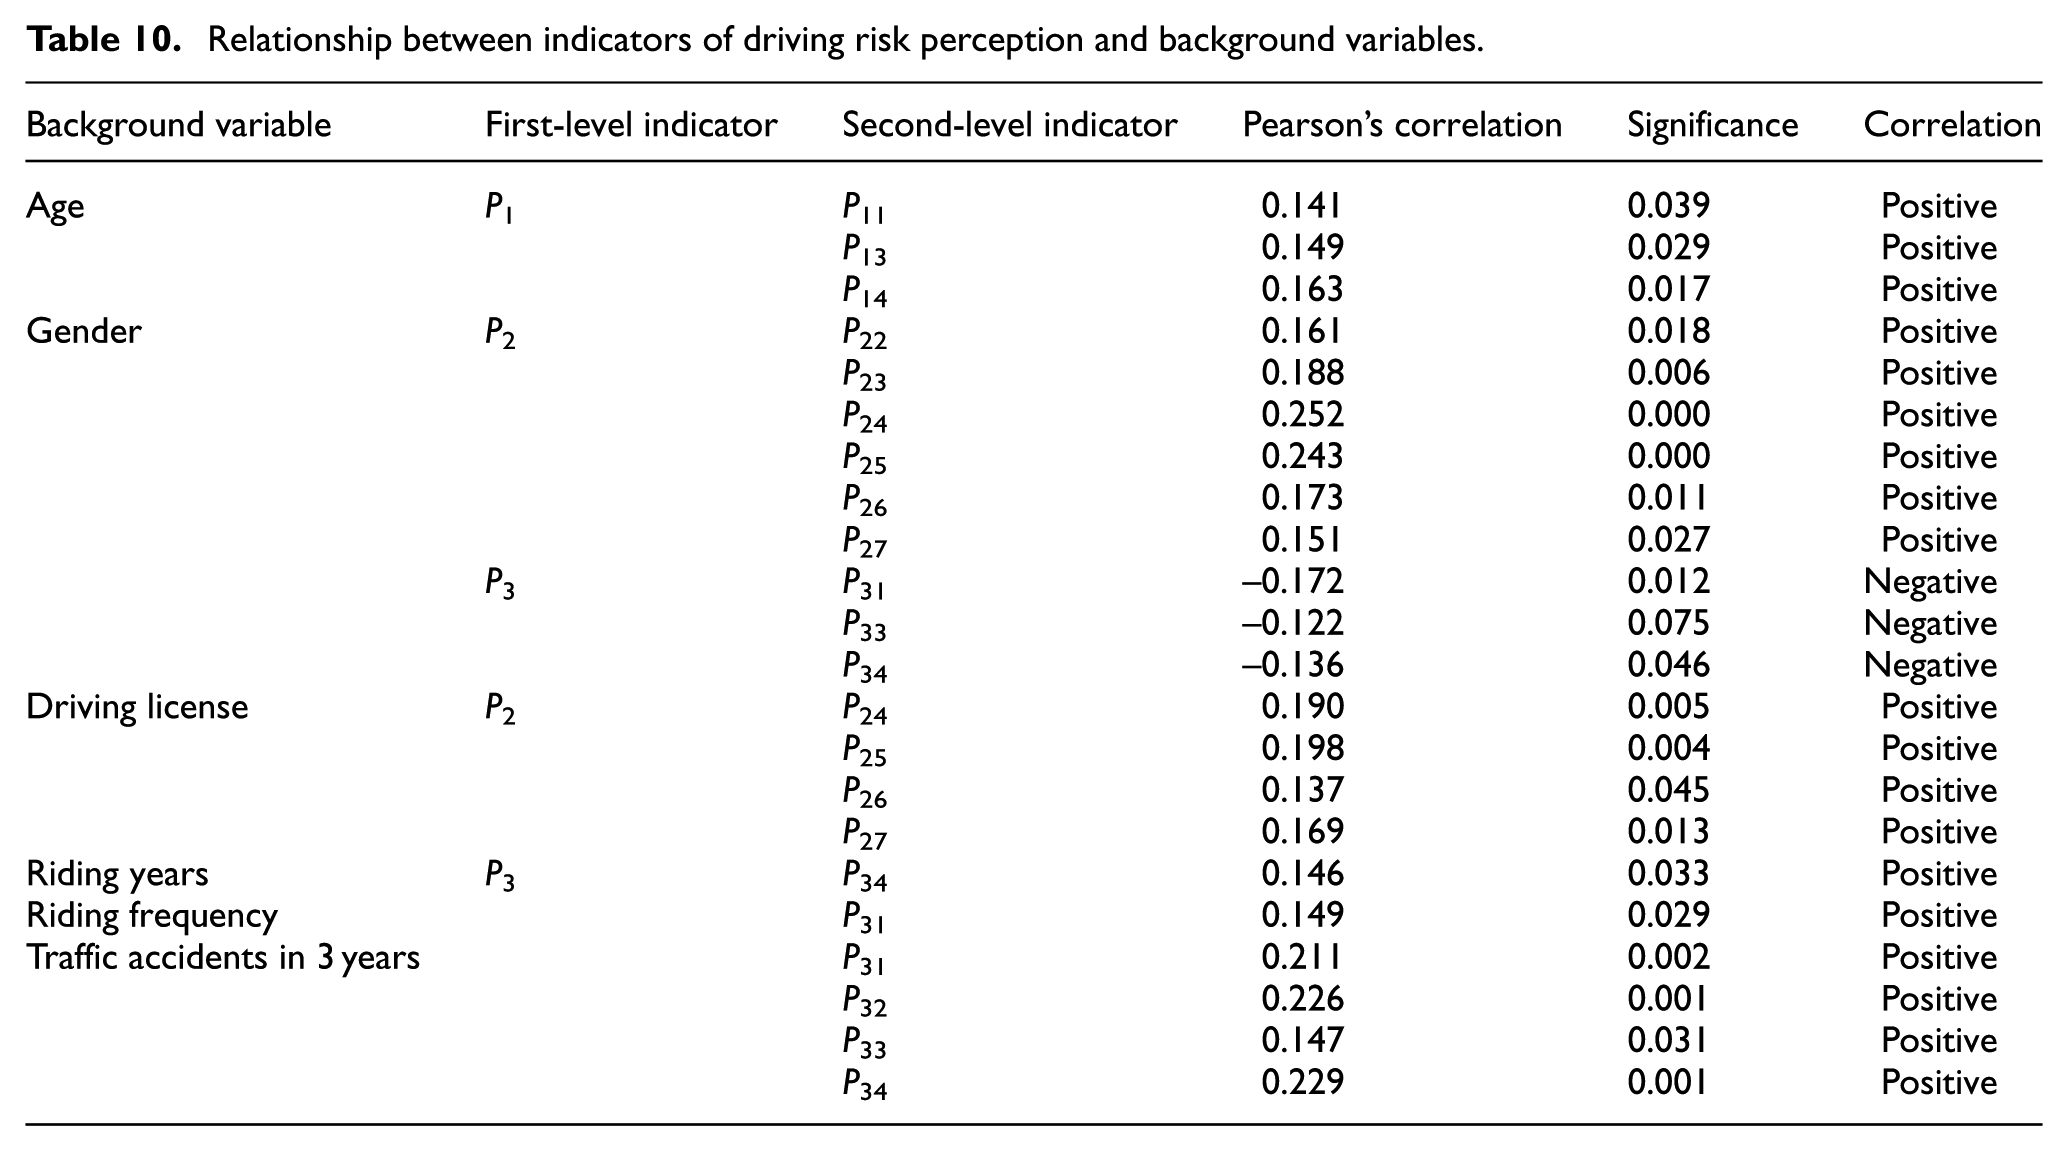
From Table 10, it can be seen that the first-level and second-level indicators of riding risk perception of electric cyclists have the following relationship with the background variables:
Age in three aspects of perception of other road users’ driving behaviors: There is significance and correlation between age and perception of motorists’ driving behaviors, perception of pedestrians’ behaviors, and perception of cyclists’ riding behaviors, and all of them are positive. This shows that, as the electric cyclist’s age grows, the electric cyclist’s perception of motorists’ driving behaviors, perception of pedestrians’ behaviors, and perception of cyclists will also increase.
Gender in six aspects of perception of violations: There is significance and correlation between gender and perception of retrograding, perception of riding behaviors of occupying motor lanes, perception of carrying passengers or goods, perception of drunk riding, perception of distracted riding, and perception of jaywalking, and all of them are positive. And female’s perception of these six aspects of violations is stronger than that of male.
Gender in three aspects of self-awareness: There is significance and correlation between gender and perception of riding speed, perception of road, and perception of reactivity, and all of them are negative. This shows that female is weaker than male in these three aspects.
Having a driving license or not in four aspects of perception of violations: There is significance and correlation between having a driving license or not and perception of carrying passengers or goods, perception of drunk riding, perception of distracted riding, and perception of jaywalking, and all of them are positive. This shows that electric cyclists with driving licenses have strong riding risk perception of these four aspects of riding behaviors.
Riding years in one aspect of self-awareness: There is significance and correlation between riding years and perception of reactivity, and the correlation is positive. This shows that the longer the riding years, the stronger the electric cyclist’s perception of reactivity.
Riding frequency in one aspect of self-awareness: There is significance and correlation between riding frequency and perception of riding speed, and the correlation is positive. This shows that the more frequently the electric cyclists ride, the stronger his or her perception of riding speeds.
Traffic accidents in 3 years in four aspects of self-awareness: There is significance and correlation between the number of traffic accidents in 3 years and perception of riding speed, perception of self-emotion, perception of road, and perception of reactivity, and all of them are positive. This shows that the electric cyclist’s self-awareness improved after driving accidents.
Conclusion
This article established an evaluation system of riding risk perception for electric cyclists based on the basic principles of evaluation indicators and the related research of domestic and foreign scholars. The riding risk perception of electric cyclists was assessed through questionnaire survey. In order to quantitatively evaluate the riding risk perception of electric cyclists, factor analysis was used to obtain the weight value of both level indicators. Through the normalization of the eigenvalues of the riding risk perception indicator, the weight of it was obtained. Factor analysis was carried out on the three main factors of riding risk perception, and the factor score coefficient matrix after rotation was normalized to obtain the second-level indicator weights. According to the first-level and the second-level indicator weights, a riding risk perception evaluation model of electric cyclists was established. The first-level indicators were correlated with the background variables by Jonckheere–Terpstra test and Kruskal–Wallis test. First-level indicators of riding risk perception with the p-value less than 0.05 which indicates the significance will be selected. The second-level indicators included in the selected first-level indicators of riding risk perception and background variables were further tested for detailed correlation and significance. Finally, the relationship between the first-level indicators, the second-level indicators, and the background variables was determined, and the results were analyzed. This article concluded that the electric cyclist’s perception of motorists’ driving behaviors, pedestrians’ behaviors, and cyclists’ riding behaviors would increase as the electric cyclist’s age grew. Female’s perception of violations was stronger than that of male, while female was weaker than male in self-awareness. Moreover, the riding years, frequency, and experience were positively correlated with riding risk perception. This work could provide evidence-based advice for electric cyclists’ education, riding safety activities, and even licensing policies.
The risk perception of electric cyclists has a significant impact on the rider’s traffic safety. It is of great practical and theoretical significance to study riders’ risk-related issues. Although this article has carried out some research on the risk perception of electric cyclists, there are still some limits that need further research:
Riders are easily influenced by their subjective emotions when filling out the risk perception questionnaire. When the rider fills in the questionnaire, there may be cases where the filling is not accurate. Therefore, the language expression of the questionnaire design needs to be further improved.
A total of 215 sample sizes were obtained in this study, and the increase in sample size in the future can make the research results more convincing.
An evaluation model of riding risk perception was established through factor analysis method. Subsequent research could use a variety of methods to comprehensively utilize and compare various methods.
The study methods of self-report-based researches have some key limitations. First, errors in self-understanding limit the scientific nature of self-report. Second, the validity of people’s reports and explanations cannot be guaranteed.
Footnotes
Handling Editor: Martin Baumann
Declaration of conflicting interests
The author(s) declared no potential conflicts of interest with respect to the research, authorship, and/or publication of this article.
Funding
The author(s) received no financial support for the research, authorship, and/or publication of this article.