
Abstract
The trend of increasingly multi-modal urban transportation has accelerated with the advent of low-power vehicles such as electric-assist bicycles, scooters, and skateboards. Despite increased attention, little is known about the actual usage of these vehicles, such as their mode shares in off-street and cycling facilities. The objectives of this study are to: (1) catalog all motorized and non-motorized vehicles in use on cycling facilities in metropolitan Vancouver, Canada; (2) create a taxonomy of the vehicles using visually identifiable features; and (3) determine volumes and mode shares for each vehicle type. We develop and validate a field data collection method using pneumatic tubes synchronized with video cameras, and collect classified volume data at 12 strategically selected locations over four seasons. A total of 25,282 vehicles are classified from more than 450 h of video data, categorized into 27 types using 10 features, such as number of wheels, number of axles, and existence of a battery/motor. Conventional (non-shared) bicycles are still the dominant vehicle in use, with a mode share of 90%. Although a variety of motorized personal mobility devices are present in cycling facilities, their mode shares are still extremely small. Electric bicycles are the most common motorized vehicle, with a mean mode share of 4% (ranging from 0% to 20% by location-date). The proposed taxonomy enables consistent empirical data collection to evaluate mode share trends and patterns, and to study the impacts of regulatory changes, incentive programs, and new infrastructure.
Keywords
The focus of urban transportation has shifted toward multi-modal systems that provide travelers with more transportation options. This trend has accelerated with the advent of low-power personal mobility vehicles such as electric-assist bicycles, scooters, and skateboards that are gaining popularity. These new mobility options create opportunities to address enduring challenges in the transportation sector related to traffic congestion, air pollution, climate change, public health, and energy consumption ( 1 , 2 ). A wider variety of mobility options, in the presence of appropriate infrastructure, can also help make transportation systems more equitable by accommodating a wider array of travel needs ( 3 , 4 ).
At the same time, new mobility options come in a variety of sizes and configurations that may present new challenges for urban transport systems, where there is often already competition for space and access among travelers. A wider variety of vehicles using the same off-street facilities could lead to more interactions and conflicts—particularly in places where walking and cycling are already at high levels ( 5 ). It is paramount that we capture the potential benefits of more diverse travel options while mitigating the risks of a wider variety of vehicles within constrained urban spaces.
Knowledge about the impacts of emerging personal mobility devices is still limited, hindering efforts toward strategic accommodation and adaptation. We even lack basic mode share data from which projections and forecasts can be made, trends and impacts analyzed, or policies and facilities designed. Information on modal volumes and mode shares is one of the most fundamental types of transportation data ( 6 , 7 ). Mode shares are a key measure of personal travel, essential for monitoring, modeling, forecasting, and policy development ( 8 – 11 ). Classified vehicle volumes are also a crucial factor in transportation facility design and safety analysis ( 12 – 14 ). This paper aims to help address these data needs for managing the emergence of new personal mobility devices by reporting mode share data along with a novel empirically-informed taxonomy of all wheeled devices used in cycling facilities.
Mode Share Data for New Mobility Devices
To our knowledge, no published studies have generated classified volume information for all types of vehicles/devices on paths or streets, anywhere in the world (there is no definitional distinction between “device” and “vehicle” in transportation, although “device” is generally used to refer to smaller, non-enclosed vehicles). Few studies have even examined the share of people cycling who are on electric bicycles, and almost all data come from travel survey samples rather than field observations of actual usage. As a few examples, according to travel survey data from the Netherlands, the share of cyclists older than 16 years of age using electric bicycles grew from 4% to 10% between 2007 and 2013 ( 15 ). In a Swiss study of participants in a 2016 “Bike to Work” campaign, 16% of survey respondents used electric bicycles for their commute ( 16 ). No similar data have been reported for North America, where most travel surveys do not distinguish between electric and non-electric bicycles. Even if they did, this type of data does not directly translate into volume shares on transportation facilities.
The only reporting of classified volume data we are aware of is a non-refereed report from Christchurch, New Zealand, in 2020 ( 17 ). For that analysis, 1,640 field observations were manually classified as 79% conventional bicycles, 17% electric bicycles, 3% electric scooters, and <1% other electric-assist micromobility devices (6) or non-electric scooters (3). Electric bicycles were distinguished in the data collection by steady versus flashing headlights and “a visual scan for a hub or bottom-bracket located (mid-drive) motor” (17). Electric bicycle shares ranged from 6% to 50% across 11 data collection locations. Electric bicycle volume data were previously collected at some of the same locations in 2017, and the average electric bicycle share increased from 4% to 15% over those 3 years. Other transportation agencies have likely collected ad hoc data for local applications, but the literature is notably lacking in the reporting of systematically collected data that can serve as reference values for comparison and contextualization.
Classification Systems
All classified vehicle volume data apply, explicitly or implicitly, a classification scheme or taxonomy. A taxonomy is a fundamental knowledge structure in which component entities in a domain are grouped into a set of mutually exclusive and collectively exhaustive categories or taxa ( 18 ). In general, classification systems aim to identify groupings that maximize within-group similarities and between-group differences ( 19 ). Similarities and differences between entities in a taxonomy are determined by the taxonomy’s diagnostic characteristics, or the properties used in classification. Diagnostic characteristics for a reliable taxonomy should be fixed, intrinsic, and readily measurable ( 20 ). A taxonomy is distinct from a typology in that it classifies based on empirical characteristics rather than abstract concepts ( 21 ). Taxonomies are often hierarchical, with a tree-like format that distinguishes larger taxa into sub-classes based on additional diagnostic characteristics. The process of selecting the sequence of diagnostic characteristics in a hierarchical taxonomy can be either upward or downward; that is, successive subdivision of the pooled grouping, or agglomeration of smaller groups ( 20 ). Because the main function of a taxonomy is organizational, diagnostic characteristics should be selected that create distinctions that are relevant and useful within the domain of application (in addition to the diagnostic characteristics being reliable) ( 20 , 21 ).
Classifications of New Mobility Devices
The application of taxonomies to inquiry and analysis enables clear and consistent terminology, effective communication among knowledge users, and common conceptualization and understanding ( 21 , 22 ). Taxonomic framings abound in transportation research and analysis for a range of purposes and entities such as grouping infrastructure, technologies, or behaviors ( 22 – 26 ). For transportation systems, a vehicle taxonomy is a prerequisite for collection and use of classified volume data ( 6 , 7 ). Vehicle taxonomies also provide principled groupings for policy, regulation, and design ( 12 , 13 , 27–29).
Basic diagnostic characteristics for vehicle classification include intended usage (passenger, freight) and medium (road, rail, air, sea). Passenger road vehicles are typically coarsely grouped into automobiles, buses, motorcycles, and bicycles (noting that definitions of each can vary). No consistent classification has emerged to account for the widening array of personal mobility devices, which are often considered to fit poorly within the category of bicycles ( 30 – 32 ). In the absence of a consistent formal taxonomy, informal “folk taxonomies” have produced a befuddling cacophony of terms used to describe the evolving suite of personal mobility devices (most notoriously, the all-purpose “scooter”).
Non-motorized traffic monitoring guidance from the FHWA and others only distinguishes pedestrians from bicyclists, and does not provide a sub-classification of bicycles or wheeled devices ( 6 , 7 ). Motor vehicle regulations often distinguish between motorized and non-motorized bicycles, and researchers have tried to distinguish between “bicycle-style” and “scooter-style” electric bicycles for policy purposes ( 29 ). In practice, the diagnostic characteristics used to distinguish electric bicycles from motorcycles are ambiguous (and often outdated), leading to confusion and legal action, as demonstrated in a protracted recent court case in British Columbia (BC) ( 33 , 34 ).
David Levinson’s “taxonomy of modes” uses reservation requirement, scheduled service, and fixed route as the first three diagnostic characteristics in a hierarchical taxonomy ( 35 ). “Walking” and “Cycling” appear in the taxonomy under No Reservation → Dynamic Schedule → Dynamic route as “Un-mechanized” and “mechanized,” respectively. “Motorcycle, Moped, E-bike, and Segway” appears as a single taxon under No Reservation → Dynamic Schedule → Dynamic route → Motorized → Drive → Alone → ≤Two-wheel.
People for Bikes has advanced an e-bike classification scheme for regulation that has been widely adopted in North America, identifying Class 1, 2, and 3 electric bicycles based on maximum speed (32 km/h [20 mph] for Classes 1 and 2, 45 km/h [28 mph] for Class 3) and type of motor actuation (pedal-actuation-only for Class 1, throttle-actuation allowed for Classes 2 and 3) ( 36 ). The organization explicitly excludes other forms of motorized devices from the classification system, stating “we do not think it is appropriate to insert other types of devices into this bicycle regulatory structure” ( 28 ).
The Society of Automotive Engineers (SAE) created a classification for six “powered micromobility vehicles” using five diagnostic criteria: center column; seat; operable pedals; floorboard/foot pegs; and (dynamically) self-balancing ( 37 ). The secondary classification characteristics for each vehicle type are: curb weight; vehicle width; top speed; and power source. The vehicle type categories are not mutually exclusive (i.e., some categories have overlapping diagnostic characteristics because they include “possible” attributes) nor collectively exhaustive (i.e., not all possible combinations of the diagnostic characteristics are associated with a vehicle type).
Objectives
Summarizing, there is no consistent and detailed vehicle taxonomy that could be applied to comprehensively classify volumes and mode shares on cycling facilities. No known vehicle taxonomy accounts for all existing devices, both motorized and non-motorized, in a set of mutually exclusive and collectively exhaustive vehicle classes. In addition, most classifications use diagnostic characteristics (such as maximum speed or motor power) that cannot be inferred from simple observation. Motivated by the informational and taxonomic knowledge gaps, the objectives of this study are to (1) catalog all motorized and non-motorized vehicles in use on cycling facilities in metropolitan Vancouver, Canada; (2) create a taxonomy of the vehicles using visually identifiable features; and (3) determine volumes and mode shares for each vehicle type.
Methods
Sampling Locations
A field data collection method was developed and deployed in metropolitan Vancouver, BC, Canada, to address the objectives of this study. Classified count and speed data (to be presented in a future article) were collected at strategic sampling locations in off-street cycling facilities of various municipalities in the region. Sampling locations for data collection were selected using a set of 10 criteria presented in Table 1, derived from the project objectives as well as bicycle count location guidance ( 6 , 7 , 38 ). Potential sampling locations were identified using municipal cycling maps, Google Street View, and the researchers’ knowledge of the regional cycling network. The potential locations were surveyed with site visits in summer 2019 to ensure their suitability for the study based on the 10 criteria in Table 1, and 12 locations were selected to balance temporal and spatial coverage.
Sampling Location Selection Criteria and Rationale
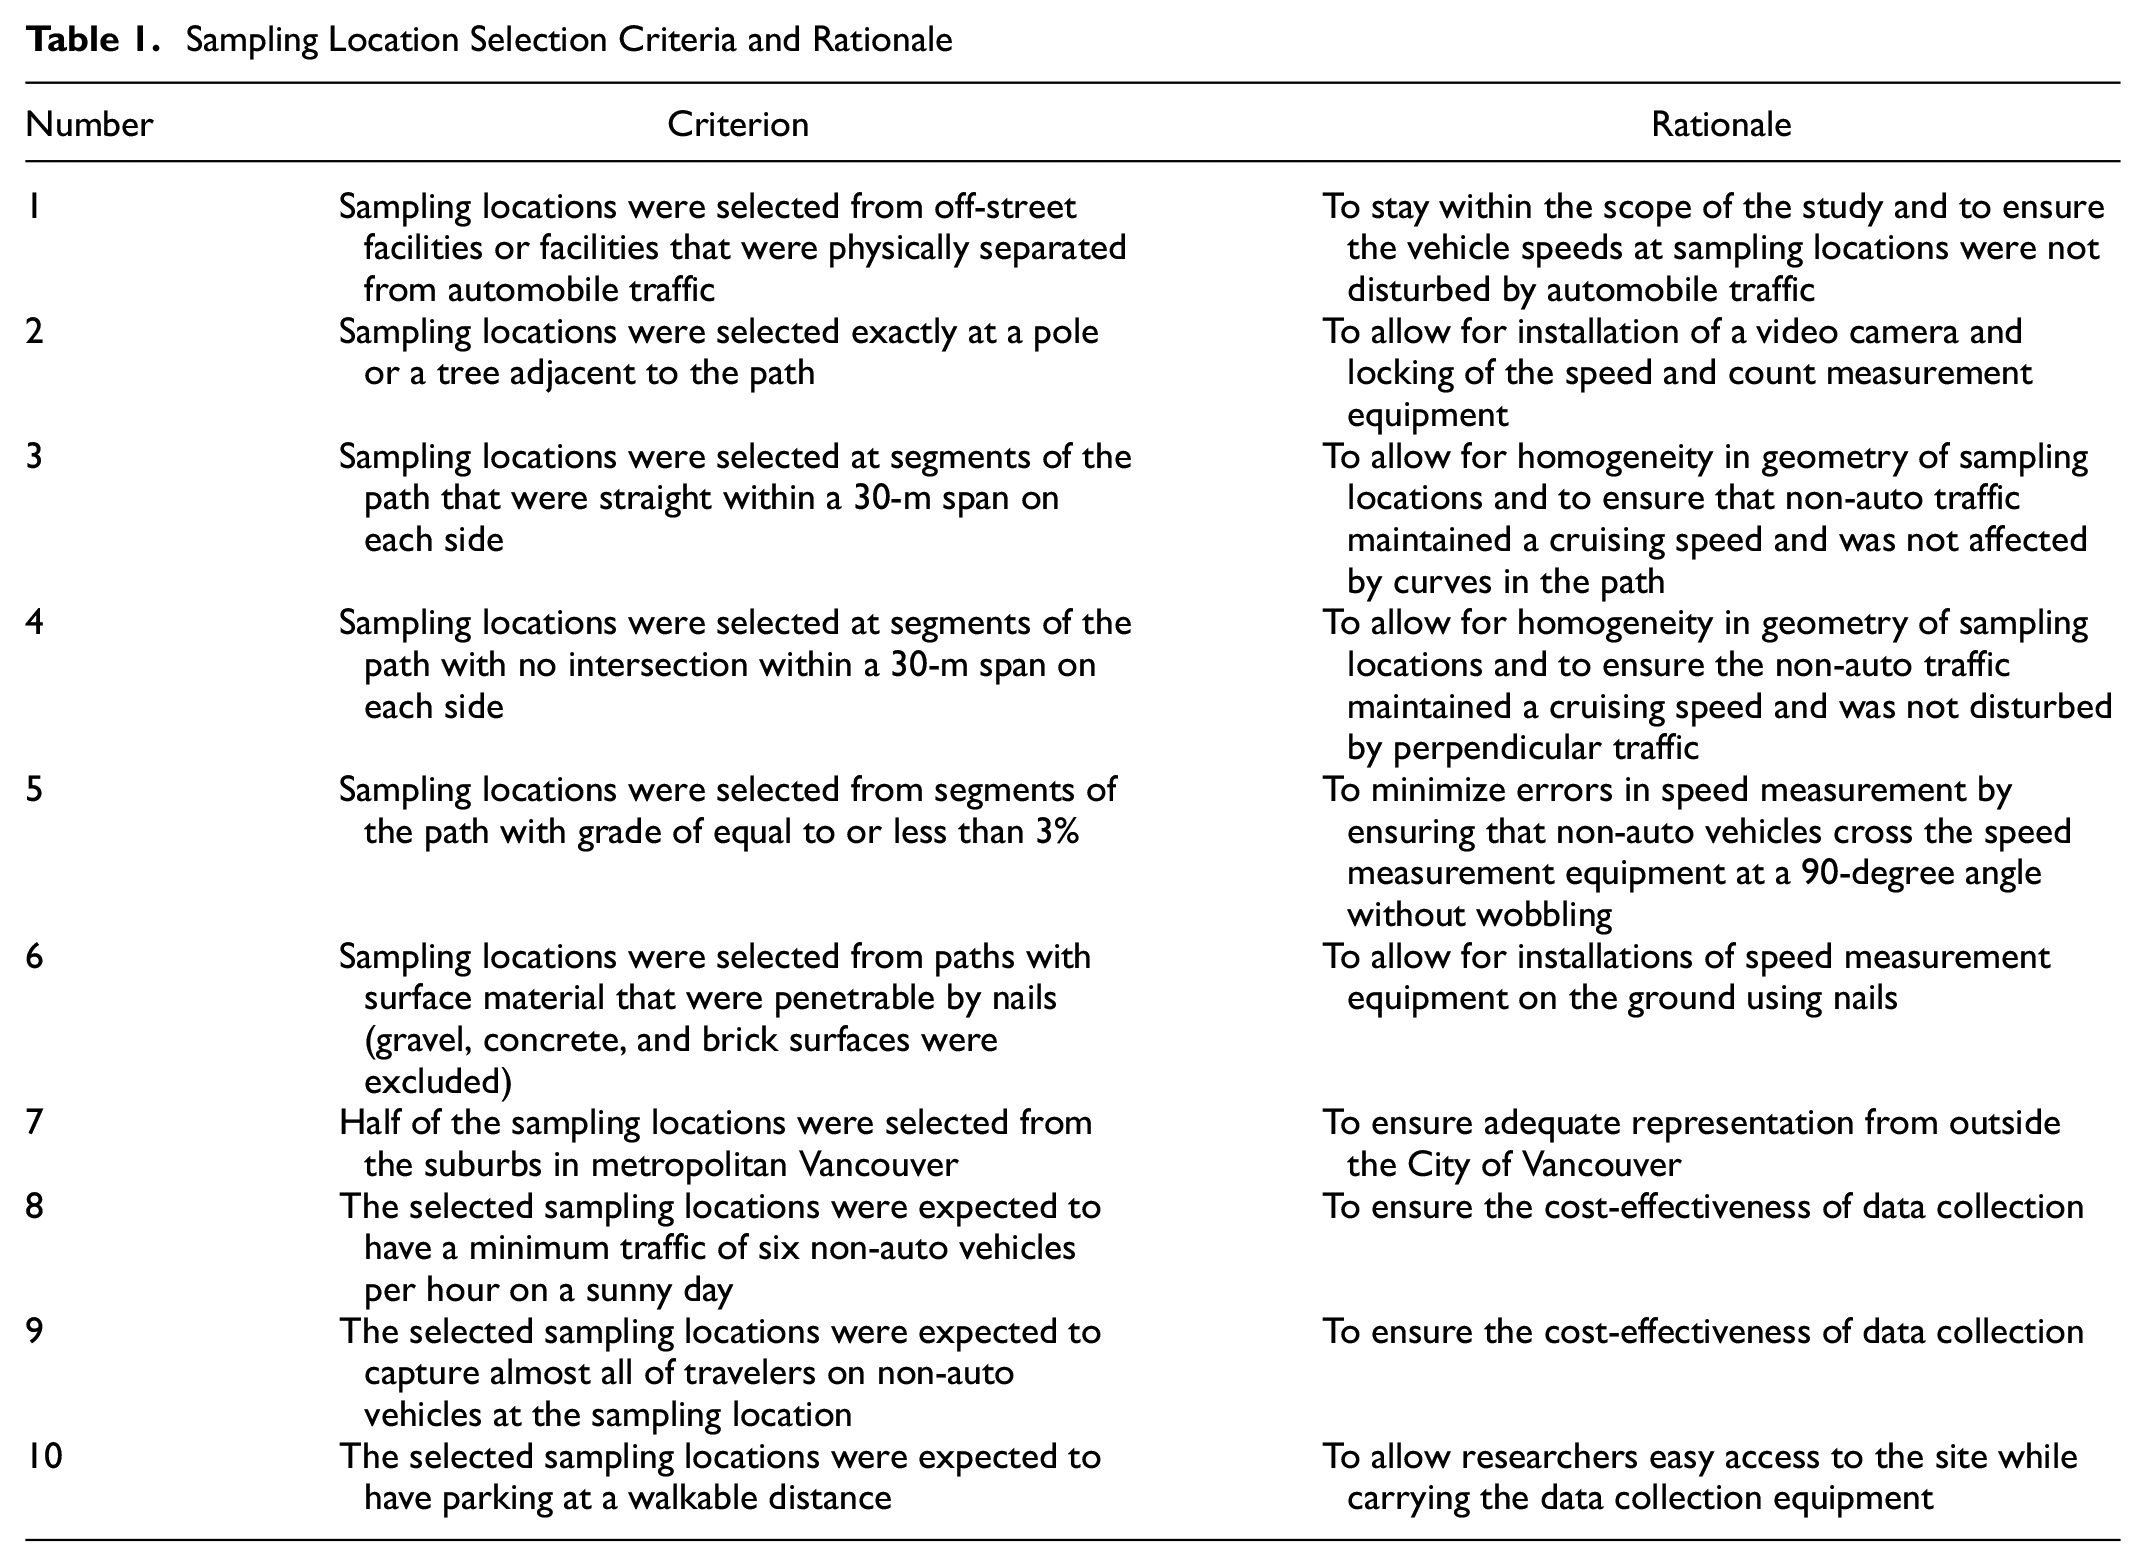
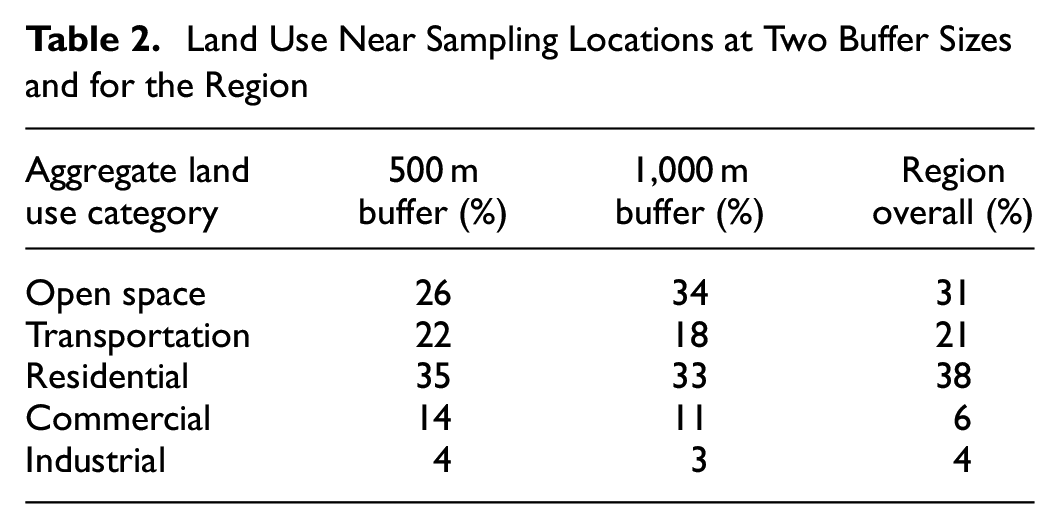
Figure 1 shows the 12 sampling locations in metropolitan Vancouver. Each of the cities of West Vancouver, North Vancouver, New Westminster, and Richmond are represented by one sampling location. There are two sampling locations in Burnaby, two at the University of British Columbia campus in the University Endowment Lands, and four in the City of Vancouver. Table 2 summarizes the distribution of land use characteristics at 500 m and 1,000 m buffers around the sampling locations, in comparison to the region overall. Land use data were taken from Metro Vancouver open data ( 39 ). The sampling locations are generally representative of the regional land use mix, with a slight shift from residential to commercial areas.
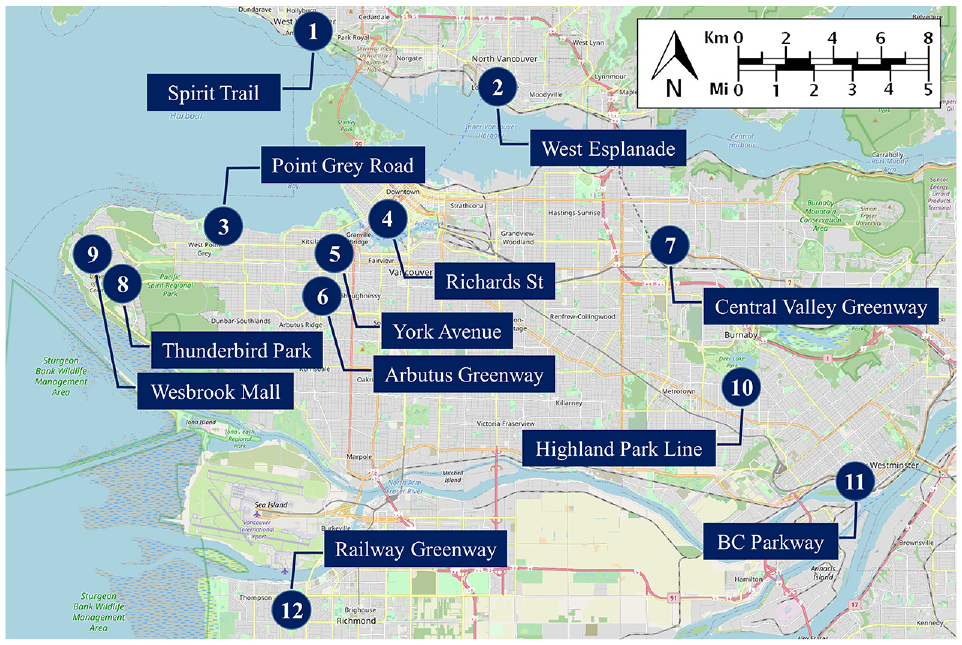
The 12 sampling locations for data collection in metropolitan Vancouver.
Land Use Near Sampling Locations at Two Buffer Sizes and for the Region
Five of the sampling locations (2, 3, 4, 5, and 9 in Figure 1) were physically separated cycle paths with no pedestrian access (and parallel pedestrian facilities); the other seven sampling locations were multi-use paths shared with pedestrians. Photos of the cycling facilities at three sampling locations, Richards Street (one-way cycling path separated from traffic by paint buffer and on-street parking), York Avenue (two-way cycling path separated from traffic by concrete barrier), and Arbutus greenway (two-way multi-use path) are presented in Figure 2.
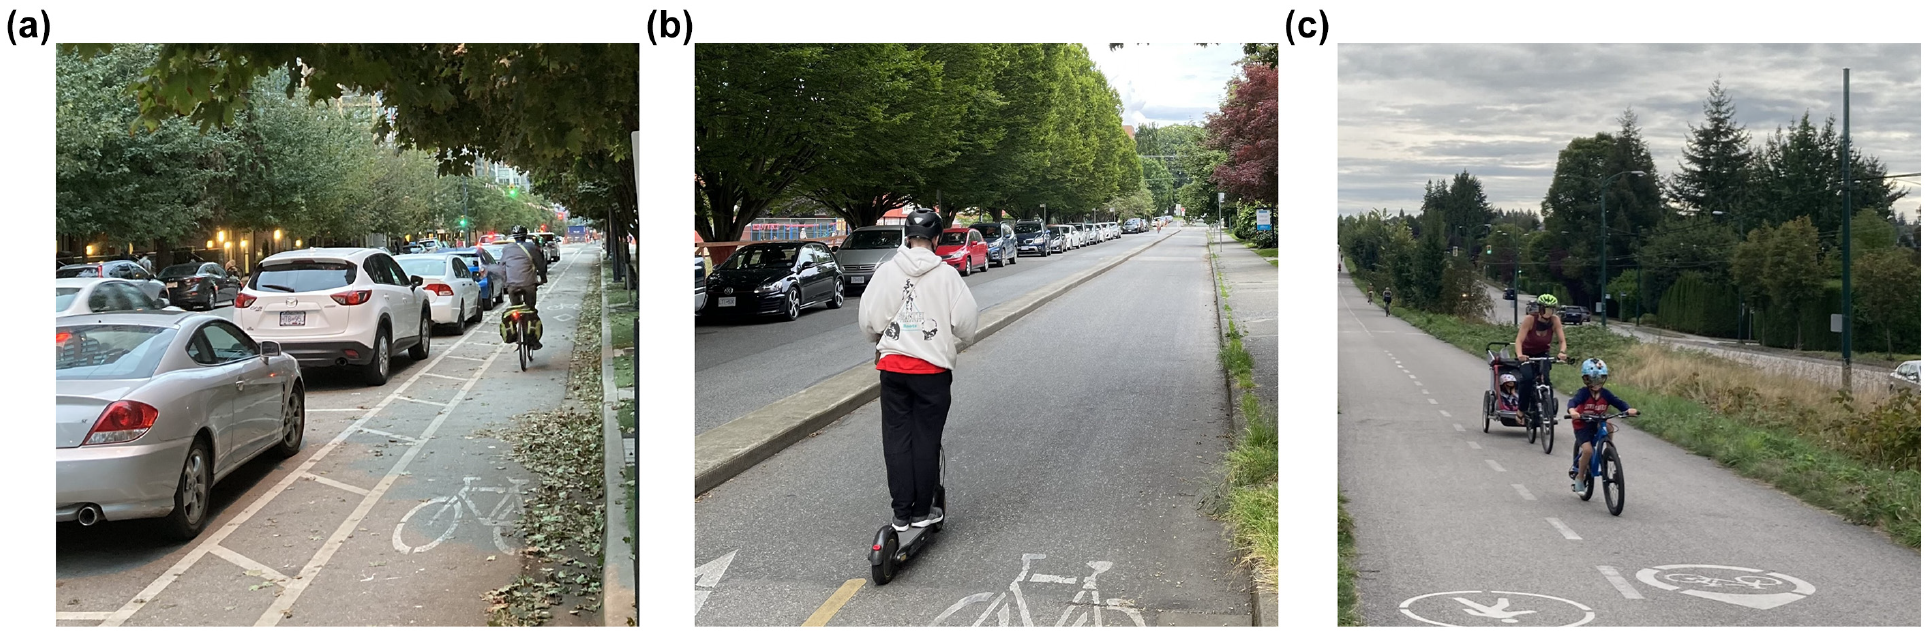
Sample images of data collection locations (a) Richards Street, (b) York Avenue, and (c) Arbutus greenway.
Data Collection
The data collection period covered four seasons from summer 2019 to spring 2020. In each season, data were collected at every sampling location (in random order) on one weekend and one weekday. The hours of data collection in each weekday and weekend covered the respective traffic volume peaks based on trip data from Vancouver’s Mobi bikeshare system in 2019: 8:00 to 9:00 and 17:00 to 18:00 on weekdays, and 14:00 to 15:00 on weekends. On weekdays, data were collected typically from 8:00 to 18:00, and on weekends, typically from noon to 16:00. Data were not collected after 18:00 because of low lighting after sunset in the winter.
During study design, we examined 12 different technologies for collecting classified vehicle volume data on off-street paths (along with speed data, which will be used in future work). The examined technologies measured speed manually (COUNTcam2 traffic recorder, two camcorders with a stopwatch, and infrared break-beam sensors with a camcorder) or automatically (computer tracking by one camcorder, Miovision Scout, or Drone; Black CAT Radar Cycle Detection, Viacount2, Armadillo Tracker, RidePod BT5926, Eco-Counter/Mobile MULTI, and TruCAM II Speed Enforcement Laser). For each technology, we considered the reliability, feasibility, and efficiency for a high-volume, multi-season data collection, informed by literature and guidance documents ( 6 , 7 , 41 , 42 ). Only manual classification methods were sufficiently reliable for the research objectives, and so the selected instrumentation pairs a vehicle passing event trigger with manual classification from synchronized video data. Bicycle-specific pneumatic tubes were selected for vehicle detection because of consistent performance across weather conditions and less interference from pedestrians on mixed-use paths than computer vision or electromagnetic proximity methods (e.g., radar, lidar).
At each sampling location, data were collected with bicycle-specific pneumatic tube counters (MetroCount RidePod® BT) and a sport camera (GoPro Hero5 Black). The MetroCount RidePod BT can perform well for counting cyclists in both rainy and dry weather ( 41 ), which was confirmed by internal pilot testing with 100% detection of 70 test passes. Pneumatic tubes were placed across the path to record timestamped data on the passing of vehicles. The GoPro camera, installed on a pole or tree next to the pneumatic tubes on the path, recorded simultaneous video footage of the passing vehicles. The video footage was synchronized with the tube data by timestamp. The camera was positioned at shoulder height and angled slightly down to record the vehicle type and to avoid recording faces. This method, while limiting the personal factors extracted from the video data, ensured that the privacy of travelers was protected. The research methods were approved by the Behavioural Research Ethics Boards of the University of British Columbia (UBC), under approval H19-02066.
Data Processing
The pressure change observations recorded when a vehicle passed over the pneumatic tubes (raw data from tube compressions) were initially processed using the classification scheme “shared path +” in MetroCount Traffic Executive™ Software v5, which identified two categories to differentiate non-vehicles (pedestrians or noise) from observations of interest (vehicles). Further manual data cleaning was conducted using the video data. First, observations from the “vehicle” cluster were removed that (1) did not have video footage because of battery drainage, researcher error, and so forth, or (2) had video footage but were not visible because of low lighting, glare, occlusion by pedestrians, and so forth. Second, observations from the “vehicle” cluster were removed that were actually pedestrians stepping, rolling a stroller, or rolling a walker on the tubes. Lastly, duplicate observations made by three (or more) axle vehicles and observations because of noise (not caused by any visible objects on the pneumatic tubes) were removed.
The filtered and cleaned data were then manually coded by recording 10 key pieces of information (attributes) visually identifiable by the researchers:
Does the vehicle have a visible battery or motor (electric-assist)?
Does the vehicle have pedals?
How many seats does the vehicle have?
Does the vehicle have handles?
Does the vehicle have a seatback?
Is the vehicle attached to the feet?
How many axles does the vehicle have?
How many wheels does the vehicle have?
Does the vehicle have built-in cargo space?
Is the vehicle a shared vehicle?
Before coding, the researchers were trained to familiarize themselves with a photo bank of various personal mobility vehicles. The photo bank was created by internet search using combinations of keywords such as “personal,”“low-power,”“electric,”“motorized,”“lightweight,”“hybrid,”“active,”“mobility,”“micromobility,”“transportation,”“transporter,”“rideable,”“cycle,” and “vehicle.” Various brands and types of electric-assist vehicles were included and labeled to ensure familiarity with different types of battery and motor placement, size, and appearance (battery in the frame, on the frame, in the rear rack, or on the front rack; motor in the front hub, rear hub, bottom bracket, or down tube, etc.).
Bicycles from the three bikesharing services active in metropolitan Vancouver at the time of data collection were also included in the photo bank: Mobi in Vancouver; HOPR on UBC Campus; and Ucycle in Richmond. Mobi is a station-based bikesharing service, while HOPR and Ucycle are dock-less bikesharing services with designated “drop zones.” All three services used non-electric bicycles. No other sharing services were operating in the region at the time of data collection; however, other sharing services such as Evolve E-Bikes in Vancouver and Lime Electric Bikes in North Vancouver were launched in the region after the study.
An interrater reliability test was conducted to determine the reliability of the manual coding between two researchers, who separately coded the 10 questions using video data for 150 randomly selected vehicles. The level of agreement between the researchers in answering coding questions was measured using Cohen’s Kappa, which takes the possibility of the agreement occurring by chance into account ( 43 ). The result of the interrater reliability test showed “almost perfect” agreement between researchers coding the first (motorized) question (Kappa of 0.98) and perfect agreement (Kappa of 1.00) for the rest of the questions.
An exhaustive taxonomy of all coded vehicles was created using all observed combinations of the 10 coded attributes from the 10 questions above, and a vehicle type name given to each category based on the photo bank described above. We then created a hierarchical taxonomy using the same visually identifiable diagnostic characteristics, sequenced in a tree-like format to ensure that categories in each level of the taxonomy are mutually exclusive and collectively exhaustive. Diagnostic characteristics are selected for the more aggregate levels of the taxonomy, based on the guiding principles of class differentiation that is (1) relevant to decision-making and/or analysis (i.e., with potential implications for policy, regulation, or design), and (2) practically useful (i.e., produces non-trivial mode shares).
The counts of coded (classified) vehicles were converted to mode shares for each taxon (vehicle type) by hour, location, facility type, and season. Hourly traffic patterns at each location and the global average were created for weekdays and weekends and compared with Mobi’s usage data in Vancouver in 2019. Mobi system data were downloaded from their website ( 44 ).
Results
Over 450 h of video data were used in the analysis, which required approximately 300 person-hours of researcher time for cleaning and coding. In the raw count data set, 31,707 hits (pressure change observations) were registered on the pneumatic tubes. Using the MetroCount “shared path +” classification scheme, 3,396 hits were classified as non-vehicles (i.e., pedestrians or noise) and filtered from the data set. In further manual data cleaning, 1,686 observations were removed because of no/low vehicle visibility in video data, and 1,343 observations were removed because they were a pedestrian or duplicate observation. The number of vehicle observations after filtering and cleaning was 25,282.
Observed personal mobility vehicles were classified into 27 categories based on the 10 visually identifiable features described above. Figure 3 illustrates the taxonomy of personal mobility vehicles observed in metropolitan Vancouver cycling facilities and multi-use paths, with the coding used for classification, the name given to each vehicle, and sample diagrams for 12 vehicles. Below the 27 base-level categories that use all 10 diagnostic characteristics, Figure 3 illustrates 2 aggregate classifications in the taxonomy based on the first 2 diagnostic characteristics: motorization and pedals. Figure 3 includes mode share data for each vehicle type category at each level of the taxonomy. Table 3 gives more detailed count and mode share data for all 27 vehicle types.
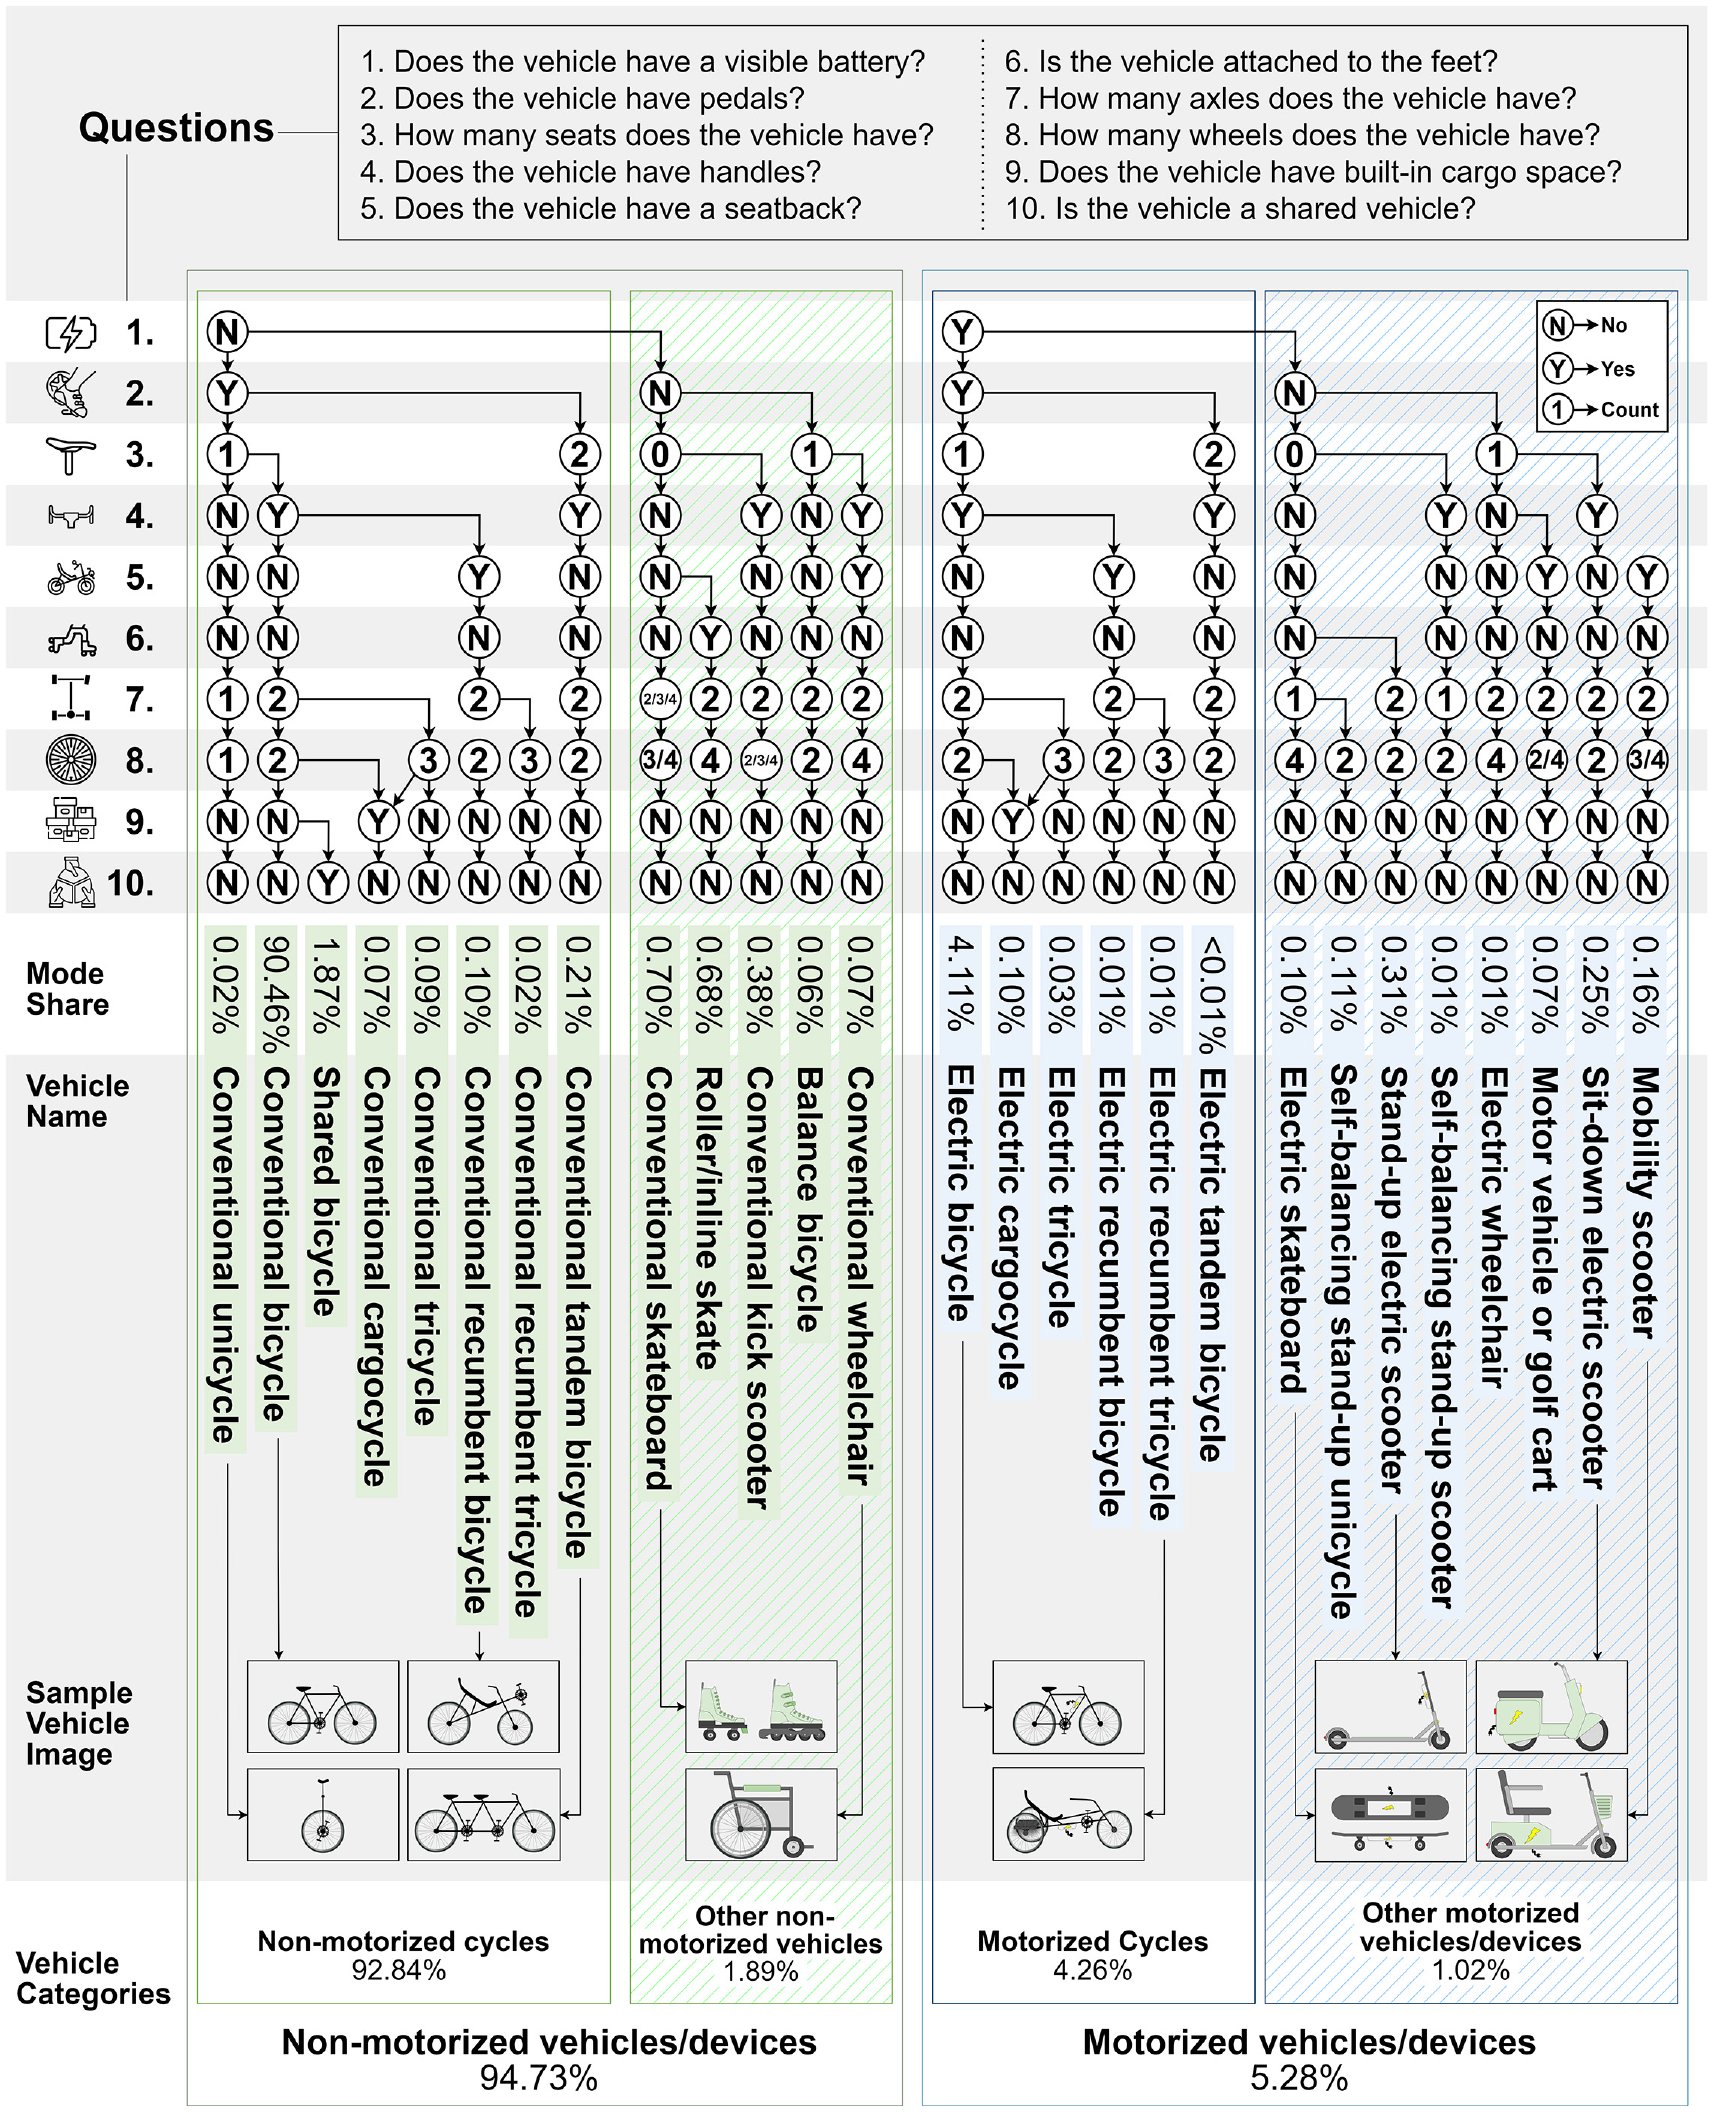
Taxonomy of personal mobility vehicles based on 10 observable features.
Classified Count and Mode Share for Each Observed Vehicle Type
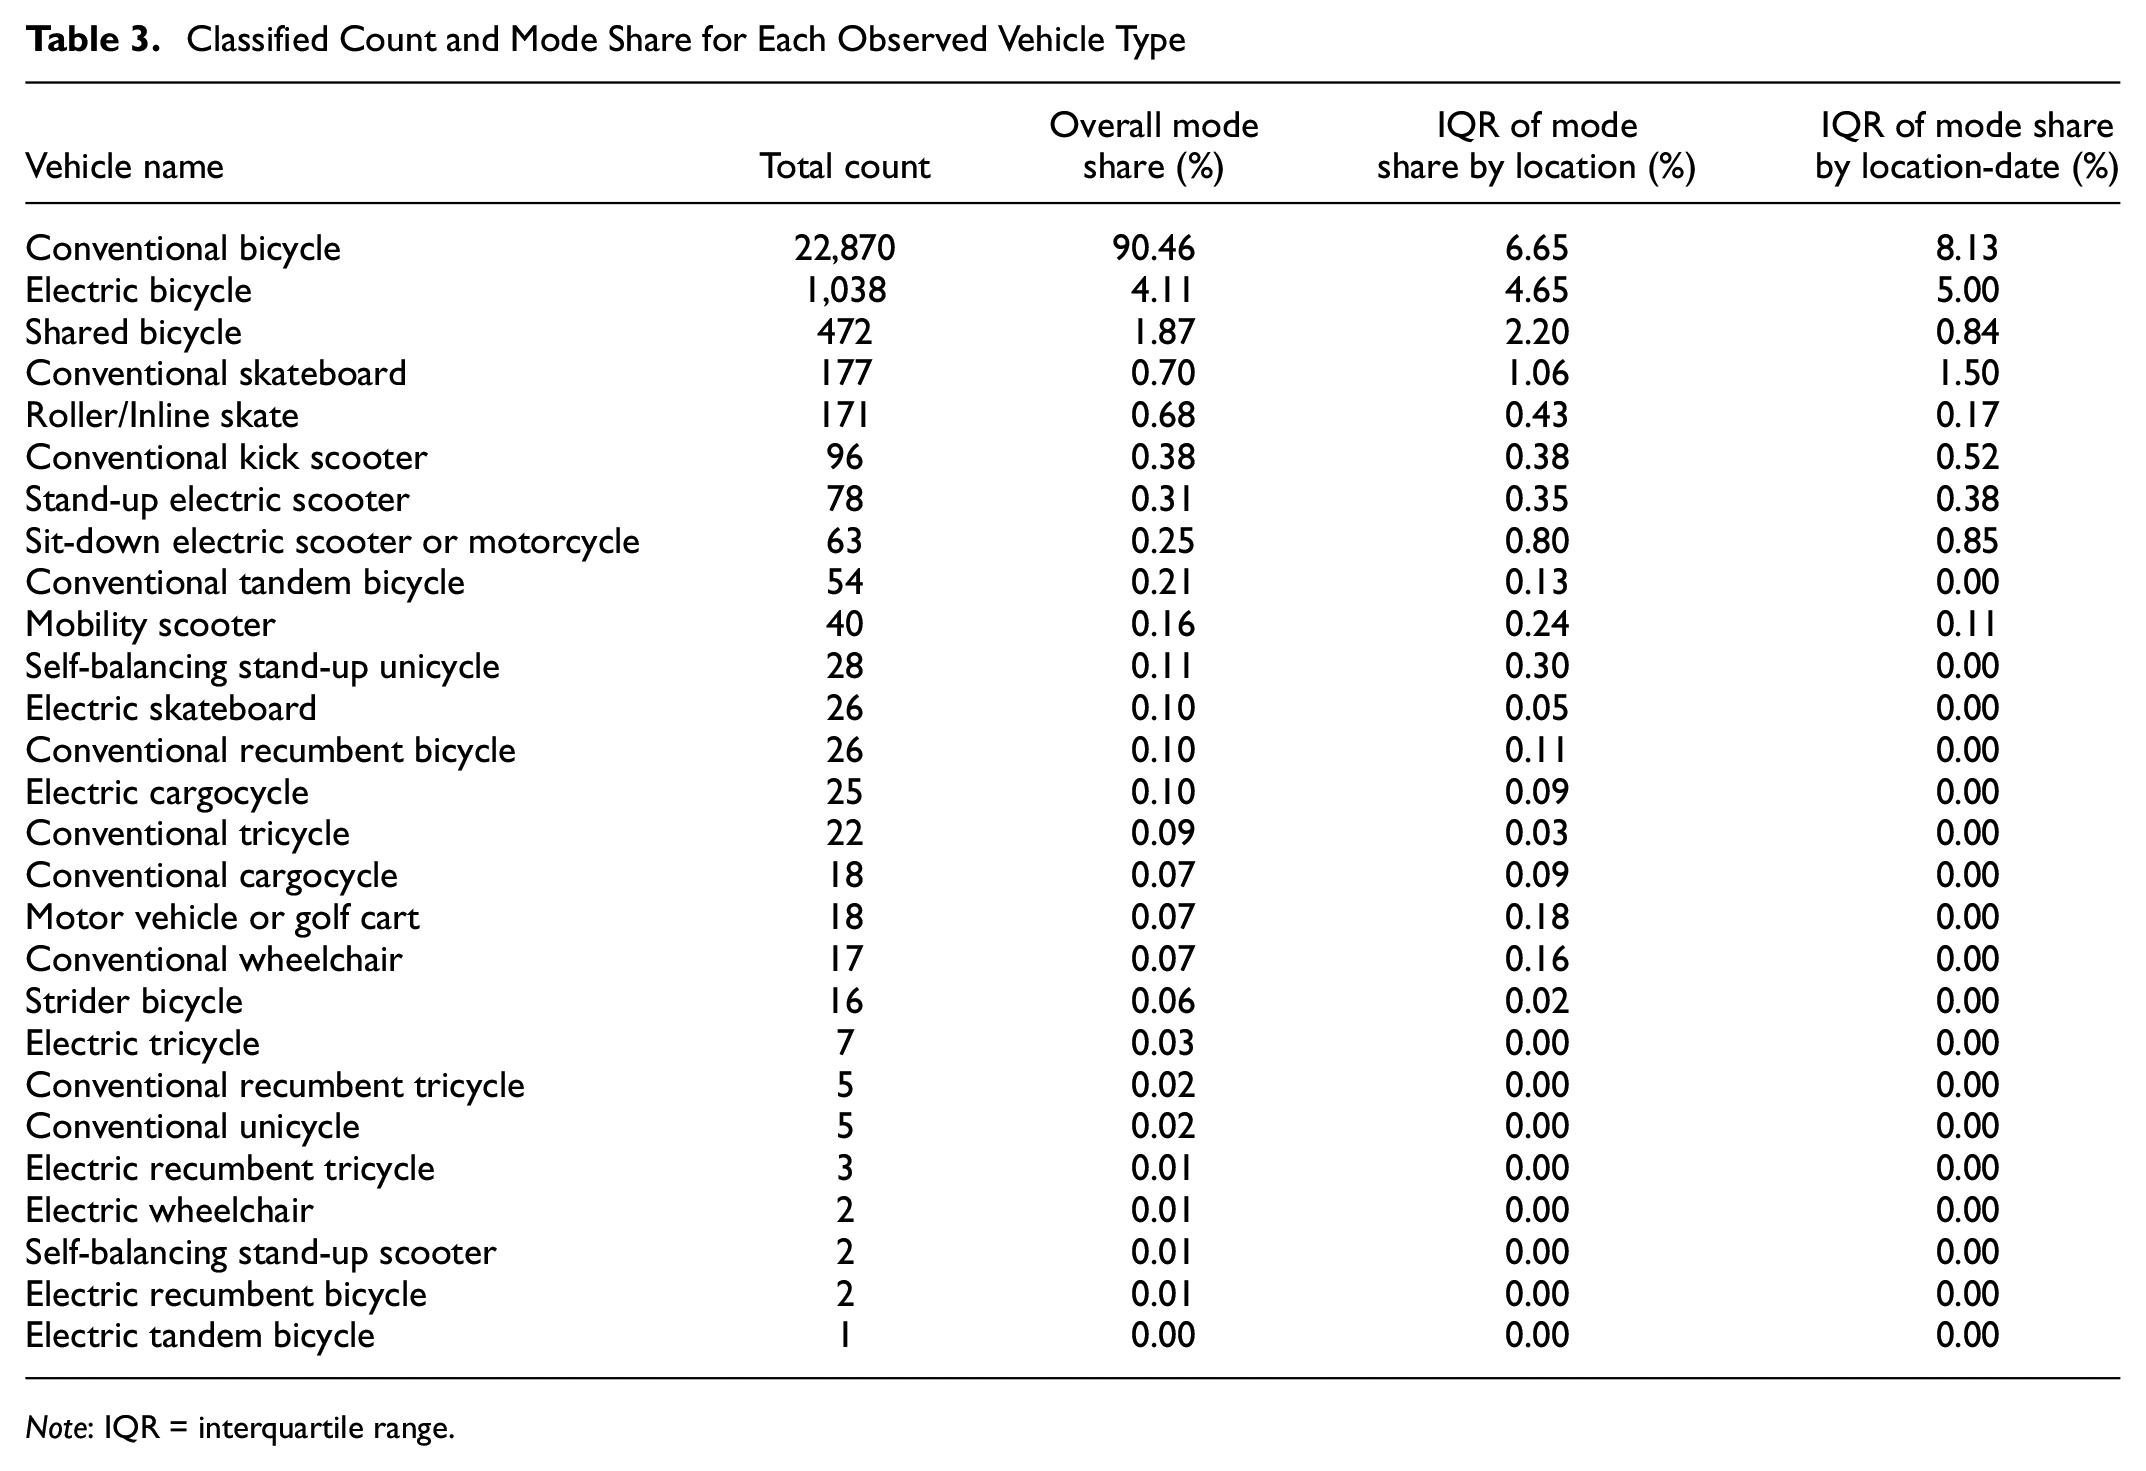
Note: IQR = interquartile range.
The most dominant observed vehicle type was conventional (non-electric) bicycles with a mode share of 90.5%. The second most common vehicle type was electric bicycles with a mode share of 4.1% (ranging from 0% to 20% across location-dates), followed by (conventional) shared bicycles with a mode share of 1.9%. The rest of the vehicle types comprise less than 1% each and have a combined total of less than 4%. Only conventional skateboards and roller/inline skates had a mode share above 0.5%. Motor vehicles, including private cars (five observations), trucks (one observation), golf carts (12 observations), sit-down motor scooters (56 observations), and motorcycles (seven observations), were also observed in the cycling facilities—more frequently than some of the micromobility devices. Based on the BC Motor Vehicle Act (MVA) regulations (see below in the discussion section), 11 of the observed vehicle types were illegal to operate in cycling facilities, with a combined mode share of 2.4%. About half (14) of the 27 vehicle types are motorized, with a combined mode share of 5.3%.
The hierarchical taxonomy is summarized in Figure 4. The base-level (disaggregate) classification identifies 27 vehicle types using 10 diagnostic features. As described in the section on methods, the diagnostic characteristics for the higher-level (aggregate) classifications were selected based on practical relevance and discriminating mode shares. Differentiation by motorization and pedals aligns with much of existing regulation, research, and practice (see the introduction and discussion sections). It also likely produces operationally distinct vehicle classes for facility design purposes, although that has yet to be established. These two diagnostic characteristics also produce the most volume-balanced categories, although mode shares for any aggregate classification will be dominated by the conventional bicycle category (Table 3). Using other diagnostic characteristics yields excessively small/rare vehicle types (<0.1%), which decreases the practical utility of the classified volume data.
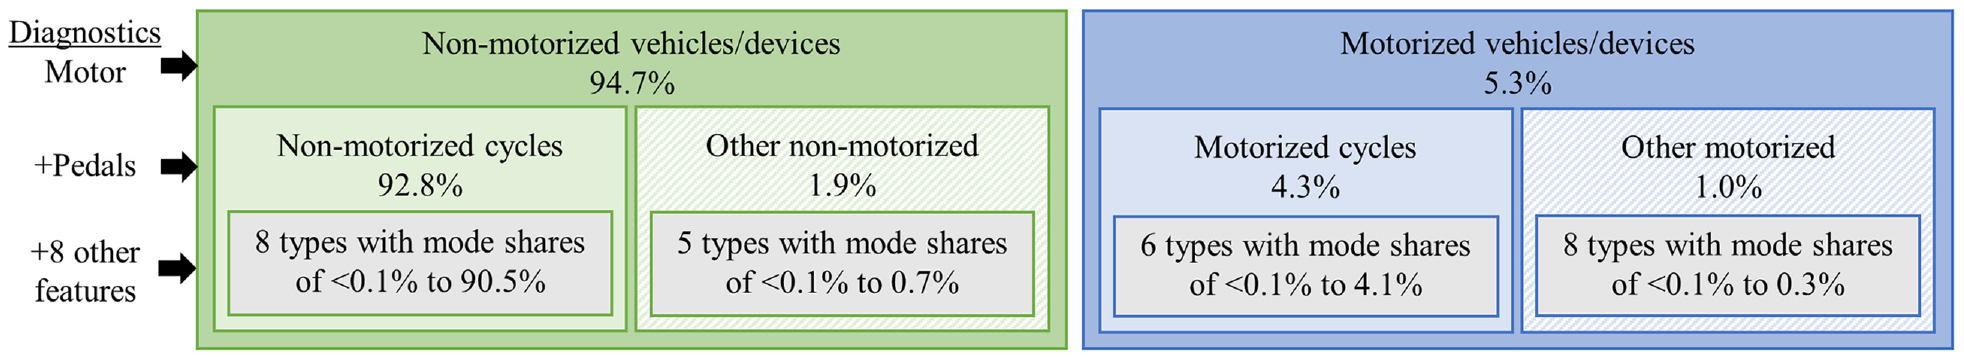
Three-level hierarchical taxonomy for all vehicles on cycling facilities.
Table 4 presents mode share data for the middle-level four-type classification, segmented in three ways: over the four seasons of data collection; for two facility types (multi-use path versus cycling path); and inside versus outside the home zone of Vancouver’s bikeshare system (Mobi). Mobi’s territory includes Downtown Vancouver and its surrounding neighborhoods, which have the densest cycling infrastructure in the region, and so it is used as a proxy for the highest activity cycling area in the region ( 45 ). Mode share distributions were generally consistent over the four seasons of data collection (p-values > 0.07 based on paired chi-square tests), and were similar between multi-use and cycling paths (p-value = 0.17). Mode shares at locations outside the Mobi station territory in Vancouver were also not significantly different from those inside the Mobi station territory (p-value = 0.32), despite small increases in the share of motorized vehicles outside the Mobi station territory. In spring 2020, the government of BC declared a provincial state of emergency over the COVID-19 pandemic. While media and industry sources reported increases in e-bike sales ( 46 – 48 ), our mode share data from the first two months of the pandemic do not show a significant difference in the mode share of electric-assist devices.
Count and Mode Share by Season, Facility Type, and Bikeshare System Zone
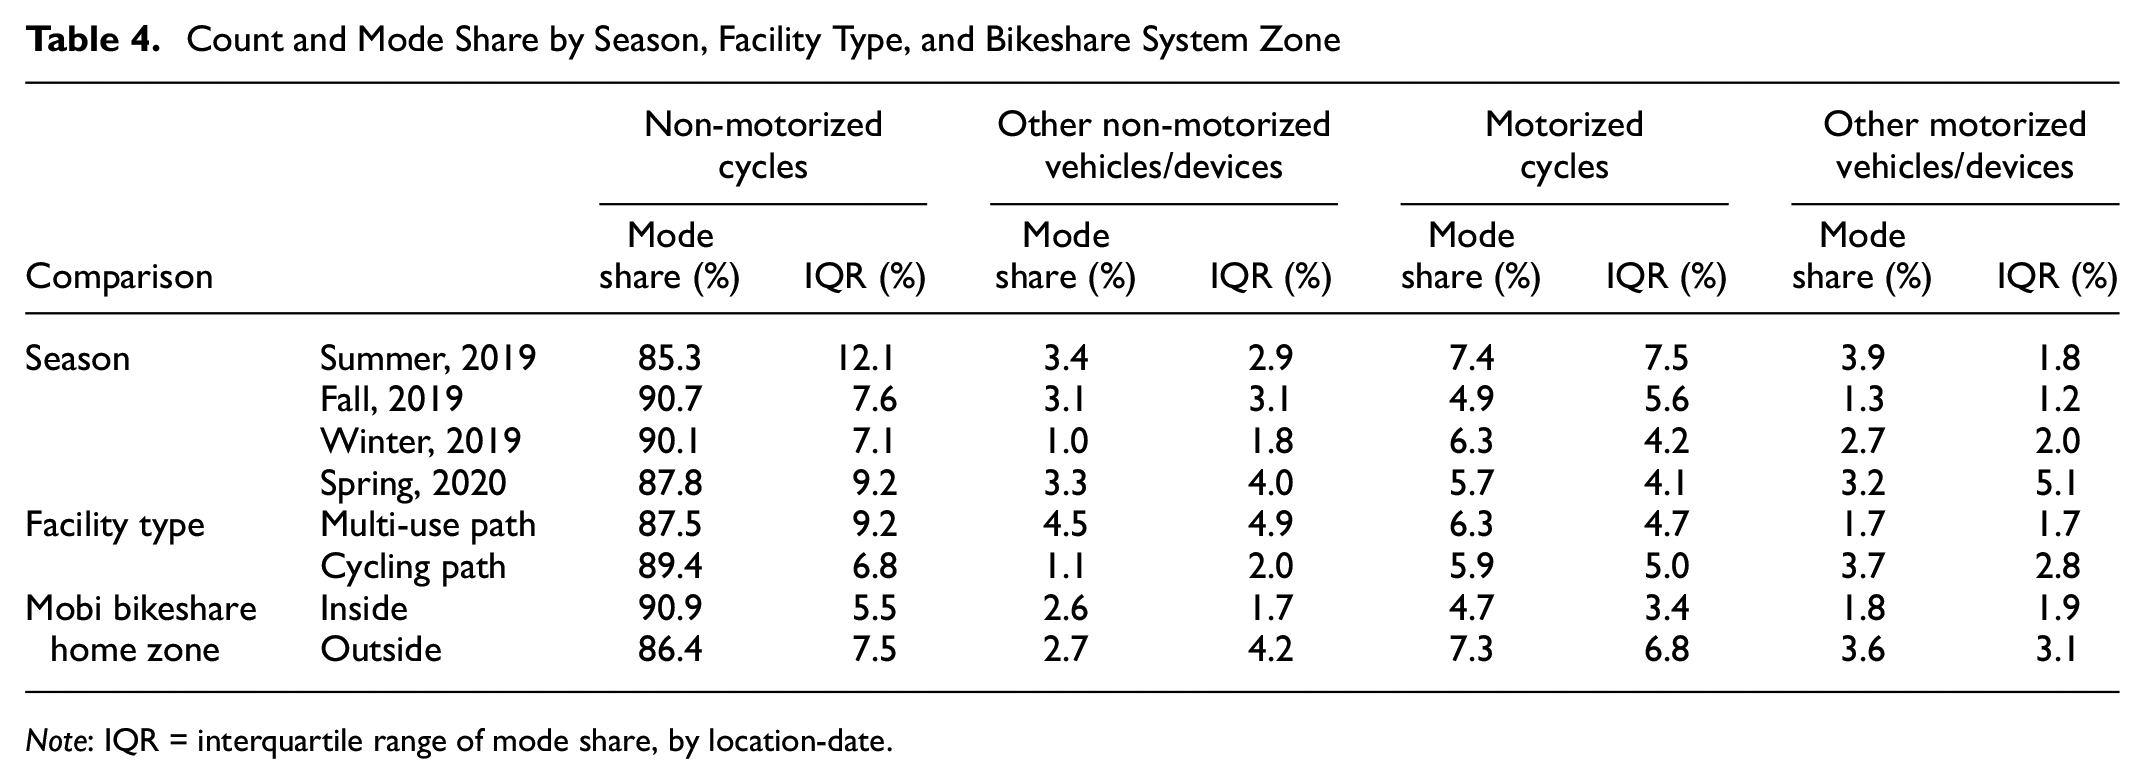
Note: IQR = interquartile range of mode share, by location-date.
Figure 5 presents the temporal pattern of hourly traffic volumes at the sampling locations, with a comparison to Mobi’s hourly usage in Vancouver in 2019. Hourly volumes are normalized to daily volume for each sampling location. Normalized volumes are reported for motorized and non-motorized vehicles/devices (blue and green lines, respectively) averaged across all locations, and for all vehicles at each individual location (gray lines). Because of very low mode shares, hourly data could not reliably be reported for more disaggregate vehicle classifications in the taxonomy. The red line shows hourly normalized volumes of Mobi bikeshare system-wide usage. Similar peak periods on weekday mornings and early evenings, and weekend afternoons, are visible in both our data and Mobi usage. The hourly motorized vehicle volumes are more dynamic, probably because of the much smaller sample size than for non-motorized vehicles.
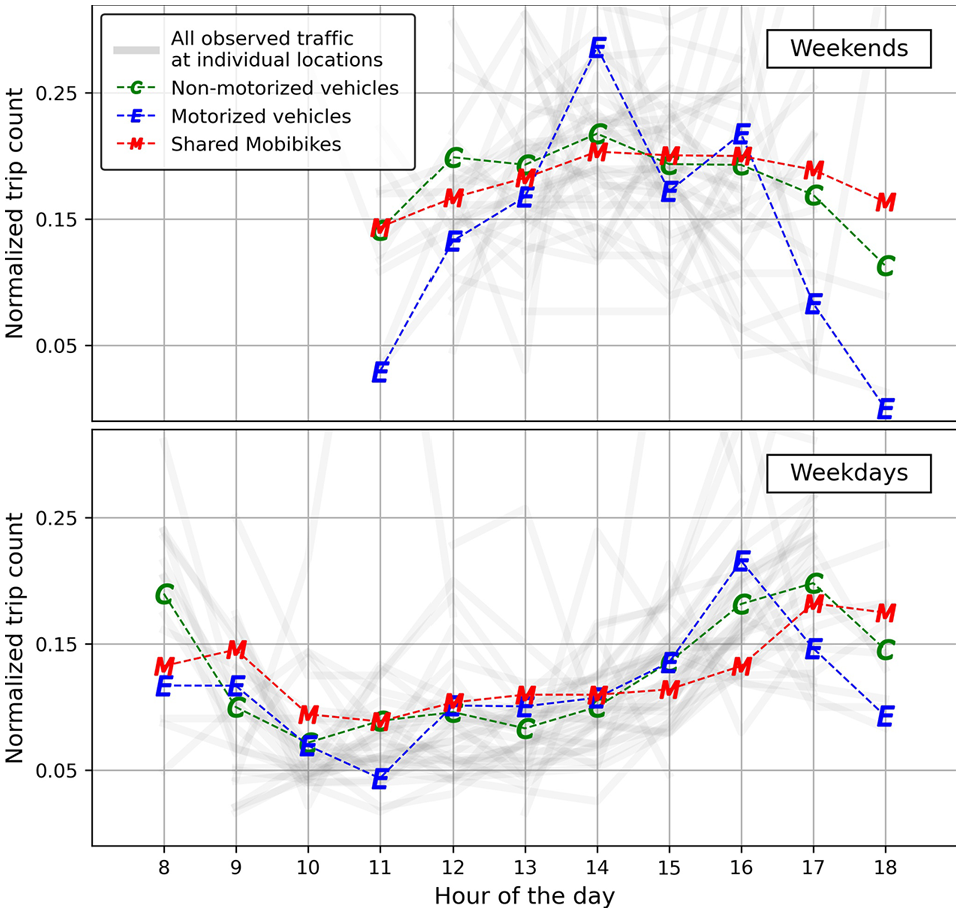
Hourly distribution of observed motorized and non-motorized vehicle volumes, in comparison to average Mobi bikeshare usage (from system data).
Discussion
Observed Vehicles and Mode Shares
This study cataloged the vehicles being used in multi-use paths and cycling facilities in metropolitan Vancouver, Canada, as of spring 2020, with an original taxonomy of 27 unique vehicle types based on 10 observable features. We also report volume and mode share data for each vehicle type through four seasons of data collection. Conventional bicycles were by far the dominant mode of transportation in Vancouver cycling facilities, and while a wide variety of new mobility devices were observed, their mode shares were very small. The average mode share of electric bicycles was just 4.1% (ranging up to 20% by location-date), which was somewhat lower than what we expected to see at the start of the study, and at the low end of mode shares reported in the literature from past survey-based studies in Northern Europe ( 15 , 16 ). A more similar data set from New Zealand also reported higher average electric bicycle mode share (17%), but was even more variable (ranging from 6% to 50% by location) and highly dynamic (increasing almost four-fold between 2017 and 2020) ( 17 ). No similar data have been reported for North America, so we cannot compare our results to more geographically relevant studies.
Many of the vehicle types observed in this study were not legal to operate on paths either under the BC MVA or local bylaws. The BC MVA only allows for operation of motor vehicles (including motorcycles and limited-speed motorcycles) and cycles (including motor-assisted cycles) on public rights-of-way ( 27 ), which excludes 11 of the 27 vehicle types observed in this study. Cycles are defined as a device having operable pedals or hand crank and any number of wheels, but there is considerable ambiguity in the statute with respect to some vehicles such as sit-down electric scooters with optional pedals ( 33 , 34 , 49 ). Mobility aid vehicles, such as conventional and electric wheelchairs and mobility scooters, are regulated in the same way as pedestrians, and therefore can be operated in multi-use paths but not cycling facilities.
The City of Vancouver explicitly bans three device types everywhere (electric skateboards, self-balancing stand-up scooters, and sit-down scooters), and bans electric bicycles from operating on the Seawall and park paths ( 50 ). Violations can result in fines as high as $600 ( 51 ). The City of North Vancouver adopted bylaws banning the use of roller/inline skates, skateboards, and electric kick scooters on 44 roadways because of safety concerns ( 52 ), and violations can result in fines up to $100 ( 53 ). The District of West Vancouver has also adopted bylaws banning roller/inline skates and skateboards on any West Vancouver road ( 54 ). Little empirical data are available to inform these types of vehicle restrictions, and research is needed to determine the impacts of the observed non-compliance with regulations, and strategies to either update regulations, enhance compliance, and/or mitigate any negative impacts.
More recently (after the data collection), electric stand-up scooters (kick scooters) have been conditionally added to the BC MVA to accommodate an “e-scooter” pilot project in BC. Under this program, privately-owned electric kick scooters are allowed within 5 municipalities in metropolitan Vancouver, with regulations such as an age limit of 16 years or older, use of a helmet, and a maximum speed of 24 km/h (15 mph) ( 55 ). The data reported here provide an opportunity to study empirically the volume impacts of this type of regulatory change, as well as other potential regulatory changes, such as those related to electric cargo cycles ( 56 ), quadricycles ( 57 ), or bike buses ( 58 , 59 ). Beyond volume and mode share impacts, further research would also be needed to understand key design vehicle characteristics, such as speed, turning radii, and stopping distances.
Proposed Taxonomy
The proposed taxonomy is unique in that it uses only visibly identifiable features for diagnostic characteristics, and it accounts for all existing devices, both motorized and non-motorized, in a set of mutually exclusive and collectively exhaustive vehicle classes. The taxonomy can be applied to reliably collect classified volume and mode share data on cycling facilities by observation. The taxonomy uses some of the same diagnostic characteristics as the SAE 6-vehicle micromobility classification ( 37 ) (pedals, seat), but excludes the vehicle features identified in the SAE that are not readily observable or functionally diagnostic (floorboard/foot pegs, self-balancing). It also avoids the ambiguity of the existing MVA regulatory classes (described above), while including the key policy-relevant features of motorization and pedals.
Although manual classification proved to be reliable in the interrater reliability tests reported above, it is time-intensive. Each hour of video data required approximately 40 min for cleaning and coding. The hierarchical organization of the taxonomy enables more aggregate classification in a way that is still relevant to practice and decision-making and comparable to data sets collected at other levels of the hierarchy, but uses fewer diagnostic characteristics (reducing coding resource demands by identifying 1 to 3 vehicle features rather than 10). Future work should explore the possibility of automated classification using machine-learning image processing methods, although we anticipate challenges because of the wide variety of device and user appearances.
A weakness of the aggregate levels of the taxonomy is that the “other” vehicle groupings include a large variety of vehicle features. Our empirical data indicate that each of the vehicle sub-types within the “other” categories comprise a very small share of vehicles (<1%). This result could be different in the future with greater uptake of new devices, or in locations with large sharing services for a specific type of mobility device (such as e-scooters). In those cases, further differentiation of the “other” categories may be warranted using additional diagnostic characteristics, such as number of wheels or presence of a seat, seatback, or handlebars. Future research on the operational differences among new mobility devices, such as in Landis et al. ( 30 ), can be used to either collapse or segregate vehicle categories to ensure relevance for policy, regulation, and/or design.
Another weakness of the taxonomy is that it does not make two vehicle distinctions identified in vehicle regulations. The first distinction is between standard passenger motor vehicles (with requirements for licensing, plating, and insuring) and other non-pedaled motorized personal mobility devices. “Motor vehicles” could perhaps be identified by a diagnostic characteristic, such as having license plates, which could be explored in future research. We did not take this approach because it would only discriminate compliant motor vehicles (and not unlicensed motor scooters, for example). The second regulatory distinction absent from our taxonomy is mobility assistance devices for travelers with ambulatory disabilities (which are operationally classified as pedestrians). These vehicles (mobility scooters, wheelchairs) are not inherently distinct under the MVA—their regulatory class depends on the status of the operator as an “invalid,” which could not be reliably discerned in an observational coding. Future work could explore a qualitative coding for mobility assistance devices based on assumed vehicle design intent.
Data Limitations
A limitation of our data collection method is the reliance on pneumatic tubes for vehicle passing event triggers, which may have missed some wheeled devices. Our pilot testing and data cleaning process indicated that counting errors were primarily “false positives” (i.e., pedestrians), but there were some instances of people on bicycles or skateboards jumping over the tubes, and bicycle counters can undercount for a variety of reasons ( 6 ). Given our focus on mode share rather than volume, missed detections would only be a problem if they were systematically different for different device types. This aspect of performance is currently unknown, but another application for our taxonomy is future research on path user detection accuracy conditional on vehicle class.
Another limitation of the data collection is that the extent to which the sampling locations represent all cycling facilities in the region is unknown. The sampling locations were strategically selected to support the study objectives, but many factors can influence the spatial heterogeneity of cycling (terrain, facility, network, etc. [60–62]). Extrapolating from incomplete bicycle count data is a challenging and active area of research ( 60 , 63 , 64 ), and we do not attempt to generate a regional total mode split in this study. Given this knowledge gap, another potential application for our taxonomy in future research is investigating how spatial patterns may differ between people using bicycles and people using other personal mobility devices.
Future Directions
The data reported here provide a baseline to enable monitoring of travel trends in the Vancouver region, and in studying the impacts of interventions such as regulatory changes, incentive programs, and new infrastructure. But the transferability of these data to other regions is unknown as Vancouver has both a high level of active transportation for North American cities ( 65 , 66 ), and restrictive vehicle policy with regard to new forms of mobility (see Observed Vehicles and Mode Shares). We hope this study spurs further research on usage of the full array of emerging mobility devices in other regions, so that findings can be compared across geographies. To facilitate progress toward that goal, the taxonomy presented in this study provides a consistent method of collecting and reporting detailed volume data for cycleways and off-street paths based on visually identifiable features. We are now applying the taxonomy to investigate the impacts of each vehicle type on speed dynamics and interactions among travelers on off-street paths, which will be reported in future publications. We will also be returning to collect and report new data from these locations and investigate changes over a longer timescale with an evolving technology and policy landscape.
Footnotes
Acknowledgements
The authors would like to thank the following people for offering valuable direction and advice on this project: Fajar Ausri, Hamed Barkh, Elmira Berjisian, Graham Cavanagh, Mirtha Gamiz, Gurdiljot Gill, Eve Hou, Niklas Kviselius, Ruowei Li, Colleen Qiu, and Kenneth Santos.
Author Contributions
The authors confirm contribution to the paper as follows: study conception and design: A. Bigazzi, A. Hassanpour; data collection: A. Hassanpour, A. Bigazzi; analysis and interpretation of results: A. Hassanpour, A. Bigazzi; draft manuscript preparation: A. Hassanpour, A. Bigazzi. All authors reviewed the results and approved the final version of the manuscript.
Declaration of Conflicting Interests
The authors declared no potential conflicts of interest with respect to the research, authorship, and/or publication of this article.
Funding
The authors disclosed receipt of the following financial support for the research, authorship, and/or publication of this article: This research was funded by TransLink, the authority responsible for the regional transportation network of metropolitan Vancouver in British Columbia, Canada. The views expressed in this study are those of the authors and do not represent the views of the project funders. Additional support was provided by the University of British Columbia, the Canadian Foundation for Innovation, and the B.C. Knowledge Development Fund.