
Abstract
E-bike sales have been growing strongly across the globe in recent years. Despite the differences between e-bikes and conventional bicycles, bicycle traffic is typically considered a uniform mode in macroscopic transport modeling. This is problematic because such models do not allow for dedicated e-bike analysis and could therefore have adverse impacts on accuracy. In this study, we therefore investigated whether and how e-bikes are presently modeled in practice and how e-bikes should be modeled to improve data validity and usefulness. To this end, we conducted a review of 14 exemplary strategic transport models and carried out a structured exploratory literature review of existing empirical research. We queried four fields of research and investigated 29 relevant and unique sources covering influences on e-bike ownership and use as well as the characteristics of e-bike mode and route choice. Based on this work, we identified three key findings: (1) purchase choice and mode choice models must allow for scenario setting; (2) generalized costs should also include factors other than travel time, and the factors’ weighting parameters should be estimated separately between conventional bicycles and e-bikes; and (3) it is especially important for e-bike modeling to differentiate between person groups. Future research is needed to investigate route choice parameters for e-bike users, especially concerning the aversion to slopes, and methods to collect e-bike-specific data. Our findings demonstrated that, although modeling e-bikes is worthwhile, appropriate modeling approaches still need to be developed and applied to demonstrate their practicability and usefulness.
Keywords
Modeling bicycle traffic in transport models is tricky. Even though the subject is still developing with regard to model theory and data availability, initial attempts have been made to create more detailed models that distinguish between conventional bicycles (c-bikes) and electric bicycles (e-bikes). With few exceptions, we were unable to identify existing research dedicated to modeling e-bikes in macroscopic transport models. To fill this gap in the research, we conducted an assessment of current modeling practices and a structured exploratory literature review into relevant adjacent fields of research. We present our key recommendations for future efforts to model e-bikes related to scenario setting, components of generalized costs for mode and route choice, and segmentation by person group.
E-bikes vary with regard to maximum speed, motor power, control mode (throttle control or pedal assist), and more attributes, resulting in a wide range of vehicles from bicycle-style to scooter-style e-bikes ( 1 ). In this paper, we focus on electrically power-assisted cycles with no differentiation in the maximum speed, motor power, or local traffic regulations. For example, both pedelecs and speed-pedelecs (i.e., e-bikes with a top speed of 45 km/h) are included in this definition. Scooter-style e-bikes powered by a gas handle are particularly popular in Asia ( 2 ). However, we excluded scooter-style e-bikes from our research, because in the context of transport modeling these vehicles are more akin to private motorized vehicles than bicycles.
With the rising share of e-bikes in bicycle traffic, most prominently in Europe ( 3 ), the question arises of whether and how e-bikes should be included in macroscopic transport models. Compared with c-bikes, their higher speed and lower physical effort may result in cycling becoming a more attractive mode of transport for different user groups, trip purposes, trip lengths, or in topographically challenging areas. On the other hand, higher costs, a lower level of physical exercise, and the need for secure storage and charging facilities might have adverse impacts on the benefits of e-biking on an individual and societal level ( 4 ).
Strategic transport models are simplified representations of real transport systems and are commonly used for analysis, forecasting, and policy evaluation ( 5 ). When changes in the transportation system affect the choices its users (can) make, it is necessary to include these new options in the model to ensure that the outcomes continue to be accurate. The rise of e-bikes might also necessitate new analytical approaches and more detailed modeling of e-bikes to evaluate the impact of e-bike subsidies or dedicated bicycle infrastructure, for example.
Aiming to identify whether e-bikes are considered in any major macroscopic transport model, we inspected 14 exemplary European and North American models. We identified models by looking at countries that are particularly strong in bicycle research (e.g., Denmark, the Netherlands, Norway, Sweden) as well as the four most populous countries in Europe and North America (United States, Germany, France, and the UK). Since e-bikes as defined in the previous section are less common outside of these regions, we expected to find dedicated e-bike models here if they existed at all. Where model documentation was not available to the public, we contacted the model creators to provide us with the missing information. All of the models we reviewed adhere to the four-step-modeling framework. The list of all examined models presented in Table 1 does not provide a representative overview of the degree of detail to which cycling is considered in transport models globally, but demarcates the current boundaries of bicycle modeling.
Exemplary Transport Models and their Considerations in Relation to E-Bikes
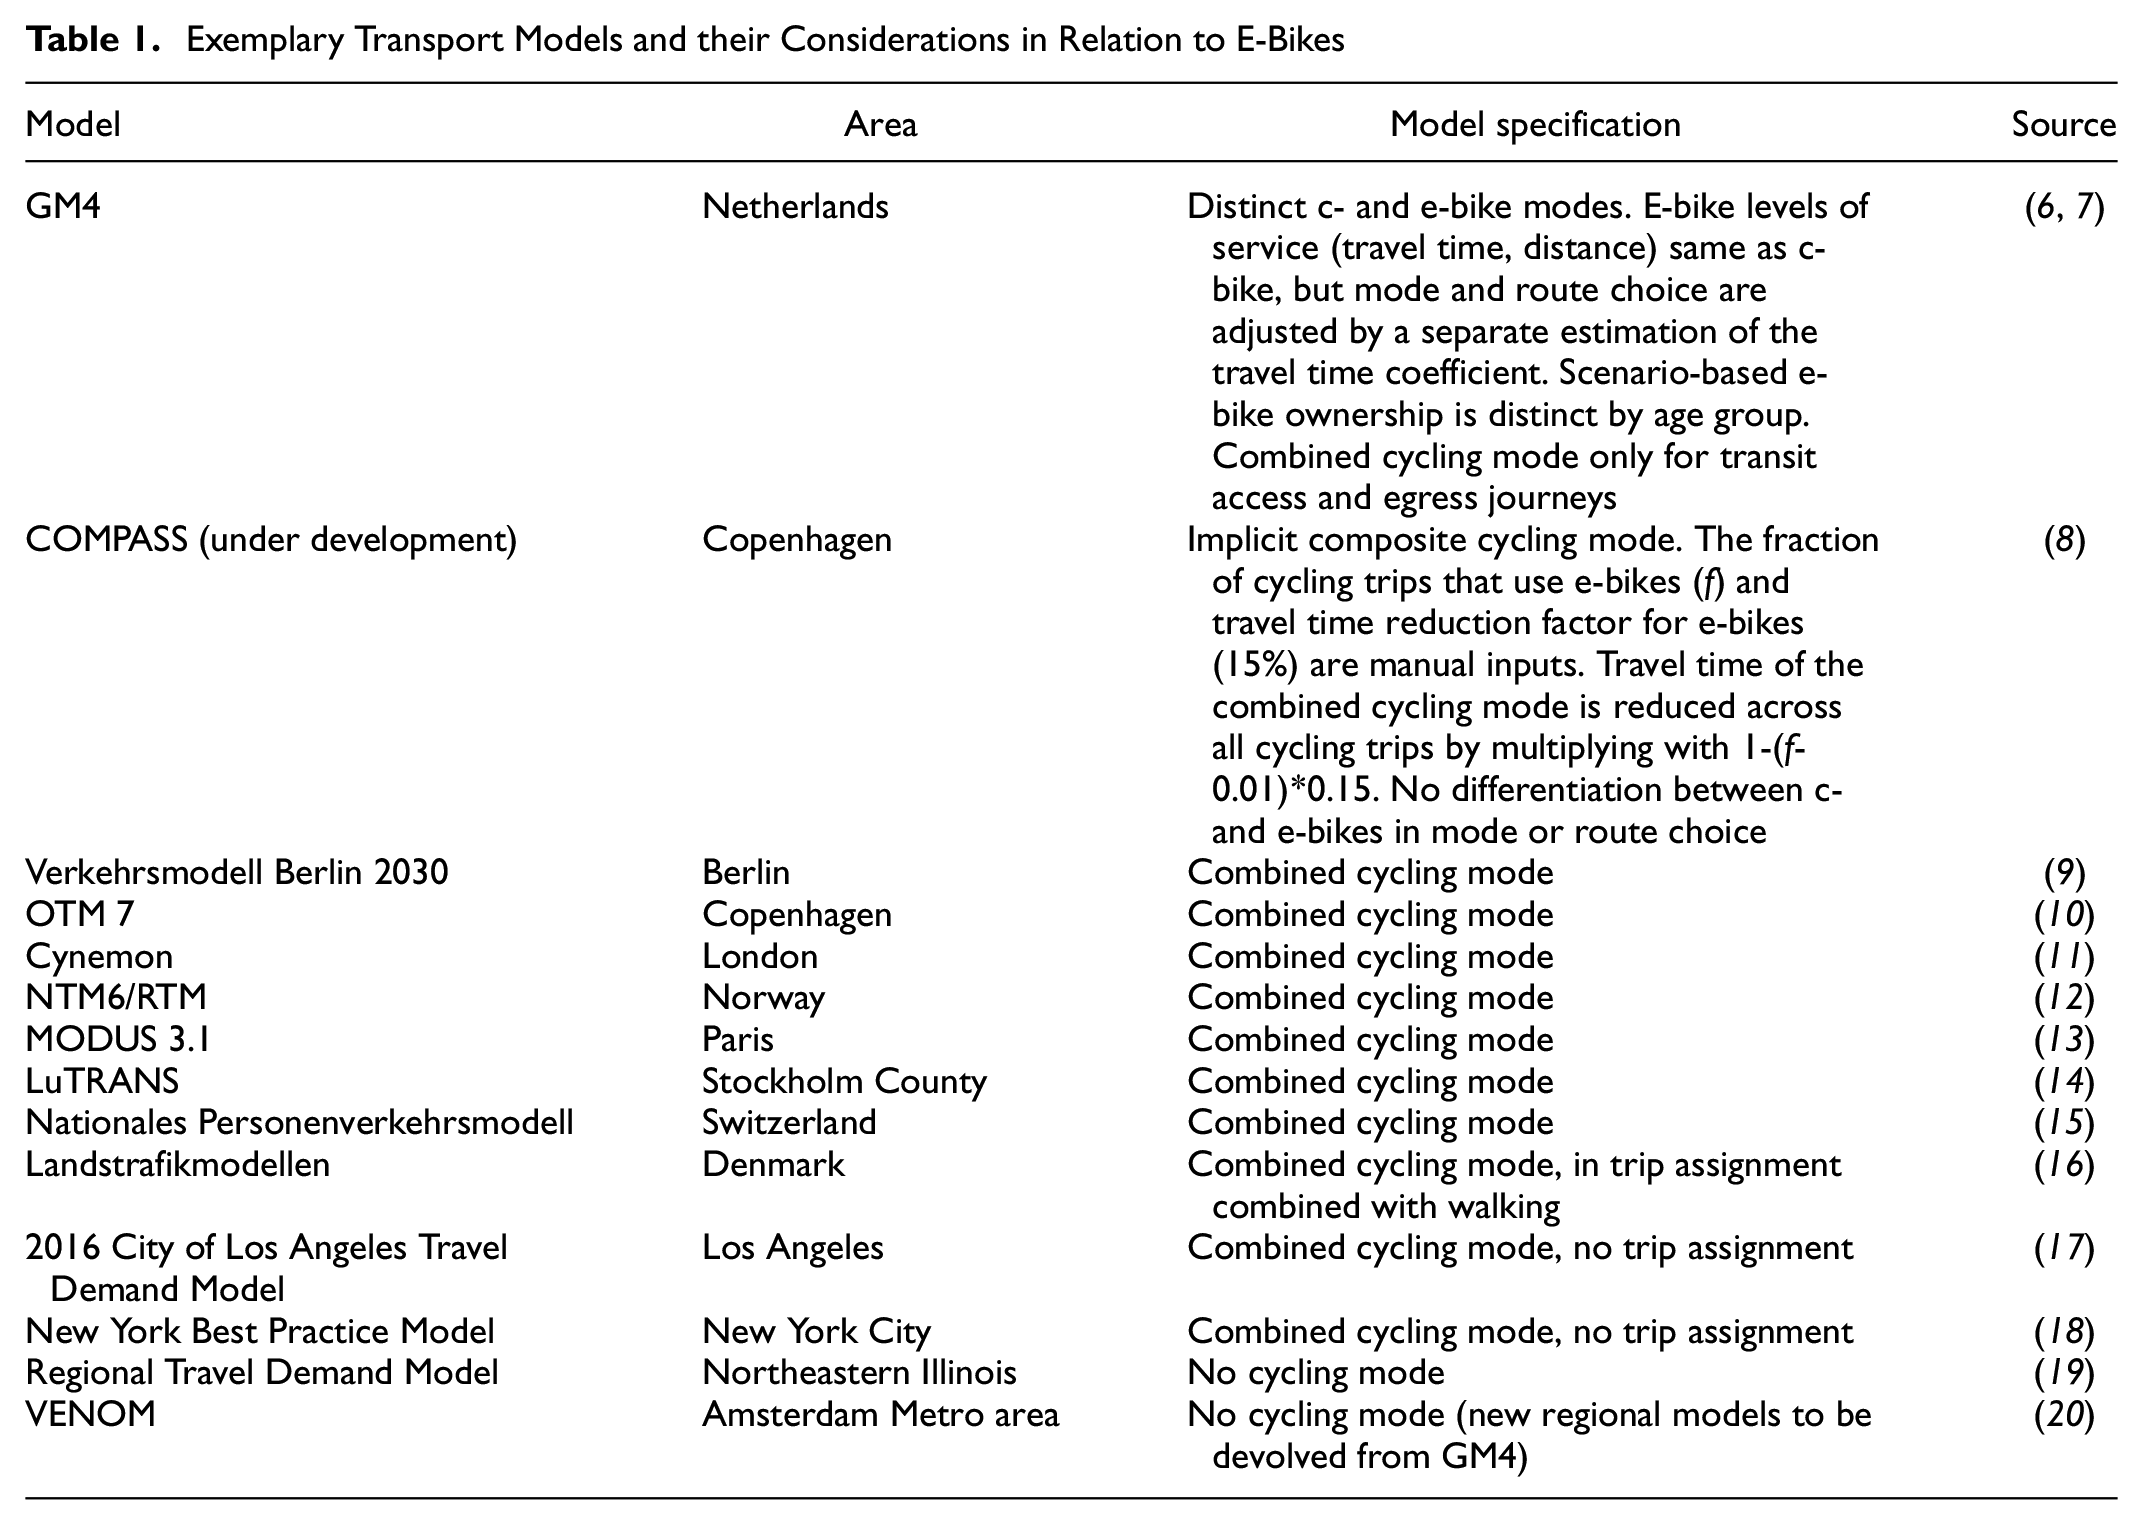
Most European models we investigated include cycling as a combined mode, which is a single cycling mode consisting of both c- and e-bikes, and do so in both mode and route choice. In these cases, e-bikes influence model parameters to the degree that e-bikes are present in the base-year data used for calibration. The COMPASS model currently being developed by MOE for the Greater Copenhagen area will use an approach similar to the work of Hallberg et al. ( 4 ). This model does not differentiate between separate modes for c- and e-bike, but the cycling travel time is adjusted according to a manually forecasted share of e-bikes. The Dutch national model, GM4 (developed by Significance), stands out as the only model known to us that models e-bikes as a mode and route choice option distinct from c-bikes. We are not aware of any strategic transport model used in practice in which ownership of or access to c- or e-bikes is modeled dynamically as an independent choice (as opposed to the model-user setting static scenarios) that feeds into the later model stages.
By providing an overview of exemplary transport models from Europe and North America, we demonstrated that differences between c- and e-bikes are rarely considered in practice. Nevertheless, modeling practitioners in Denmark and the Netherlands are making the first advancements to differentiate e-bikes in transport models. In the consequent main part of this paper, we present the results of a literature review to inform such efforts to include e-bikes in future transport models.
In the two sections to follow, we describe the methods and results of a structured exploratory literature review that focused on gathering knowledge from four fields of research. In the discussion, we synthesize what our findings revealed about the requirements for the dedicated modeling of e-bikes. We then point out the limitations of this review, possible modeling approaches, and future research needs.
Structured Exploratory Literature Review
A preliminary literature review yielded very few works dedicated to e-bikes in transport modeling. Hence, we investigated related fields of research focusing on factors affecting e-bike ownership and use, and how e-bikes might differ from c-bikes in mode and route choice. The first two research fields deal with factors that could influence and change the propagation and usage characteristics of e-bikes in the future. Finding a distinct body of research on the influence of price on e-bike acquisition, the impact of price is distinguished as a unique research field and other factors influencing use are grouped together in the first research field.The latter two research fields investigate differences between c- and e-bikes in mode and in route choice. A dedicated search string for each research field was informed by the results from the preliminary literature review. All search strings shared a term restricting results to sources mentioning e-bikes. The remainder of each string further restricted the results to the focus topic of each research field. The research fields were:
Research Field 1: Impacts of infrastructure, topography, and demographics on e-bike use;
Research Field 2: Impacts of price on e-bike availability;
Research Field 3: Impacts of e-bikes on mode choice; and
Research Field 4: Impacts of e-bikes on route choice.
Using the four search strings, we queried three databases for peer-reviewed publications from January 2015 to June 2022 to focus on recent research, yet also provide sufficient source material. These searches yielded 54 relevant sources. After eliminating duplicates and adding two additional sources from the preliminary literature review, we identified 29 unique relevant sources. Most studies examined the Dutch or Northern European context. The number of sources per publication year was relatively evenly distributed between three (2016, 2018) and five (2017, 2021, 2022), however, no relevant sources were published in 2019.
Table 2 provides an overview of what sources were identified and for what research field they are relevant. The results per search string indicate the number of sources that were found to be useful for any part of this review, which were identified using that search string and database. An “F” in the row of a source indicates that a source was found using that search string in at least one of the three queried databases. An “R” indicates for what research field a source was relevant. “F/R” consequentially indicates that a source was both found using a search string and relevant to the respective research field. Two sources from a preliminary literature review that were not identified in the structured exploratory literature review were added manually and are indicated by an “A.”
Setup and Results of the Structured Exploratory Literature Review
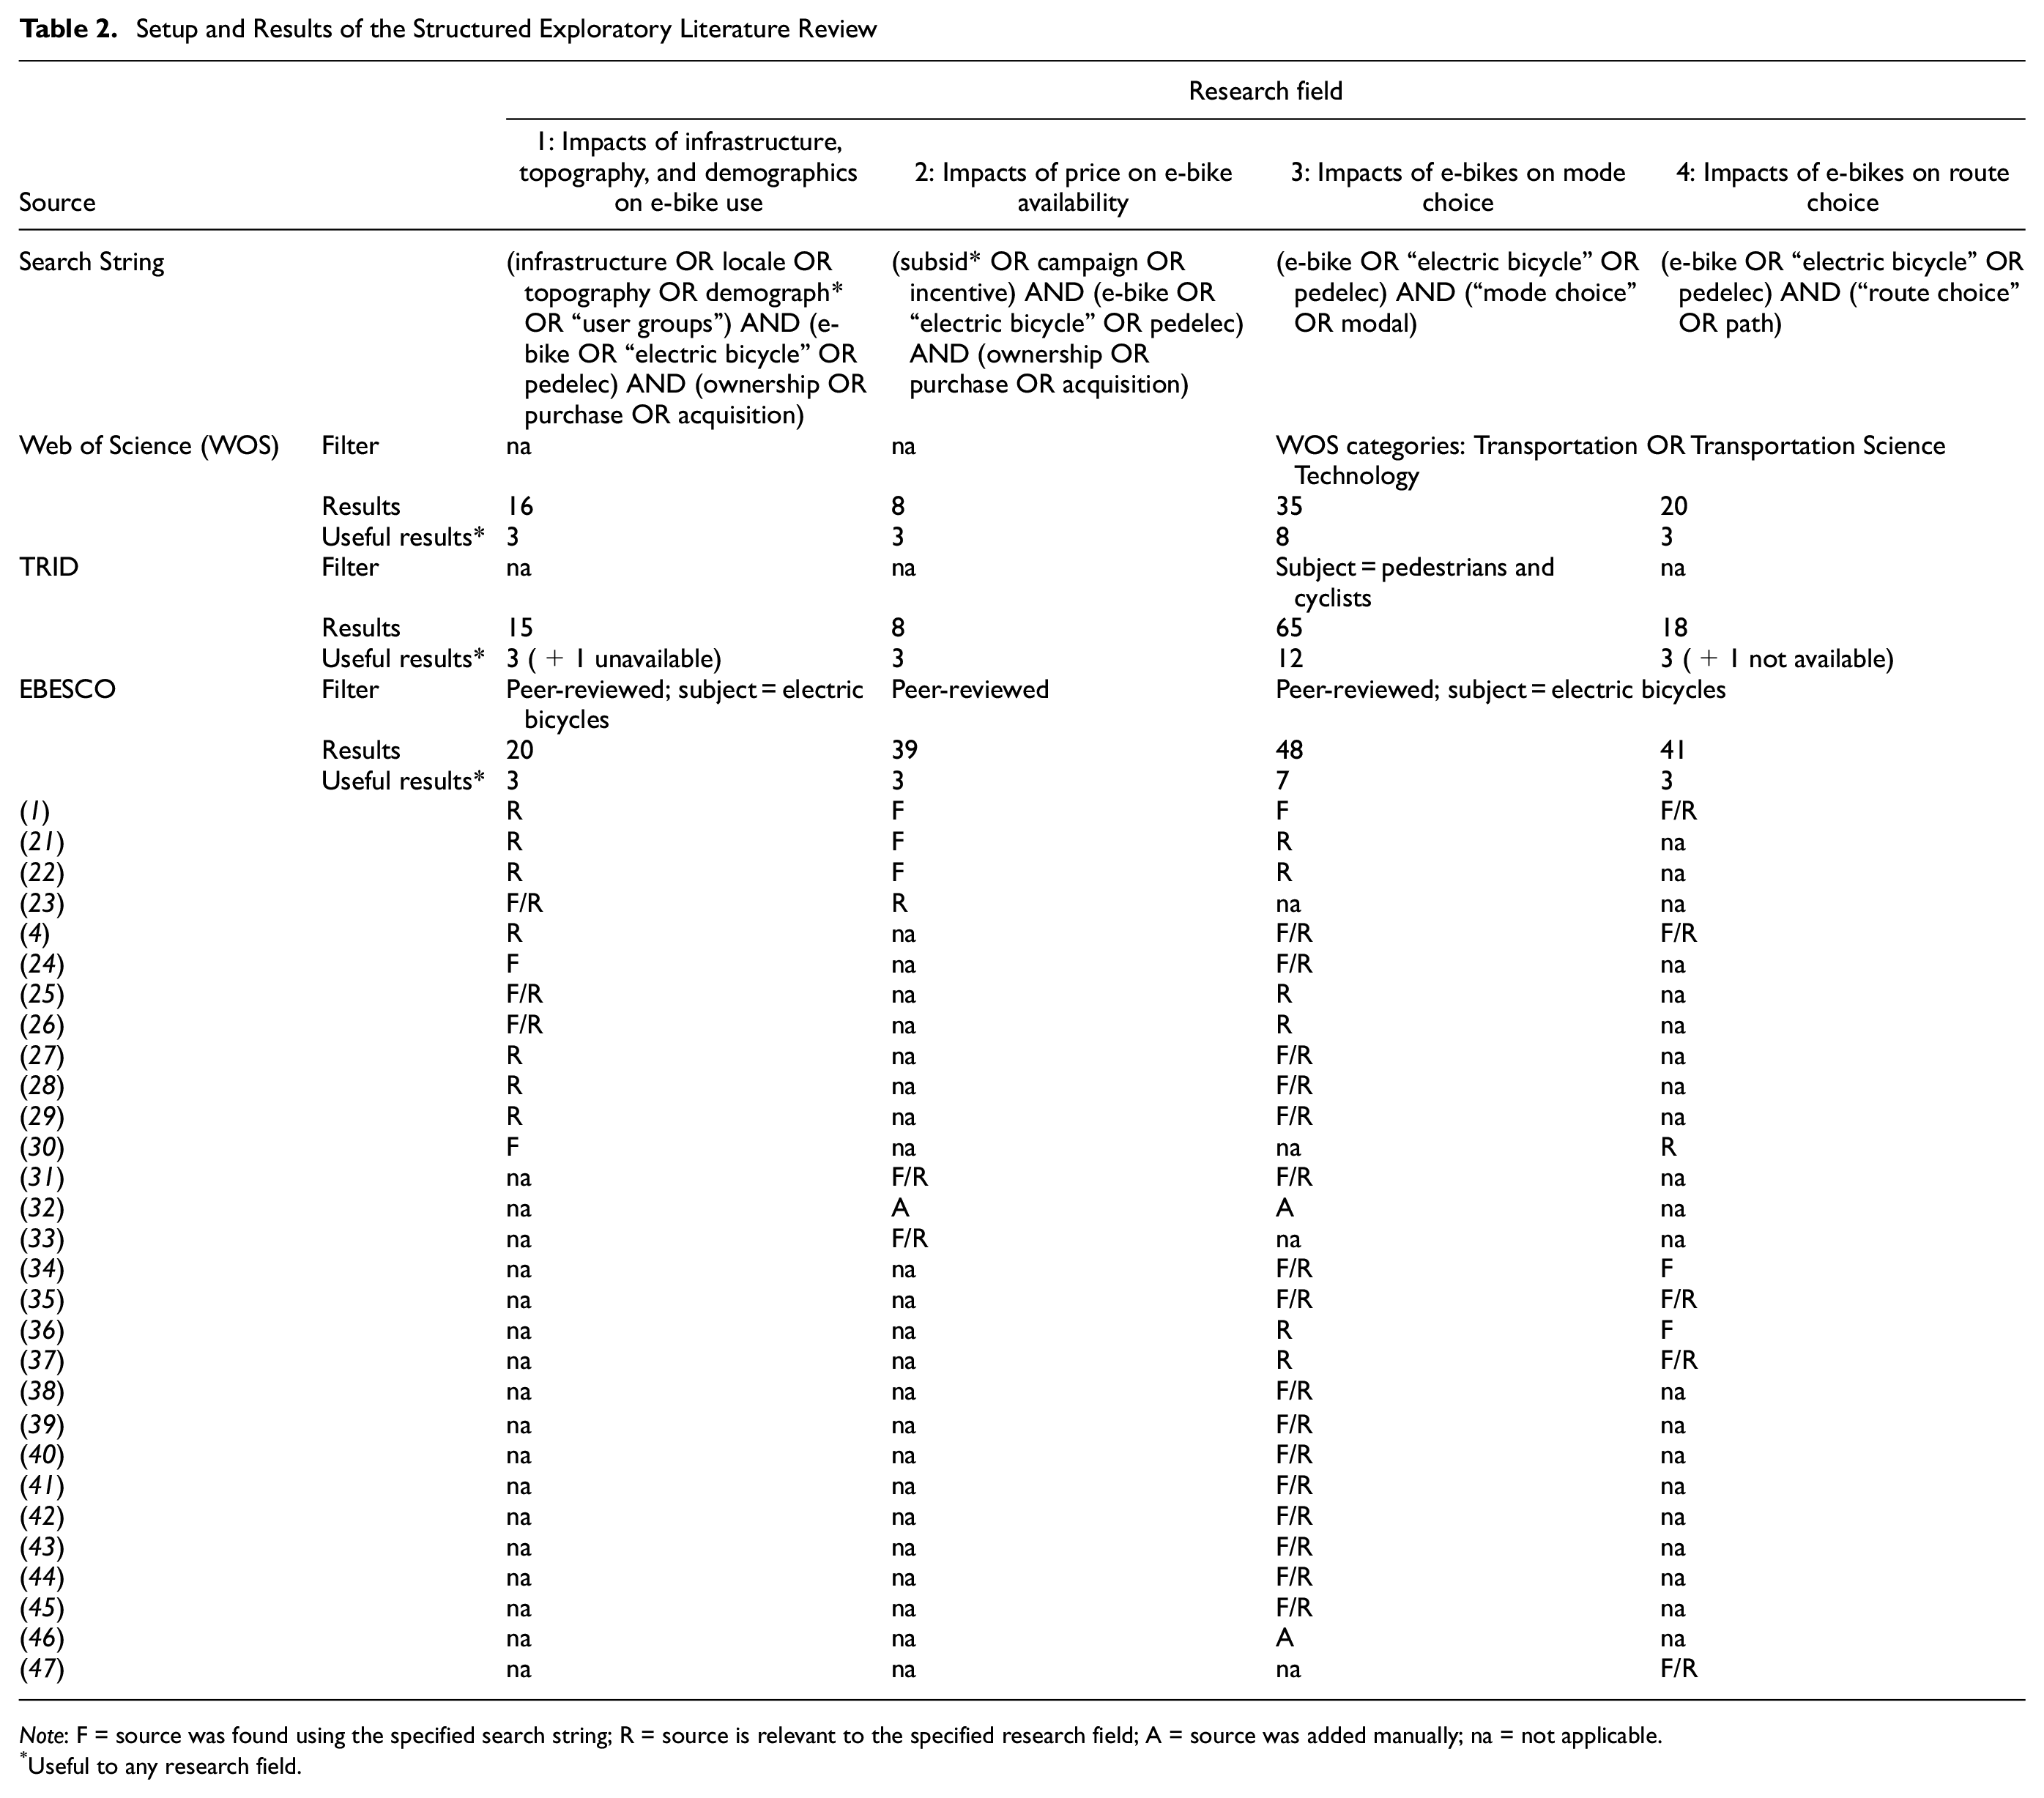
Note
Useful to any research field.
In our review, we did not explicitly consider trip generation and distribution because the expected impact of e-bikes on these modeling steps was low and analogous to non-mode-specific changes in accessibility and generalized costs. We also did not consider the modeling of onward impacts like changes in health or greenhouse gas or noise emissions, because this fell outside the scope of four-step-models in the narrow sense, despite being a common application of transport modeling software.
Results
Research Field 1: Impacts of Infrastructure, Topography, and Demographics on E-Bike Use
There is widespread agreement in the literature that the key motivations for e-bike ownership are the ability to cover longer distances and overcome hilly terrain while avoiding physical exertion and sweat ( 22 , 23 , 25 ). The ability to continue cycling despite a decline in physical ability is another major motivation ( 23 ). Kazemzadeh and Ronchi provide a more detailed review of differences between c- and e-bikes, focusing on comfort, vehicle properties, travel behavior, and mode substitution ( 29 ).
When riding e-bikes compared with c-bikes, people can maintain higher speeds with less effort and perceive a higher subjective safety ( 1 ). This perspective is supported by survey studies in Europe and North America, revealing that e-bike riders find it easier to keep up with the speed of motorized traffic ( 23 ) and that 78.3% versus 63.7% of respondents feel safe on e-bikes compared with c-bikes ( 25 ). The latter difference is even larger for seldom or noncyclists, with only 48.7% feeling safe riding a c-bike but 75.3% feeling safe on an e-bike. E-bikes close the gap in subjective safety between cyclists and seldom or noncyclists ( 25 ).
Findings from the literature concerning demographic attributes vary. In North America, MacArthur et al. found that e-bike users are disproportionately white, male, elderly, and educated, with 28.7% unable to use a c-bike because of physical limitations ( 25 ). A literature review conducted by Fishman and Cherry supported these findings in both the North American and European contexts ( 1 ). In van Cauweberg et al.’s survey of people older than 65 years in Flanders who were physically able to ride both c- and e-bikes, the main factors identified as positively influencing e-bike usage were being female, having a high BMI, and a high number of motorized vehicles in the household ( 26 ). In a study of Danish e-bike owners, e-bikes were found to be most common among the elderly, women, and better educated people. Analyzing data from the national Dutch mobility survey, Kroesen revealed similar results for gender and age ( 28 ). High income was also found to correlate with e-bike ownership. After taking into account the correlation between income and education, higher education was associated with a lower rate of e-bike ownership. In a survey in Ghent (Belgium), Astegiano et al. found that e-bikes are used by both genders to a roughly equal degree ( 21 ).
De Haas et al. ( 27 ) and Haustein and Møller ( 22 ) conducted a latent class analysis and cluster analysis, respectively, to segment e-bike users according to their mobility behavior, and sociodemographic and attitudinal survey data. They identified five and three user groups, respectively. Both segmentations demonstrate that the proliferation of e-bikes occurs at different speeds and stages in the different user groups. In the context of transport modeling, Hallberg et al. asserted that differentiating between age groups is recommended because e-bikes provide greater time savings for elderly people and hence different impacts on utility and consumer surplus (i.e., the benefits of direct consumers resulting from an intervention) ( 4 ).
Altogether, e-bikes have the greatest utility for people who cannot or do not want to use a c-bike, like the elderly or commuters avoiding physical exertion. The different motivations for e-bike use among user groups, such as recreation, utilitarian considerations, or the thrill of faster speed, lead to differences in e-bike adoption rates and the types of trips made by e-bike. Research findings on the influence of gender on e-bike adoption are mixed. In North America, where cycling in general is riskier and more male-dominated ( 48 ), men also use e-bikes more frequently than women. In the European context, e-bikes appear to have a higher adoption rate among (especially elderly) women ( 22 , 26–28).
Lessons for Modeling
The large variation in e-bike ownership and usage patterns makes it crucial to model e-bikes differentiated by person group. This is necessary to capture the differences in utility and facilitates a reliable estimate of the impact of a rise in e-bike market share. On routes that lack dedicated bicycle infrastructure, e-bikes afford their users higher levels of subjective safety ( 1 , 23 , 25 ). This additional utility should be taken into account in transport models, for example by reducing generalized cost penalties on mixed-traffic sections for e-bikes. As e-bikes are rarely purchased to replace a private car ( 22 ), modeling car and e-bike ownership can be viewed as independent of each other.
We were not able to identify quantitative research exploring the impacts of local topography on e-bike ownership. As the necessary data have started to emerge in recent years, such as Onderweg in Nederland and the Mobilität in Deutschland surveys, we expect to see future work exploring possible relationships.
Research Field 2: Impacts of Price on E-Bike Availability
As our findings from Research Field 1 showed, high household income correlated universally positively with e-bike ownership. The high price of e-bikes is commonly cited as a barrier to purchasing one ( 23 ).
Anderson and Hong combine administrative-, insurance-, and survey data about e-bike transactions in Sweden before, during, and after a subsidy program ( 32 ). Up to a rebate of 10,000 Kronas (1kr = 0.097 US$ in April 2023), 25% of the purchasing price was subsidized by the government. They showed that retailers passed on the rebate to the consumers almost completely. In their data set, average monthly e-bike purchases changed from 2,084 before to 3,613 during to 2,135 after the subsidy period. Bigazzi and Berjisian developed an economic model for e-bike rebates and applied it to Vancouver and Victoria in Canada ( 33 ). Because there are large variations in the price of different types of e-bikes, they differentiated between three different price classes. They assumed price elasticities of −1.0 to −3.0, with a central value of −2.0. This appears adequate when compared with the empirical price elasticity of roughly −3 found by Anderson and Hong ( 32 ).
De Kruijf et al. reported on an incentive program in the Netherlands aimed at car commuters. Instead of subsidizing the purchase of an e-bike, participants received 8 to 15 euro cents per kilometer traveled on their e-bike ( 31 ). This measure was highly effective, as e-bike mode share among commuting trips rose from 0% to 68% ( 31 ). Although these results are likely to have been influenced by a self-selection bias of program participants, another possible reason is that being given any incentive at all, even if small, encourages participants to buy and use an e-bike. In other words, such incentives might serve as external initiators for reflecting on and changing one’s mobility behavior, even if the monetary benefits are small. In addition, the way participants’ e-bike use was monitored using an app might be argued to constitute gamification, further encouraging participants to ride their e-bikes.
Lessons for Modeling
Concerning transport modeling, these findings reinforce the notion that the price of e-bikes is an important factor in determining personal e-bike availability. However, as we found in Research Fields 1 and 3, attitudinal factors, which can change over time, also play a large role. This makes it difficult to predict long-term changes in e-bike ownership purely using price elasticities. Accurately forecasting the development of e-bike prices and the economic environment at-large poses its own challenges. As we address in the discussion below, our review suggests that modeling e-bike availability will involve at least partial scenario setting.
Research Field 3: Impacts of E-Bikes on Mode Choice
Within the four-step-model framework, mode choice can be assumed to be the most relevant model step for evaluating the transportation impacts of e-bikes. E-bikes must substitute resource-intensive modes instead of only replacing c-bike travel to fulfill their promise of contributing to a more sustainable transport sector. To inform their integration into mode choice models, we aimed to gather evidence on e-bike mode shift. We identified 21 studies relevant to this field of research and present the key findings of our review in Table 3. Most of these studies were conducted in the Netherlands (7), followed by the United States or Canada (3), Sweden (3), Norway, Belgium, Denmark (2 each), the UK, and Switzerland (1 each).
Overview of Sources about E-Bike Mode Shift
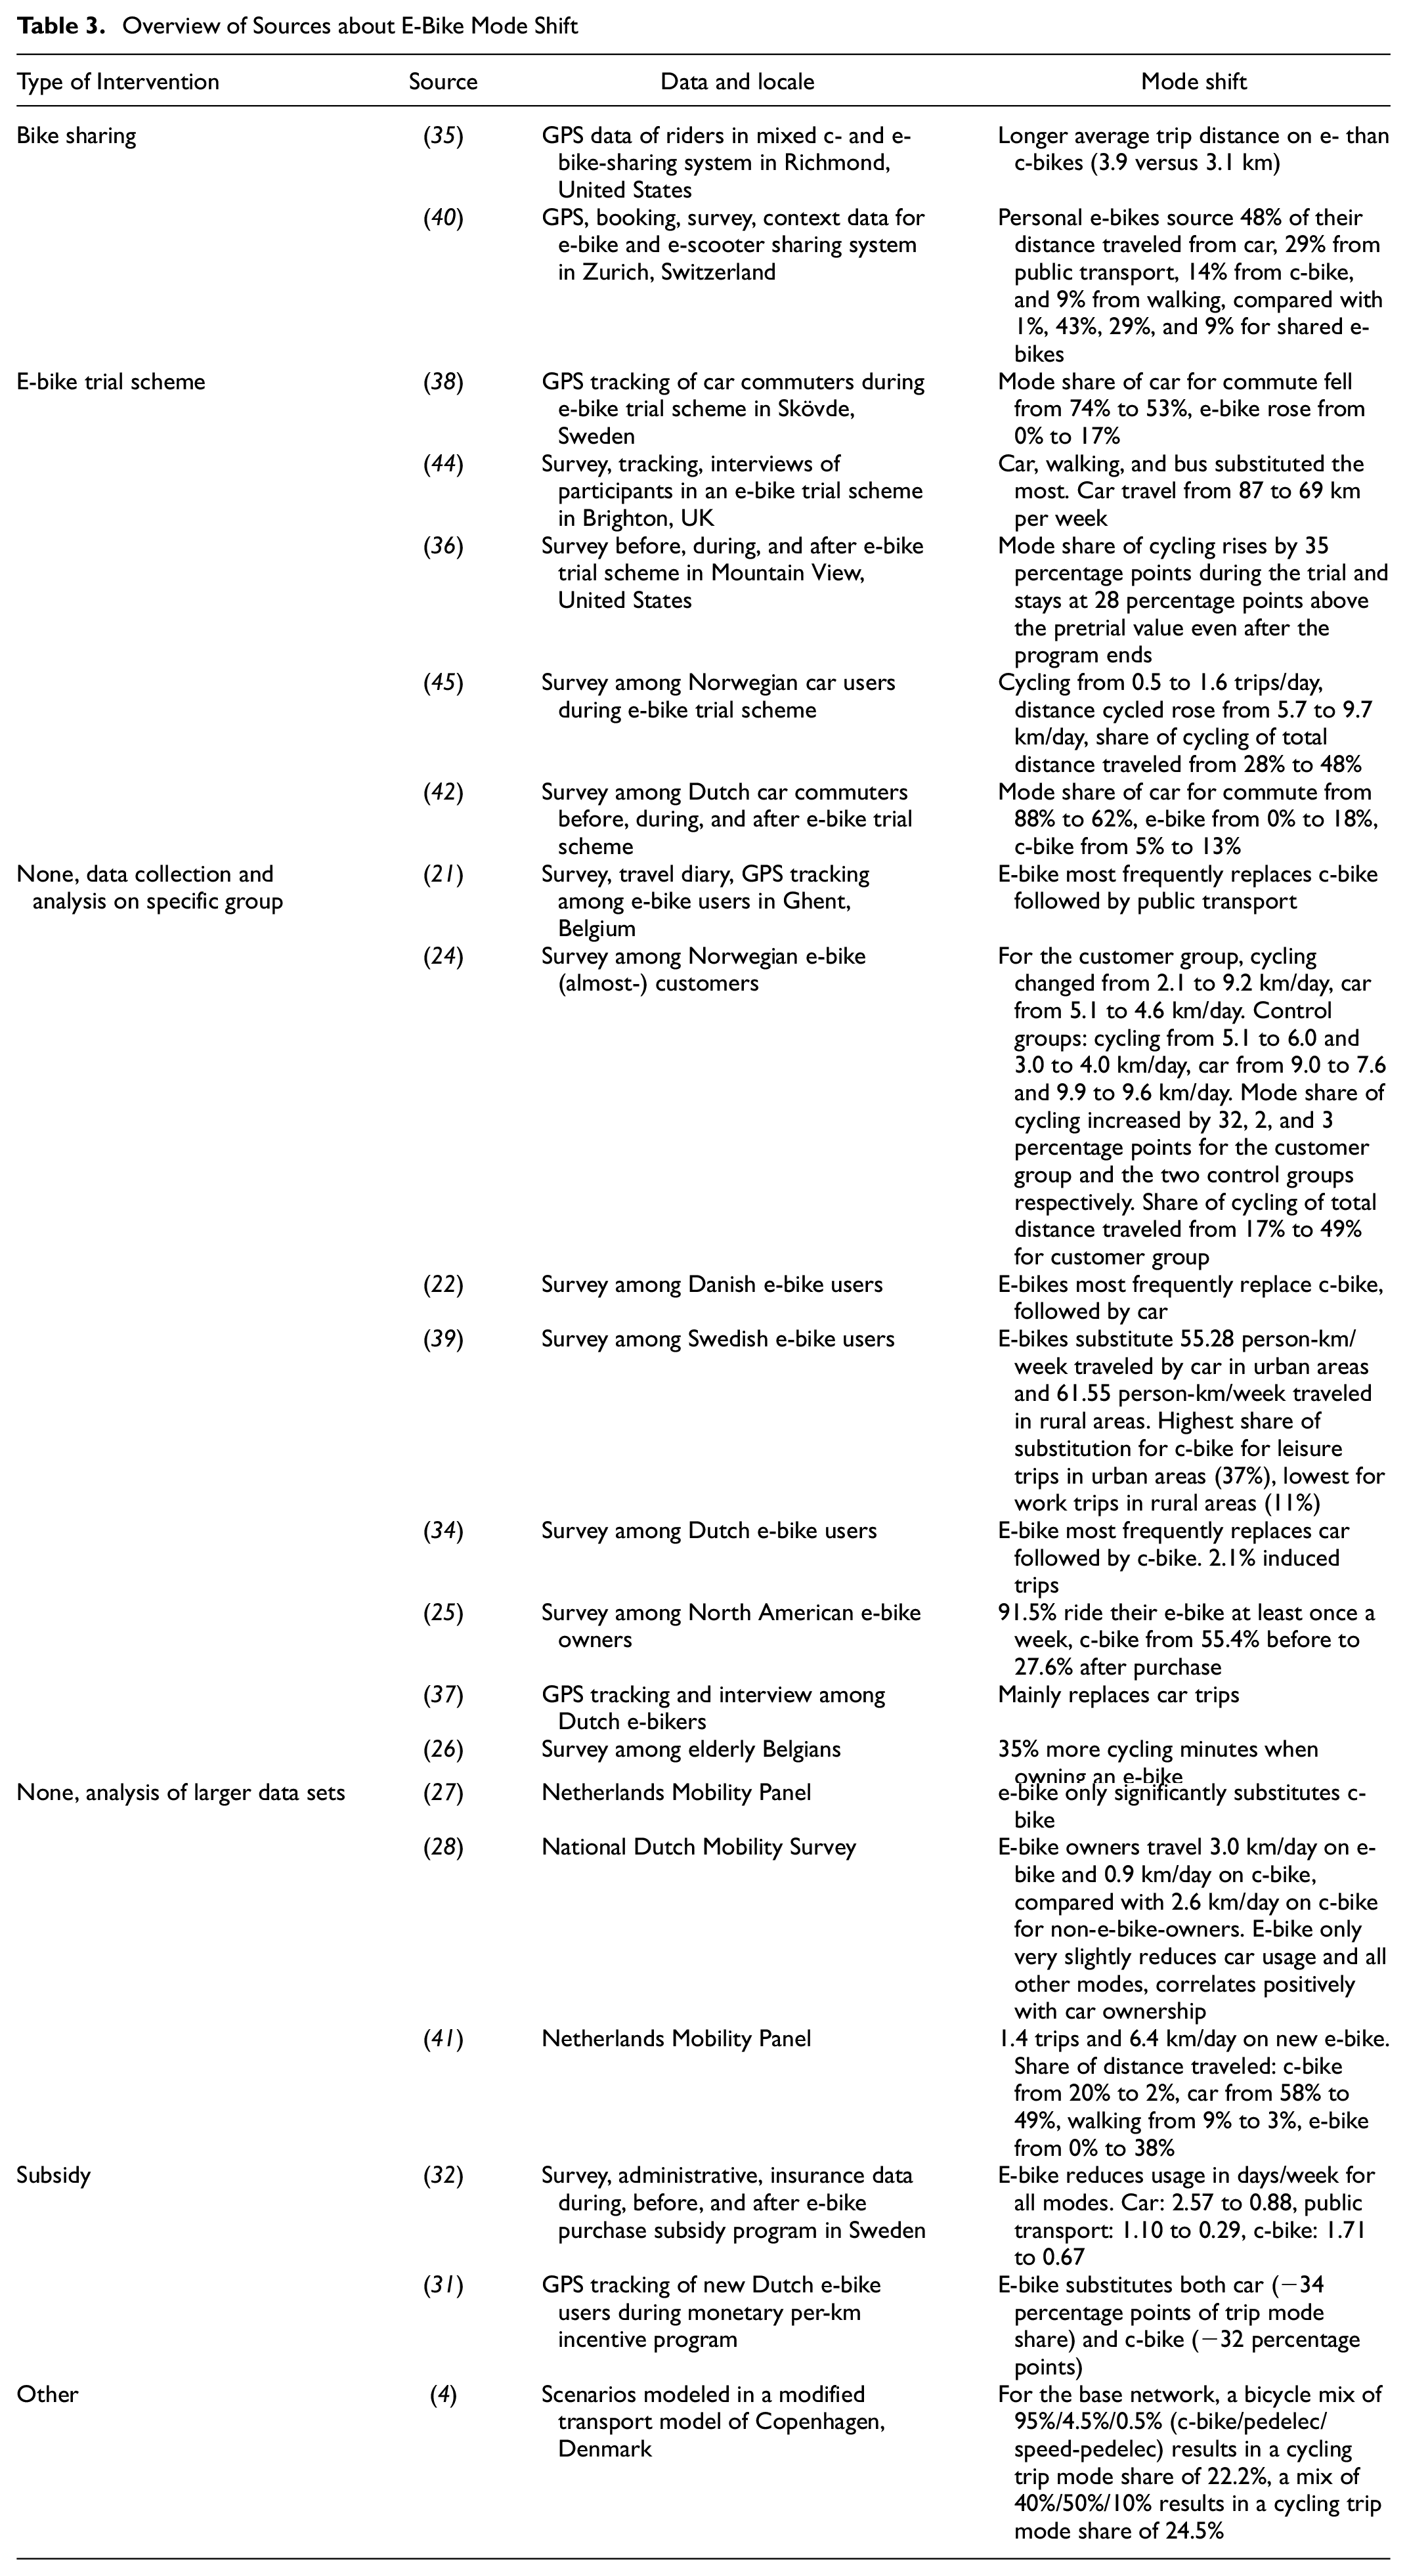
In the three North American sources ( 25 , 35 , 36 ), e-bikes appear to afford a shifting perspective on cycling away from being a leisure activity toward being a utilitarian mode of transport. Adopters tend to be former leisure cyclists who then go on to substitute utilitarian car trips with an e-bike ( 25 ). This is different to the results of Fyhri and Sundfør, who found that Dutch e-bike purchasers previously cycled less than the national average ( 24 ). Unlike the European body of research we reviewed, we did not identify any large-scale representative mobility surveys that included e-bikes in North America, which suggests a limitation of e-bike data in this geographic region.
One common methodological shortcoming of studies investigating the impact of e-bikes on mode share is self-selection sample bias, in which participants of an e-bike trial or subsidy program might have been planning to buy an e-bike or change their cycling habits anyway. Kroesen overcame this limitation by developing a conceptual model to assess the effect of e-bike ownership on travel behavior ( 28 ). They estimated the model on data from the national Dutch mobility survey. However, these cross-sectional data do not allow for the same deductions to be made on the causal relationship between e-bike ownership and travel behavior that longitudinal data would. This, as well as the original problem of sample bias, is addressed by Fyhri and Sundfør, who collected before-and-after data of e-bike purchases and also included a control group of subjects who had strongly contemplated purchasing an e-bike, but ultimately did not ( 24 ). By observing e-bike use over a longer time span, they avoided any novelty effects among the participants’ e-bike use. By using longitudinal panel data, de Haas et al. ( 27 ) and Sun et al. ( 41 ) generated even more naturalistic insights into how mobility behavior changes after e-bikes are introduced to a household. All four of these studies were conducted in the Netherlands, where national survey and panel data include e-bike ownership and use, and yielded what are perhaps surprising results: e-bike ownership reduces c-bike travel the most, followed by car travel ( 28 , 41 ). In one case, e-bikes were found to statistically significantly substitute only c-bike travel ( 27 ). Although one study also found considerable reductions in car travel for new e-bike owners, the effect was similarly strong for the control group of participants that decided not to purchase an e-bike ( 24 ). Taken together, this is strong evidence that, at least in the Netherlands where cycling is already a well-established mode of transport that competes with the private car, e-bikes mostly replace c-bike travel but may only marginally substitute car travel.
Hallberg et al. modified and applied a transport model of the Copenhagen capital area to investigate the impact of a rising share of e-bikes ( 4 ). They found that reducing the share of c-bikes from 95% to 40% in a base network scenario increases the total trip mode share of cycling from 22.2% to 24.5%. Unfortunately, they do not report on mode-specific substitution rates. Working with an agent-based transport model, Reck et al. investigated the mode choice of users of a mixed e-bike and e-scooter sharing system in Zurich ( 40 ). Their work revealed that the substitution effect of e-bikes depends on whether the person is using a shared or privately owned e-bike.
Several sources investigated the relationship between trip purpose and mode substitution ( 21 , 27 , 34 , 37 , 39 , 41 , 45 ). The consensus is that, whereas e-bikes are used for a variety of trip purposes, mode substitution varies depending on trip purpose. Car substitution is the strongest for commute trips ( 27 , 34 , 37 , 39 , 41 ). Because of the differences in trip purpose and e-bike purchase motivations among different person groups (see Research Field 1), substitution effects can also be expected to vary by person group. Factors such as age and gender were found to have opposite signs of effect for e-bike ownership and use ( 28 ). Those who buy e-bikes despite belonging to a user group with otherwise low adoption rates tend to use the e-bike more intensively ( 28 ). However, it is unclear whether this observation is restricted to the phase of early adoption.
Concerning mode shift, this review revealed that the impact of e-bikes varies depending on the previous mode share. Usually, the more established a mode of transport the c-bike is, the more it is substituted by the e-bike ( 24 , 27 , 28 , 41 ). When introduced to very carcentric people groups, e-bikes might increase c-bike use owing to complementary effects ( 38 ). The higher the previous car mode share, the larger the amount of e-bike travel sourced from that mode ( 34 , 36–38, 44 ). Most e-bike intervention studies report rather large impacts. It is important to note that low-impact interventions may be underreported.
Our findings corresponded with three other literature reviews we identified. E-bikes substantially substituted all other modes, with the exact amount varying by context ( 43 ). More specifically, Bourne et al. found that e-bikes source 23% to 72% of their trips from c-bikes, 20% to 86% from cars, and 3% to 45% from public transport, depending on the region investigated ( 46 ). All three reviews ( 29 , 43 , 46 ) echo our finding that the dominant mode is substituted the most.
Lessons for Modeling
The lessons from the research field reinforce the notion that it is necessary to model e-bike use differentiated by person group. Different user groups use e-bikes for varying purposes. For example, the elderly use e-bikes as a replacement for c-bikes that they can no longer ride, whereas younger e-bike adopters exhibit a larger substitution of car travel ( 22 , 26 ). Therefore, substitution effects might change as different user groups acquire e-bikes in the future ( 27 ). E-bike trips are around 50% longer than c-bike trips ( 44 ) and ownership has a generative effect on the total distance traveled ( 28 ). Our findings demonstrated, perhaps unsurprisingly, that data intended for e-bike model calibration need to be differentiated by bicycle type and not only by person group, traditional mode choice, or trip purpose.
Several of the aforementioned studies ( 21 , 24 , 25 , 31 , 32 , 36 , 38 , 42 , 44 , 45 ) actively promoted e-bike purchase or use and reported larger mode shift impacts than might be expected from uninfluenced growth of e-bike ownership: an illustration of self-selection bias among the participants. However, it is important to note that in the context of transport modeling we also would not expect people to acquire e-bikes randomly. Instead, as e-bike availability rises, we would anticipate individuals with a higher utility for an e-bike to acquire them earlier than those with a lower e-bike utility. Despite this point, we still expect the studies above to overestimate the mode shift impact of e-bike acquisition compared with the impact a transport model would need to replicate. However, the discrepancy between these study designs and reality is smaller than the difference between these study designs and a hypothetical study design in which e-bikes are given to a truly random group of people.
Integrating e-bikes into existing mode choice models as an additional choice option is trivial in an abstract sense. Finding parameter values to replicate observed mode choice behavior is more challenging. The decision to use an e- (or c-)bike is not purely rational, as attitudinal factors also play a large role ( 42 ). Modeling these factors and future societal changes is difficult, and we address this issue in the discussion section below. Several sources ( 31 , 36 , 37 ) additionally point toward the common concept in transport research that fundamental changes in travel behavior, such as choosing an e-bike instead of a c-bike or even instead of nonbicycle modes, are more likely to occur after a considerable external stimulus. This could be a change in home or work location ( 37 ) or the act of participating in a study ( 31 , 36 ). Since transport models are frequently used to forecast both short- and long-term changes in travel behavior ( 5 ), we have to take this time lag in users’ reactions to incremental changes in the wider transport system into account. This means that instead of considering the total utility of an option in a choice model, we should consider relative changes in their utility as the true psychological reason for any behavior change.
Research Field 4: Impacts of E-Bikes on Route Choice
Speed and hence the resulting travel time is a crucial input for route choice models. In Knoxville, TN, e-bikes were found to travel at an average speed (including acceleration and deceleration, but not stopping time) of 13.3 km/h on mixed-traffic roadways whereas c-bikes only reached 10.5 km/h ( 47 ). On dedicated greenways, c-bikes were found to be slightly faster than e-bikes, at 12.6 and 11.0 km/h respectively. The authors attributed this surprising finding to differences in trip purpose (i.e., exercise-focused leisure riders not using e-bikes) and they detected no major differences with regard to average wrong-way riding rates or the violation of stop signs or traffic signals.
Schleinitz et al. conducted a naturalistic driving study in Germany to investigate the speed and acceleration of different types of bicycles by age group, infrastructure, and gradient ( 30 ). They found that the average free flow speeds ranged from 16.1 (c-bike) to 19.0 (pedelec) to 24.9 km/h (speed-pedelec), with higher speeds being associated with younger age groups, dedicated infrastructure, and downhill slopes. Acceleration is much higher for speed-pedelecs, whereas c-bike and pedelecs have similar values (partially because of e-bike riders being older on average).
Hallberg et al. provide the only source in our literature corpus that explicitly dealt with bicycle route choice in the context of e-bikes and transport models ( 4 ). They used 27 different speed values (3 bicycle types × 3 cyclist speed segments × 3 infrastructure types, ranging from 13.6 to 31.5 km/h). At intersections however, only a general delay of 30 s was added for traffic lights and 5 s for roundabouts. Travel time was the only variable considered for mode and route choice. The authors set up trip assignment in a way that the model differentiated according to cyclists’ speed segment and bicycle type, assigning trips to the fastest route in an all-or-nothing-approach.
Cyclists feel safer on e- than on c-bikes ( 1 , 23 ). This could lead to the assumption that e-bike users would exhibit a lower preference for dedicated bicycle infrastructure compared with c-bike users. This is indeed supported in the research by Chavis and Martinez ( 35 ). By analyzing GPS data from a mixed c- and e-bike-sharing system in Richmond, VA, they found that e-bikes are more likely to travel on major and minor roads, which typically do not have dedicated bicycle infrastructure, and are less likely to travel on cycleways. Chavis and Martinez excluded round-trips to ensure that leisure trips were not included in their analysis ( 35 ). This reduces the risk of distortions resulting from differences in user demographics or trip purpose between c- and e-bikes. It is important to acknowledge that in some regulatory contexts, certain types of e-bikes (such as speed-pedelecs) are not allowed to use dedicated cycling infrastructure.
In a qualitative study on e-bike commuters’ route choice in Groningen in the Netherlands, e-bike commuters cited speed and directness as being less important than having beautiful surroundings, nature, or tranquility along their route. In cases of bad weather, however, cyclists choose routes that are more utilitarian (
37
). The authors of that study argue that this supports the idea of a positive utility of travel
Lessons for Modeling
The results of our review contain several key lessons for modeling e-bike route choice in transport models. Assuming different speeds for bicycle types as well as person groups and infrastructure appears to help capture the heterogeneity of bicycle traffic. Although empirical values of cycle speed are widely available, more research is needed to determine what time penalty should be added for different intersection treatments. This should be informed by research into microscopic traffic flow. Factors other than travel time, cost, or physical exertion, such as beauty or tranquility, should also be included in route choice models for all types of bicycles. In line with findings from Research Field 1, e-bikes should be modeled with a lower difference in utility between mixed and dedicated infrastructure than c-bikes. Also in line with Research Field 1, we again were not able to identify research investigating the impact of topography on e-bike route choice.
Discussion
Lessons About E-Bikes in Transport Models
Through this review of existing research and modeling practices, we synthesized several recommendations about how to model e-bike ownership, mode choice, and route choice in macroscopic transport models.
Modeling ownership differentiated both spatially and by person group is equally important for e-bike and car purchase choice models. This is because the utility, ownership, and use of e-bikes differ strongly by person group. The price of e-bikes is a main factor in individuals’ purchasing choices and will affect the number of e-bikes sold. However, attitudinal and societal factors also play significant roles in the decision to purchase an e-bike and it is therefore difficult to predict long-term developments relating to price or purchasing power. Learning from the existing research and seeking to fill a gap in current e-bike modeling practices, we propose a hybrid of a scenario-based- and a dynamic approach for modeling e-bike ownership. Total e-bike market penetration would be scenario-based and not an emergent model result. At the same time, the distribution of e-bikes among person groups and traffic zones would be dynamic and sensitive to model inputs such as infrastructure and topography. Based on our review, we would expect the interdependence between car and e-bike purchases to be negligible.
Components of generalized costs and their weights are crucial to both c- and e-bike mode and route choice. Attributes of choice alternatives and users’ personal characteristics that are relevant for route or mode choice of one type of bicycle can be assumed to also be relevant for the other. The difference in preference for dedicated infrastructure, slope, or other route attributes between c- and e-bikes demonstrates that model parameters should be estimated separately for c- and e-bikes. Including route attributes other than simply travel time in the computation of generalized costs and differentiating between whether a c- or e-bike is used are also relevant to mode choice, as the generalized costs for an exemplar route are commonly used in mode choice modeling. Our research showed that speed should be differentiated by person group, infrastructure, and bicycle type ( 4 , 30 , 47 ).
Mode choice varies by person group and trip purpose. This is not unique to e-bikes. However, changes in attitudinal and societal factors over time make it difficult to estimate mode choice parameters that will remain applicable for long-term forecasts. A fundamental shortcoming of all empirical travel behavior analyses is that they can only observe and describe behavioral changes within the societal context of the past and present. For example, offering a subsidy for an e-bike purchase might objectively increase the utility of that mode, however the subjective utility depends on societal norms and individual attitudes or needs. If societal norms inhibit people from viewing e-bikes as an appropriate or desirable mobility solution for their individual needs, the subjective utility of the mode will be rather low. Conversely, if norms promote the attractiveness of e-bikes as a natural and ubiquitous way of traveling, the uptake in use and the subjective utility of the mode will be higher. Transport models intend to forecast the impacts of measures decades into the future, yet it is challenging to confidently predict the fast-changing societal norms and attitudes toward e-bikes. Similar to purchase choice modeling, we therefore see the need for a certain degree of scenario setting within transport models. Overall e-bike mode share should be defined manually and, at the same time, individual mode shares should be computed for every combination of person group, trip purpose, and origin–destination pair under the constraint of the overall mode share. The potential impact of different scenarios for future e-bike adaption can then be explored while retaining a degree of mode choice sensitivity to interzonal characteristics such as topographic obstacles.
Most findings about route choice relate to the range of different components of generalized costs and their weighting parameters touched on earlier. Besides travel time, other route characteristics, such as physical exertion, nature, and tranquility, also affect enjoyment and should be included in route choice modeling. We did not identify any evidence that e-bikes call for completely new model structures. Instead, since the strength of the influence may vary (as shown, for example, for age or slope), we would expect model parameters for route choice to also vary between c- and e-bike models.
Limitations
Several limitations of this review must be considered. Some sources were relevant to a research field despite not being identified using the search string established for the respective field. This could indicate that we missed relevant sources from the literature. Excluding non-English language sources constitutes another limitation. It is uncertain to what degree the prominence of Dutch and Northern European source material might be explained by the high levels and long traditions of cycling in these countries or by this language restriction. By excluding research on scooter-style e-bikes, no studies included in this review were undertaken in Asia, likely forgoing valuable insights from different contexts. Our research does not address the general challenge of how to model (e-)bike-sharing, because our search strings favored sources investigating personal e-bike purchases. Future research would benefit from exploring what relevance such sharing systems may have for the propagation of new e-bike user groups by overcoming the price-based barriers to entry. Finally, this review focused on trip-based as opposed to activity-based models or agent-based simulations, which might provide additional directions for research.
Research Outlook
Since the literature agrees that avoiding physical exertion is the main motivation for e-bike purchase, we would expect the influence of topography on e-bike ownership, mode choice, and route choice to be strong. Despite the large body of research on how elevation affects mode and route choice of cycling in general, our structured exploratory literature review did not identify empirical evidence on this relationship by focusing on e-bikes. We therefore propose carrying out research on mode and route choice parameters differentiated by c- and e-bikes, including route attributes other than travel time (such as slope) using existing methodologies of map-matching GPS trajectories.
Research on the speed of different types of bicycles is plentiful, but we identified less work covering the differences in lost time at intersections. Based on the findings related to acceleration, differences in lost time for e-bikes compared with c-bikes should be estimated and, if significantly different, reflected in travel time calculations.
Data availability is a choke point for model calibration and validation, because appropriate data that distinguish between c- and e-bikes are rare. To most adequately model this growing transport mode, we recommend differentiating between c- and e-bikes when collecting data on, for example, travel distance distributions, vehicle ownership, and traffic counts. We further call for the development of automated counting sensors capable of identifying e-bikes to create new opportunities for large-scale data collection.
Because appropriate data for modeling bicycle traffic are rare, the tradeoff between falling specification error and rising data error as a result of increasing the model complexity is of particular concern. Differentiating between different types of bicycles does not improve model quality unconditionally. Indeed, model quality might suffer from an increase in model complexity if the differences in actual bicycle use turn out to be too small, or the increase in data error resulting from more disaggregate data collection turns out to be too large.
In our future work, based on the findings from this review, we will estimate bicycle mode and route choice models that distinguish between c- and e-bikes. We will implement these in selected municipal transport models to explore the capabilities and usefulness of a modeling approach that differentiates between c- and e-bikes.
Footnotes
Acknowledgements
We thank the agencies and persons responsible for the exemplary transport models and for providing us with valuable insights into their models’ specifications and development. The valuable feedback provided by the anonymous reviewers also substantially contributed to the final form of this article.
Author Contributions
The authors confirm contribution to the paper as follows: study conception and design: L. Arning, H. Kaths; data collection: L. Arning; analysis and interpretation of results: L. Arning; draft manuscript preparation: L. Arning, C. Silva, H. Kaths. All authors reviewed the results and approved the final version of the manuscript.
Declaration of Conflicting Interests
The authors declared no potential conflicts of interest with respect to the research, authorship, and/or publication of this article.
Funding
The authors received no financial support for the research, authorship, and/or publication of this article.