
Abstract
Automated stone manufacturing has undergone considerable development in recent years. Thanks to international research dealing with the cutting, sawing and grinding of different natural stones, processing time shortens and tool-life lengthens. However, the process of stone milling has not been extensively examined yet, primarily because of the novelty of this technology. The aim of the research described in this article is to examine how variable cutting speed affects the quality of workpiece edges while milling granite materials. For the research, sample surfaces were formed on five granite slabs with different average grain sizes using five cutting speed values. Afterwards, changes in the average surface roughness and average edge chipping rate were examined. From the research results, it can be concluded that, due to an increase in cutting speed, the average edge chipping rate will decrease until reaching a borderline speed. In the case of a higher cutting speed, the referent tendency cannot be ascertained. A statistical analysis conducted in the scope of this research showed that if a variable cutting speed is applied, then changes in the quality of the sample surface edge can be inferred from the development trends of average surface roughness.
Introduction
Natural stones – in their capacity as raw materials – are often used in the construction industry and in mechanical engineering technology. In the building industry, these materials are generally used for manufacturing statues, tiles and tabletops, while mechanical engineering technology prefers granite for manufacturing beds and tables for coordinate measuring machines and ultra-precision machine tools.
The research described in this article examines how changes in manufacturing speed affects the average edge chipping rate and surface quality of granite materials in the case of automated stone milling processes. In the scope of our research, in the first stage of our study, a sample surface was produced on granite materials using a Prussiani Golden Plus–type computer numerical control (CNC) machining centre. In the case of every granite material, sample surfaces were manufactured on five tables using five different cutting speeds. Following the manufacture, the average edge chipping rate of the exit edge of the surface was first established. The referent quantitative markers were obtained with the help of a Keyence-type blue light profile scanner and an analyst software application delivered with the scanner and running on a personal computer. For the surface studies, an Alicona Infinite Focus–type confocal microscope was used, and the average surface roughness, based on the standard surface, was measured at three places in the case of all sample surfaces.
After having carried out the milling and measuring processes, using a MiniTab 15 analyser software application, the effect of variable cutting speed was studied with reference to surface- and edge-qualifier quantitative markers. On the basis of a statistical analysis, it can be stated that an increase in manufacturing speed results in a gradually decreasing tendency both in average edge chipping rate and in average surface roughness. This tendency is describable using a quadratic regression line. In the case of both quantitative markers, it can be concluded that after the borderline speed is reached, an uncertainty in further tendencies prevails as far as chipping rate and average surface roughness are concerned: in the case of some granites, the monotonously decreasing tendency reverses and it shows a slight increase, whereas in the case of other stones, a further decrease in quantitative markers is observable after the borderline speed is reached. By comparing the changes of the two quantitative markers, it can be stated that the variation of the average edge chipping rate can be predicted from the surface roughness measurement in case cutting speed increases.
Literature review
In the past decades, numerous articles have been published in the field of automated stone manufacturing dealing with the research and optimisation of the technological environment of machining processes. The primary aim of such research was to explore the relationship between different technological parameters, the properties of the tools applied and the quality of the surface to be formed.
There are many research methods to test the effects of technological parameters on surface roughness in automated natural stone manufacturing. One test method is to develop mechanically operated surface roughness measuring devices and use them in research. Mechanically operated devices that measure surface roughness are based on the scanning of a certain area of the stone surface in question.1–3 In the scope of studying cutting processes using a diamond disc, Ribeiro et al. 4 examined the effects of surface roughness of granites concerning their workability and potentially applicable technological parameters. The research results revealed a correlation between Knopp hardness and Amsler wear; furthermore, the research also concluded that material structure has the strongest influence on the brightness of granite surfaces.
In the field of stone milling, researchers often investigate tool wear with the help of force measurements. For the cutting of different natural stones, Turchetta and colleagues5,6 have examined the relationship between changes in tool wear and cutting force. Through the use of sensors, the axial components of generated forces were measured. The research has shown that technological parameters have a significant influence on tool wear and cutting force. In addition, the study also revealed that the wear rate of the cutting discs can be improved by optimising the technological parameters applied.
However, different measuring and testing microscopes provide much more accurate and detailed results than mechanically operated roughness measuring devices. The most commonly used type of measuring and testing microscope is the confocal microscope, which is used as a basic device in many research projects. In the case of granite, the applied technological parameters (feed rate, cutting speed and cutting depth) can greatly affect the average surface roughness of the manufactured surface. Aydin et al. 7 studied the effects of different manufacturing parameters on cut granite surfaces. On the basis of microscope-based results obtained during their research, it was concluded that the average surface roughness projected on the surface increases due to an increase in cutting speed and cutting depth. Kaplonek et al. 8 examined the active surfaces of a new generation of coated abrasive tools with the help of a focus-variation microscope. Using a confocal microscope, Neděla et al. 9 have proposed a new approach for ripple nanopattern construction on the surface of two polymer (polyethylene naphthalate (PEN) and polistirol (PS)) substrates.
Apart from the research described above, detailed topographic studies have also been implemented using confocal microscopy. Studies of outstanding importance for us now are research projects concerning the surfaces of granite used as raw material for the manufacture of machine tool components.10,11 Literature10,11 addressing this issue describe the behaviour of a variety of minerals of tested granites with reference to the properties and parameters of microbrittleness and microfracture. The aim of such reviewed researched projects was to develop an estimating system that can predict the workability characteristics of different granite materials. Concerning the different units of granite, Xie 10 developed a detailed topographic system for the classification of stone types that form diverse stone materials: they categorise stone types into different ‘layers’. In addition, using a confocal microscope, crack and fracture processes were also examined on different types of granite and marble used in the construction industry.12,13
In the scope of the sawing of natural stones, similar processes are used as in stone milling technology. Verdú et al. 14 developed a new energy-saving cutting disc for the sawing of marble materials. The researchers controlled the full construction and production planning process with the help of different digital software applications, then they analysed the efficiency of the cutting disc. Yu et al. 15 investigated a new method in the production of an ultrafine abrasive tool developed for vertical spindle grinding. The results of the research have shown that brazed diamond abrasives could dress the grinding discs with high efficiency and with satisfactory flatness. Also, new ultrafine abrasive discs were found to be able to process silicon wafers and granite slabs with acceptable results.
The main objective of many studies was to find out which of the minerals forming natural stones are the most dominant in developing fracture mechanisms.16,17 The first step in this examination was to exert an artificial fracture on the stone product, which was followed by a detailed analysis of both the fracture image and the mineral particles of the fracture surface using a confocal microscope. Based on the findings, a software application and algorithms have been developed that are capable of advising on the most resistant types of stone for use in the light of the actual chipping load.
The literature also deals with the issue of edge chippings of brittle materials in general, and there are also research projects focusing on different subgroups of such chippings. One common way of testing chippings is to generate artificial chippings using different indenters and to draw conclusions based on these processes. Chai and Lawn 18 and Chai 19 published several articles on various experiments in connection with the edge chippings of brittle materials. The researchers realised that the resulting edge chippings can most effectively be analysed using three parameters. These parameters are the following: the length of the edge chippings and the maximum depths of the edge chippings on the two surfaces constituting the edges. The researchers supposed that the resulting edge chipping brought about by force P generated on distance h from the edge is similar to a quarter-ellipsoid. They also assumed that the individual variables can be calculated and compared based on this hypothesis relying on the three parameters included.
When grinding ceramic tiles, similar processes occur as in the case of stone milling. In addition to this, the construction of tools and the material separation features are almost identical in both cases. Sun et al. 20 tested ceramic products for the effect of technological parameters on surface quality. The results of the research have shown that if cutting speed is increased or if grinding depth is reduced, the grinding force will decrease and the surface quality will improve. Sun et al.’s research results also showed that cutting speed has a much greater effect on surface quality than on cutting depth. Gogotsi et al. conducted numerous tests on oxide and non-oxide ceramics. The aim of the tests was to learn about the chipping processes generated during the manufacturing of ceramic-based edges, and to explore certain relationships and interconnections in order to estimate the effects of a particular force on the surface edge.21,22 Chai and Lawn 23 tested the characteristics of edge chippings caused by the impact of an indenter not only in the case of ceramics but also with reference to glass. Concerning edge chippings of glass, the researchers tested the effectiveness of an equation that was established during their studies of ceramics. Using the equation, the maximum depth of the chipping measured on the indenter-side surface can be defined on the basis of the impact of force.
The literature also abounds in studies of the edge chippings of natural stones. Working with sandstones, Bao et al. 24 have published direct research results in connection with edge chipping processes generated by an indenter. On the basis of the tests, it was concluded that there is an obvious relationship between maximum force and the distance of the load from the edge, which gave rise to the development of a tool for estimation. In another publication, the same research team 25 has generated different chippings using cone- and pyramid-shaped indenters – this time in the case of stones – and then the researchers examined the extent and number of the resulting edge chippings. In a study, Tambovtsev26,27 cuts stone blocks using an external force and examined the processes of edge formation. Depending on the mechanical properties of rocks, the geometry of the bench, the diameter of drill holes and the meterage drilled, the author has developed an approximate analytical model to find out the amount of energy input required to initiate a main crack. Gyurika 28 has researched the effect of feed rate and diamond grain size on edge chipping of milled granites. In that research, the general research result, in the case of all granite types, is that reductions in the size of the diamond grains generate a corresponding decrease in average edge chipping rates.
Characterisation of machined surfaces and edge chippings
There are standard methods for determining the quality of the edges of milled granite products and for the characterisation of machined surfaces. However, for the performance of detailed analyses and comparative tests, a quantitative marker is needed that enables a more precise rating and evaluation of edge chippings.
Evaluation of milled surfaces
Some of the studies in the literature dealt with the average surface roughness measured along a line in the scope of examining the surface roughness of natural stones using a confocal microscope.11,12 Nevertheless, the aim of measurement in these studies was not to analyse changes in surface roughness. The literature that examined how changes in a working environment parameter affected surface roughness8,9 focused on the measurement and application of area-based surface roughness values. In the case of natural stones, the use of these values is effective because, due to the heterogeneous grain structure of different granites and marbles, the roughness values measured along a line result in particularly high standard deviation. With a view to the above-mentioned heterogeneous grain structure, qualifier quantitative markers were projected on the examined area. As a result, a narrower margin of error was obtained as compared to our measuring range targeting a group of minerals constituted of nodes, which feature of such minerals greatly affects surface roughness. Therefore, in this research, we worked with average surface roughness values projected on the referent area (Sa).
Determining the average edge chipping rate
During the research introduced in this study, the so-called average edge chipping rate was used as a quantitative marker, which is based on specific volume loss and can be measured on the edges of the milled granite surfaces produced in the scope of our research.29,30 For generating a dimensionless quantitative marker for the purpose of determining the average edge chipping rate, a ratio-based calculation has been applied: its numerator contains the sum of the volumes of the edge chipping, whereas its denominator contains the geometry representing the intact, unharmed body. In light of this, the equation that yields the quantitative marker is the following

where

where
The hypothetical radius value was defined as 1 mm. As a result of this, after having substituted equation (2) in equation (1), we have managed to determine the final, simplified formula of the calculation of the average edge chipping rate as

In the scope of the studies,29,30 a complex geometry was defined that helps to approximate the volumes of edge chippings with high accuracy. The replacement body consists of two quarter-elliptical cones that are connected to each other by way of their flat bases (Figure 1). For the determination of the volume of the solid figure, three parameters of the chipping need to be known. The first parameter is as follows: the height of the twin-cone is equal to the distance between the starting and end points of the chipping. The length of the axis of the ellipsoid used as the base of the cones is equal to the maximum chipping depth measured along each of the surfaces that constitute the edge.

Replacement body. 30
Production of sample surfaces
The first phase of the study constituted of the manufacturing of the samples. Subsequently, the surfaces and edges of these samples were measured so that the relationships between variable cutting speeds and the quality of workpiece edges as well as changes in average surface roughness and average edge chipping rate could be defined in accordance with the research objectives.
Granite types selected for examination
As part of our research, we have selected deep magmatic rocks in which the silicate rock components likely to provoke volcanic eruptions exhibit distinct differences in size. For exploring the rock-forming minerals, thin slices were prepared by the Budapest University of Technology and Economics. As the international stone standard divides granite products into five groups by their particle size, we also worked with five different commercial granites. Table 1 shows the typical dimensions, the main rock-forming minerals and the group classifications of the individual granite types.
The main characteristics of granites used during the experiments.

Manufacturing process
For the manufacturing of granite sample surfaces, a numerical control (NC), Italian-make, Prussiani Golden Plus–type machine tool specifically designed for rock drilling and milling was used (Figure 2). The maximum power consumption of the machine tool is 15 kW, the range of motion in the direction of axis X is 3300 mm, while in the direction of axis Y, it is 1600 mm and in the direction of axis Z, it is 250 mm. The applied spindle speed varies from 0 to 10,000 rotations/min.

Prussiani Golden Plus–type stone milling machine.
For the milling, a 100-mm-diameter face-milling tool was selected, which consists of 22 segments (Figure 3). As far as general purposes of the tool are concerned, it is suitable for natural stones; therefore, it is sufficient for material removal in the case of marble, limestone and granite. The tool segments are made up of cobalt-based matrices and diamond grains of the same size. During the machining process, continuous flood-type water-cooling was applied, which was managed by the machine tool.

Face-milling tool for stone cutting.
The overall dimensions of the available granite slabs were 300 × 300 mm. On the surface of each block, five sample surfaces were prepared by the NC stone machining centre. As the first step of the machining process, the granite plate was fixed on the worktop followed by preliminary face-milling so that any potential two-dimensional differences could be equalised. After the face-milling, five sample surfaces were machined on all granite slabs. Apart from one parameter, the same tool and the same technological environment were applied for the production of the sample surfaces. The only variable that was changed during the experiment was cutting speed. In fact, a variety of cutting speeds were applied including 200, 500, 800, 1100 and 1400 m/min. These parameters fall within the range of efficient machining carried out by tools. In the case of the machining of the sample surfaces, a 45 mm cutting width and a 1 mm cutting depth were applied. The feed rate available on one tool was 0.4 mm/rot. During machining, down milling was used, as this milling method is the common one used for material removal in the case of natural stones. In fact, each of the sample surfaces was machined in a way that there was a 1 mm division between each two of the samples so that milling-through could be prevented. This arrangement was important as otherwise milling-through could potentially have induced the values measured on the sample surfaces machined by different technologies, thereby yielding transient results (Figure 4). Three series of milling were performed on each type of granite in order to enable the successive repetition of the examination three times per stone.
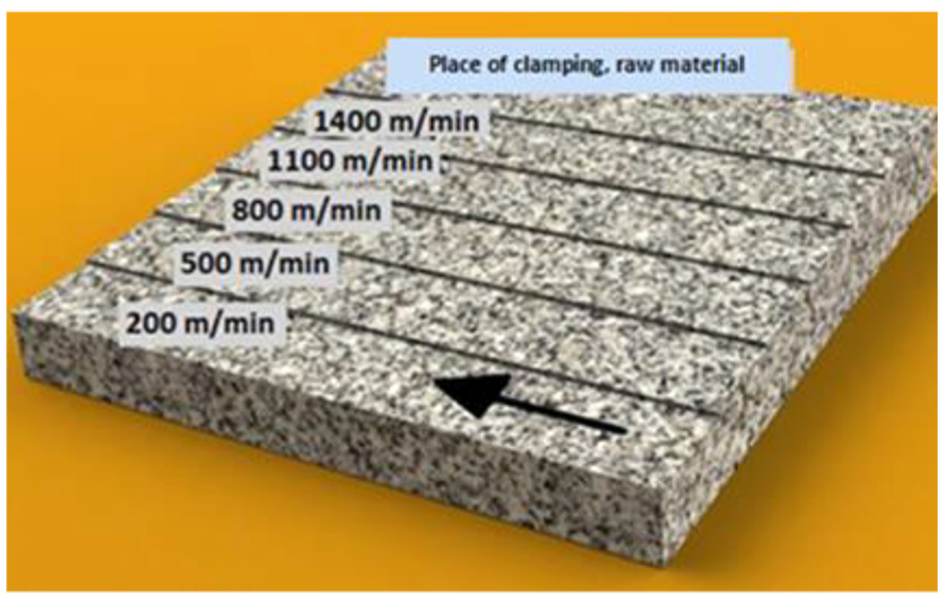
Machining process plan.
Measurement environment and methodology
At the Budapest University of Technology and Economics’ Department of Manufacturing Science and Technology, a measurement arrangement was set up in order to examine the edges of available sample surfaces. In the scope of this arrangement, two units were necessary for performing the test: a moving mechanism and a scanning device that digitises, in small steps, the edge in the form of contours. A qualifying device was also necessary for determining, on the basis of the scanned contour elements, the parameters essential for the volume calculation of the edge chippings situated on the tested length.
A Siemens-controlled Topper TMV510-type CNC machining centre was used as the moving mechanism. Its working field on axis X is 510 mm; on axis Y, it is 360 mm; and on axis Z, it is 300 mm. Its spindle power is 5.5 kW, and the spindle is capable of performing maximum 12,000 rotations/min. The positioning accuracy of the machine tool is 0.01 mm, and its repetition accuracy is 3 μm. For the scanning of the edges of the granite surfaces, a Keyence LJ V7080-type blue laser profile sensor was used. Based on the frequency defined by the user, the laser scanner digitises the geometries of the measurement range along a line and it records the scanned contours in files. On the basis of the information provided by the factory, the accuracy of the axis of the unit on each axis is as follows: along axis X, it is 10 μm, whereas along axis Z, it is 0.5 μm. Two analysis–purpose applications produced by LJ Navigator delivered with the profile measuring equipment produced by Keyence were applied as analyst software. Altogether, 16 values, measurable automatically by the software, can be set in the computer system per each contour slice.
After the selection of the units constituting the testing system, the measuring arrangement was planned. In the measuring environment, the granite sheets were fixed on the worktop of the machining tool using standard machine elements. Then, the laser profile measuring unit was fixed on the housing of the NC machine in a way that the scanning head and the tested edge constitute a 45° angle (Figure 5). The feed rate speed of the table of the machining tool and the scanning frequency of the profile measuring unit were defined so that the relative distance between the scanned contour edge sections was 0.1 mm. The 45-mm-long sample surfaces were scanned every 1.5 min by the Keyence profile measuring device using the 300 mm/min feed rate speed set in the NC program. The data generated this way were recorded on the hard drive of a laptop connected to the unit.

The positioning of the profile scanner in the measuring environment.
With the help of the LJ Navigator software, the distances between the starting and end points of the edge chippings, as well as the maximum chipping depths measured on the surfaces constructing the edge, were defined. As the angle of the scanner and the tested edge was set at 45°, the chipping depths on the surfaces could easily be calculated based on the distance between the two axes of the coordinate system used (Figure 6).

The measurement of chipping depth in the direction of the axis.
For the determination of the surface roughness of the granite samples, an Alicona Infinite Focus–type confocal microscope was used. This measuring instrument allows for the full scanning of the defined surface area. Then, based on the digitised area, the software connected to the microscope automatically determined the average roughness values projected on the surface. Preliminary investigations revealed that, in the case of granite surfaces, efficient measurement results could be achieved using a microscope with a 5× magnification focusing head, so we also worked with this objective in mind in the scope of our research. The scanning speed of the objective was 120 µm, its repetition accuracy was 0.12 µm and its maximum resolution was 3.49 µm.
Each sample was measured at three places on the basis of the measuring principle developed. These places were as follows: 50 mm from each of the two ends of the sample surface and also at the axis of the symmetry of the sample surface. The 50 mm distance from the edges was necessary as the tool worked with the maximum cutting width in this position. Therefore, concerning the three measuring positions the same working environment could be assumed. Based on the parameters set, the confocal microscope automatically carried out the digitisation of the surface area (Figure 7).

The surface examination of stone No. 4 using a confocal microscope.
After the surface area had been digitised, the evaluation–purpose software delivered with the confocal microscope produced the three-dimensional (3D) image of the scanned area (Figure 8). This was followed by obtaining and analysing the measurement results.

3D surface image captured by a confocal microscope.
Test results
After carrying out three chipping series on five granite slabs, the average edge chipping rates measured at different cutting speed values and at average surface roughness values have become available. A referent statistical analysis was performed with the help of a MiniTab 15 application. When using the software, declaration diagrams, confidence intervals (red dashed curves) and prediction ranges (green dashed curves) were generated with reference to each declaration diagram. Then, using analysis of variance (ANOVA), the significance of the quadratic regression line matched with the points of measurement has been analysed with reference to the measurement results. On the basis of this analysis, it can be stated that the application of the quadratic regression line provides an effective approximation in the case of all diagrams.
The analysis of the effect of cutting speed on average edge chipping rate
Having analysed the diagrams (Figure 9), it can be stated that in the case of all types of granite, an increase in cutting speed results in a steady decline in average edge chipping rate (Mavg). In the case of all stones, this trend is generally valid up to the borderline speed range of approximately 1100 m/min. Over this range, trends become diverse. In the case of stones No. 1 and No. 4, due to a further increase in the cutting speed, edge chipping rate also increases. However, the rise – compared to the earlier rate of decrease – is modest. This ‘rising curl’ in the regression curve can be generated by tool wear as well as by the size and the fracture parameter of grains. In the case of those stones where there is a decrease in the average edge chipping rate when high cutting speeds close to the upper limit of the applicability of the tool are applied, the minimum value of the qualifier quantitative marker will be in the range of around 1100 m/min. In the case of granite Nos 3 and 5, there is stagnation in the average edge chipping rate in the range above 1100 m/min.
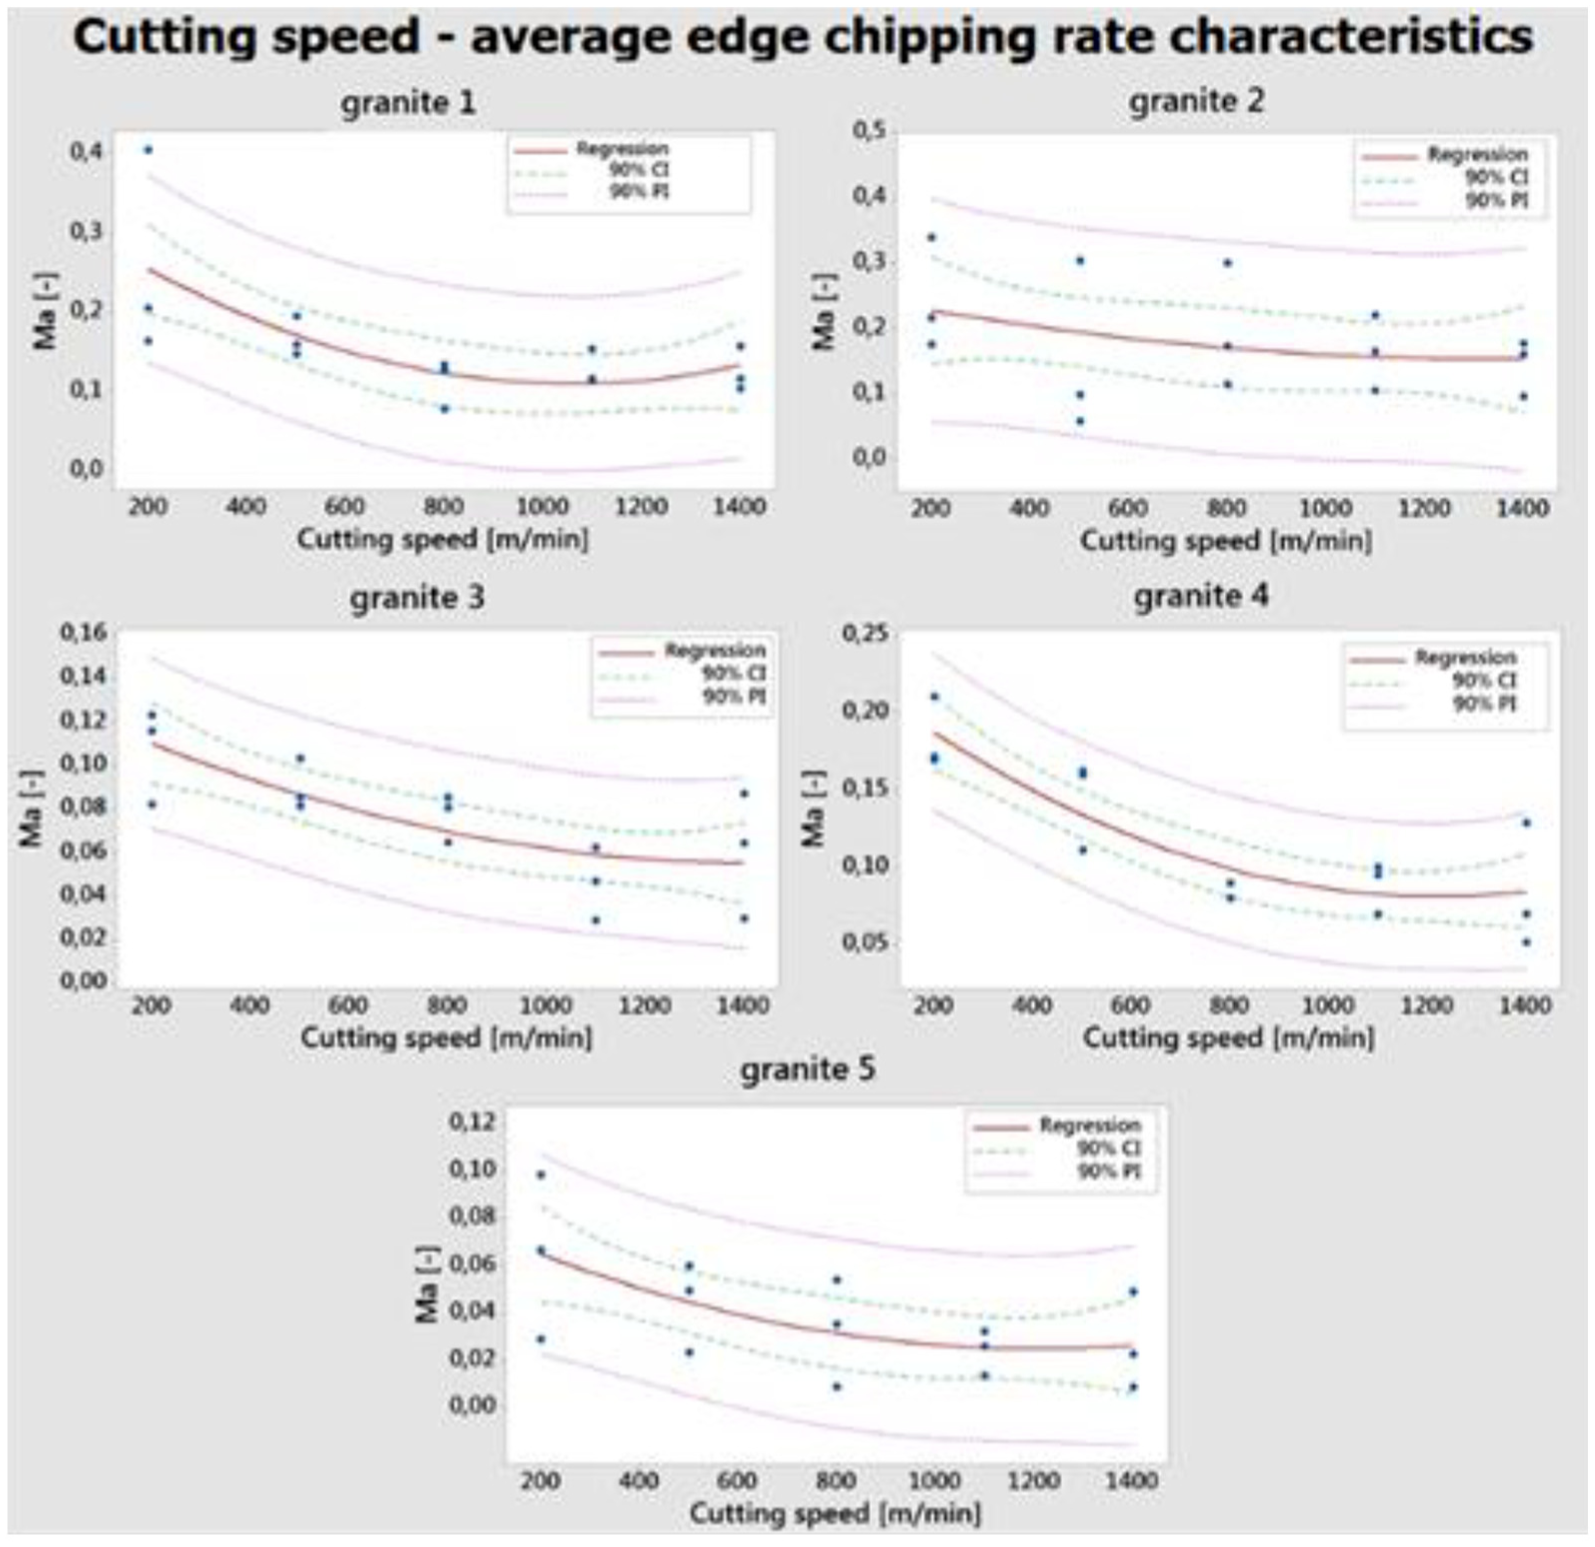
Changes in average edge chipping rates.
By looking at the diagrams related to granite type 2, we realise that there is no change of trend in the case of higher cutting speed ranges. Therefore, based on the tests conducted within the scope of our research, it can be concluded that there is a steady decrease in average edge chipping rate in the tested cutting speed range. In the case of granite type 2, it is also true, however, that after reaching the borderline speed average, a decrease in edge chipping rate is observable.
After a closer examination of the diagrams and subsequent to performing the ANOVA analysis, it can be stated that, according to the variance analysis, the significance coefficients – in the case of stones Nos 1, 3, 4 and 5 – are so low that there is an obvious relationship between the change in the average edge chipping rate and the quadratic regression line assigned to this change. In the case of stone No. 1, this value is p = 0.015, which means that there is only 1.5% likelihood that the applied regression line is not significant with respect to changes in average edge chipping rate. In the case of stone No. 3, this significance is p = 0.006, in the case of stone No. 4, the referent value is p = 0.024, whereas in the case of stone No. 5, it is p = 0.053. With respect to the variance analysis, it can be stated that the only type of granite whose coefficient value falls outside the limits referenced above is stone No. 2. Based on the analysis of the diagram of granite No. 2, it can be claimed that the resulting shallower regression line was probably generated by the relatively low values measured on the second sample surfaces. These exceptionally low values were generated by those types of minerals that are situated in nodes on the granite edges and break in layers. With the help of the ANOVA analysis, it can be concluded that, in the scope of the examination of the average chipping rates of the granite edges, effects of the change in cutting speed can efficiently be approximated with the help of a quadratic regression line. Nevertheless, based on the study of the regression lines, it can be concluded that the approximating lines are situated relatively far from the measured data. This characteristic is probably caused by the high level of inhomogeneity of the different granite materials, but other factors can also be responsible for this high deviation.
The examination of changes in average surface roughness
After changes in the edge damage of the granite samples were analysed, diagrams depicting changes in the average surface roughness of the different stone types were constructed using a MiniTab 15 software application. With the help of variance analysis, the significance of the quadratic regression line approximated to the measurement points was also studied.
Based on the analysis of the diagrams (Figure 10) concerning the different granite types, it can be stated that in the case of all granite types, the average surface roughness shows a steadily falling trend as a result of the effect of the increase in cutting speed. This tendency is obviously valid up to around 1100 m/min cutting speed. After the borderline speed is reached, further changes are difficult to predict. In the case of stones Nos 1, 3, 4 and 5, stagnation or a slight rise in average surface roughness is observable.

Changes in the average surface roughness of granites.
In the case of stone No. 2, this change of trend is not observed, but in the case of the tested granites, the borderline speed is also 1100 m/min, above which the rate of the average surface roughness significantly falls. With reference to all regression lines, it is true to say that the slope of the fall is larger than the extent of the increase above the speed limit.
Based on the ANOVA analysis of the measurement results shown on the diagrams, it can be stated that in the case of every stone, the significance coefficient is so low that an obvious relationship between the changes of the average edge chipping rate and the quadratic regression line assigned to this change can be observed. The value of the significance coefficient is the lowest and thus the least desirable in the case of stone No. 4, where it amounts to p = 0.018. These values show that, even in the case of the granite with the worst results, there is only 1.8% likelihood that the applied regression line does not show a significant correlation with the change in the average edge chipping rate. Based on these convincing variance analysis results, it can be affirmed that in the case of the examination of the milled granite surfaces, the effect of cutting speed on average surface roughness can be approximated effectively with the help of quadratic regression lines.
Comparative analysis
By comparing the statistical analyses described in the previous two sections and based on the diagrams showing the averages calculated from the three milling series, it can be stated that in the case of granite materials, an increase in cutting speed produces similar effects as far as changes in average edge chipping rates and changes in average surface roughness are concerned (Figure 11). In the case of every diagram, a continuous trend of decrease can be observed, which is caused by a rise in cutting speed, up until a borderline speed of around 1100 m/min is reached.
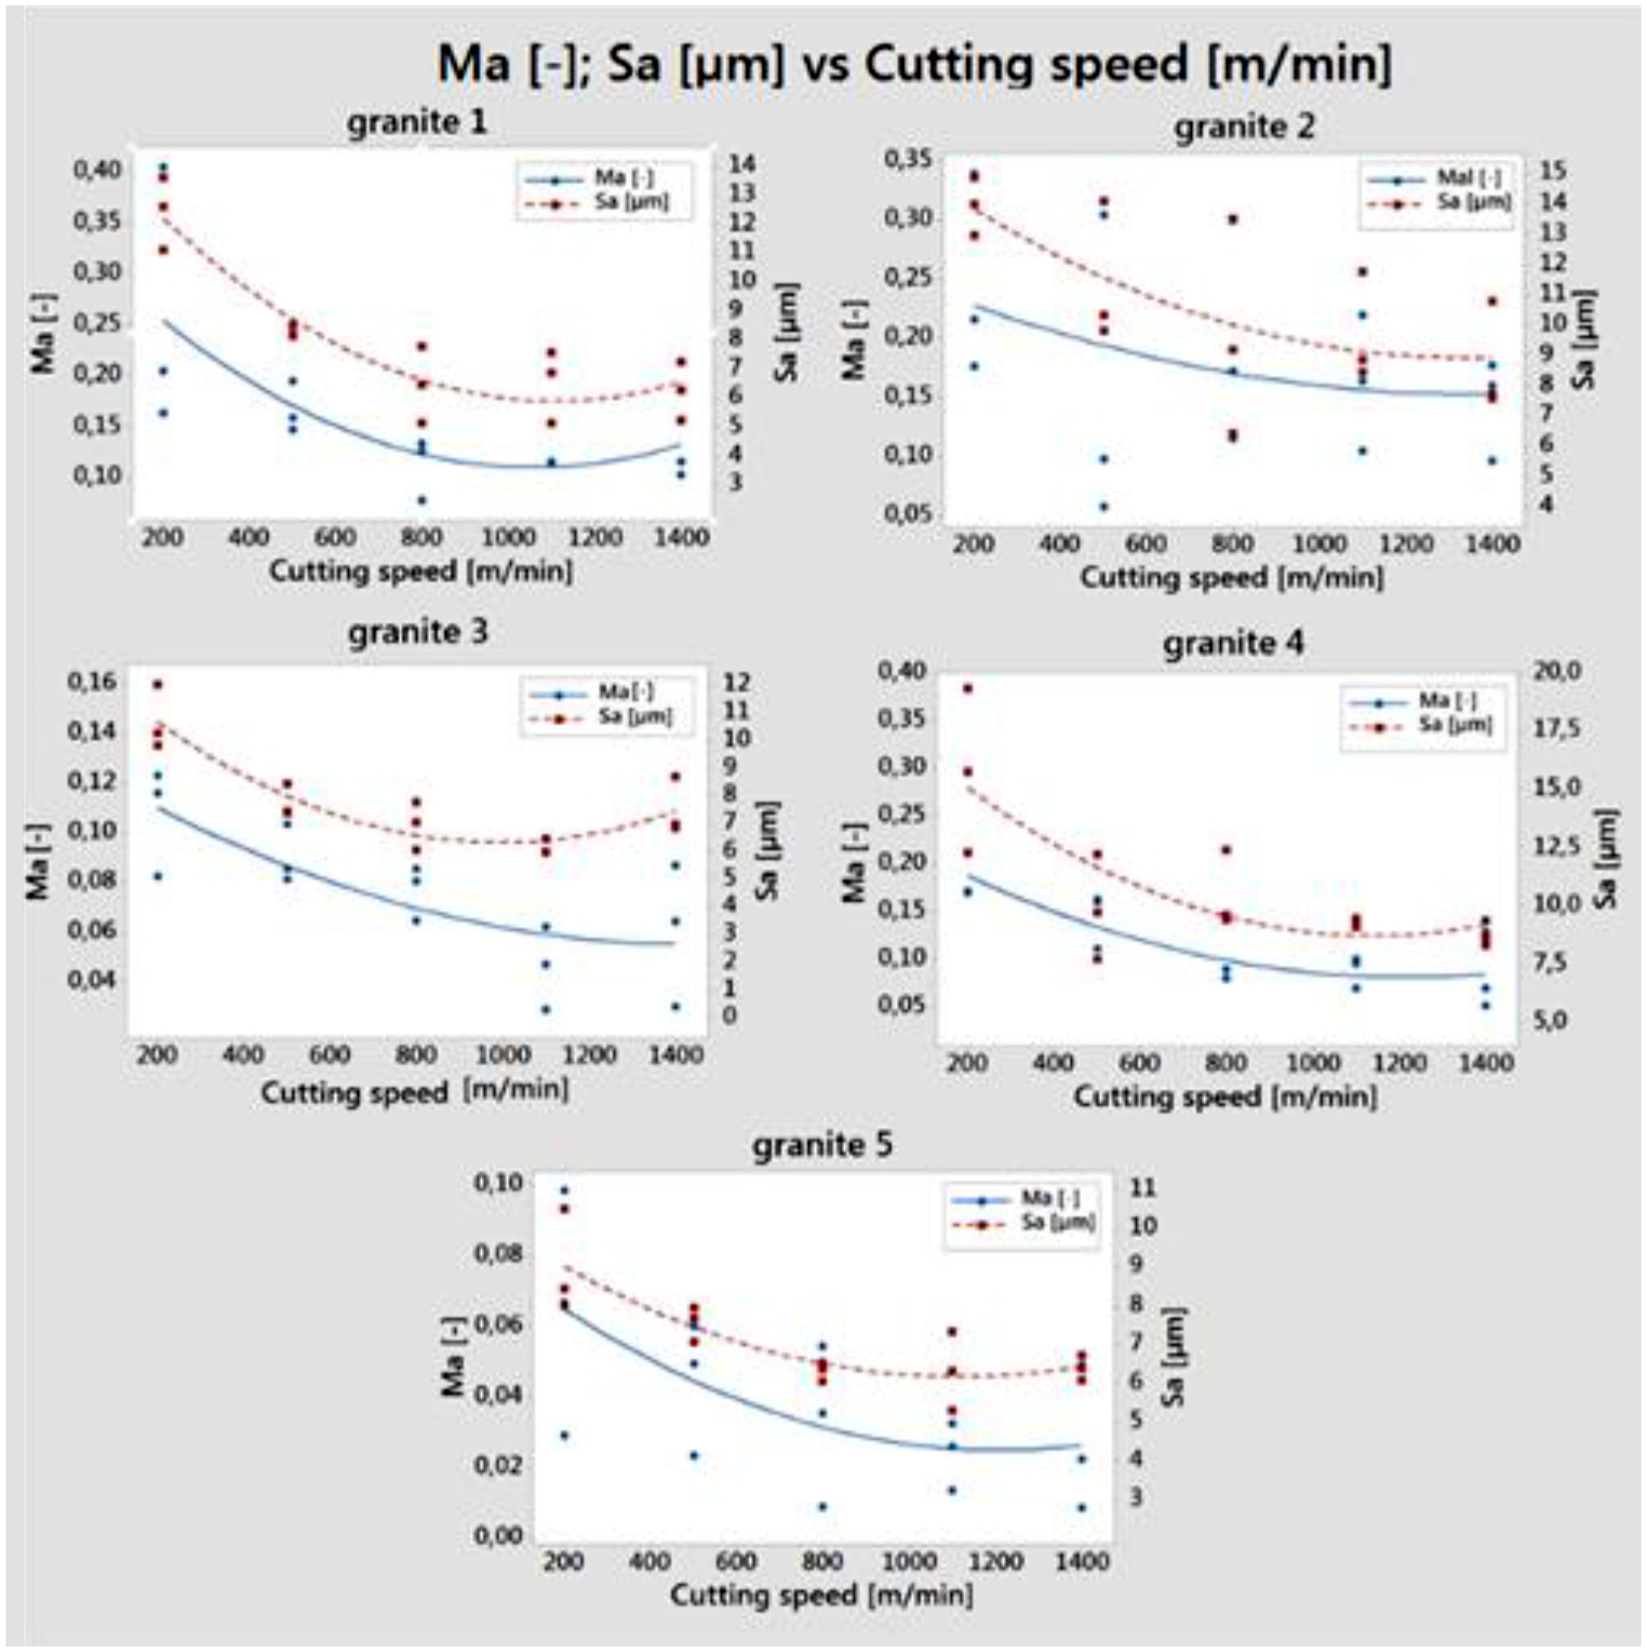
Comparative diagram of the different stones.
In the case of stone No. 1, it can easily be observed that, due to an increase in cutting speed, both the average surface roughness (Sa) and the average edge chipping rate (Mavg) can be described as a monotonous downwards trend, whereas borderline speed starts to rise slightly after having reached around 1100 m/min. There is a similar tendency in the case of granite No. 4, whereas in the case of stones Nos. 3 and 5, stagnation in both quantitative markers can be observed after the borderline speed has been reached. On the basis of comparing the surface- and edge-qualifier quantitative markers of granite No. 2, it can be concluded that these continuously decreasing trends apply to both characteristics. Despite all this, in this case, there is no minimum value: in the entire testing range, both parameters are characterised by a continuous and monotonous decline.
Conclusion
The research described in this article had two purposes. (1) We intended to examine how an increase in cutting speed, when applied during the milling process, affects the edge-qualifier quantitative marker of granite surfaces. (2) Our second aim was to establish a correlation between the average surface roughness measured on the samples and the changes in average edge chipping rates with reference to increasing cutting speeds. In the light of this, our research revealed the following trends:
The statistical analyses revealed that the average edge chipping rate measured on the edges of the milled granite surfaces shows a continuously decreasing trend, which is triggered by a rise in cutting speed; this trend continues until this average rate reaches a borderline speed of around 1100 m/min.
In the case of some granite materials, this trend of decline – after the determined border speed value has been reached – continues while showing a gradual slow-down. However, in the case of other granite types, this tendency reverses and a slight rise is observable.
This moderate rise can be induced by the vibration caused by high cutting speeds or by the properties of the minerals constituting the examined granite materials. Concerning our research, the following results can be established:
The analysis of the comparative diagrams presenting the changes in surface- and edge-qualifier quantitative markers reveals that there is an obvious similarity between the trends of the changes of the two quantitative markers. This is attributable to an increase in cutting speed.
From the comparative analysis, it can be concluded that in the case of four out of five granite types, a much more moderate increase can be observed as compared to downwards tendency around the 1100 m/min borderline speed range.
However, no change of tendency was observable in the case of either of the two quantitative markers concerning one particular granite material. Nevertheless, a continuous decrease was identified in the referent quantitative marker rate, which was triggered by an increase in cutting speed.
Based on our analysis, it can be stated that in the case of milled granite surfaces, in the light of the average surface roughness projected on the surface, changes in average edge chipping rate can be anticipated if cutting speed is increased.
Footnotes
Acknowledgements
The authors thank professor Miklós Gálos (Department of Construction Materials and Engineering Geology, Budapest University of Technology and Economics) and teaching assistant Anna Ferenczy (Department on Manufacturing Sciences and Technology, Budapest University of Technology and Economics) for their help with, and contribution to, the evaluation of the experiments within the scope of this research. The authors express gratitude to Managing Director of Woldem Ltd, Mr István Gyurós, and Keyence Ltd for providing technical support in the machining and scanning processes.
Handling Editor: Daxu Zhang
Declaration of conflicting interests
The author(s) declared no potential conflicts of interest with respect to the research, authorship and/or publication of this article.
Funding
The author(s) disclosed receipt of the following financial support for the research, authorship and/or publication of this article: This study and the publication of the pertaining results were partly supported by the European Commission through the H2020 project EPIC under grant no. 739592. The authors acknowledge the financial support of Széchenyi 2020 under the EFOP-3.6.1-16-2016-00015.