
Abstract
In this article, the efficiency loss of a beer filling line is investigated and modeled to improve its system performance in terms of overall equipment effectiveness and productivity. First, research is aimed at problems related to beer filling line resulting from poor production management where utilization and productivity of filling machines are low. This article derives the overall equipment effectiveness of filling machines and overall throughput effectiveness of the filling line, with the overall throughput effectiveness of general system (OTE(S)) obtained based on these measurements. Based on these metrics, the efficiency evaluation system is established. Next, according to the efficiency evaluation indexes, overall equipment effectiveness, and OTE(S), the overall efficiency of filling machines and filling line are calculated, respectively. From the results, the stenciling machine has the lowest efficiency. However, considering overall throughput effectiveness indexes and production capacity, unit 3 is the bottleneck and limits the entire productivity. Finally, efficiency loss is analyzed based on the overall equipment effectiveness and OTE(S) calculation results. Using a fishbone diagram for analysis, the cause of equipment loss is summarized and countermeasures are offered. Theory of constraint is used to analyze the efficiency loss of the filling line and give suggestions for improvement. This research can help beer enterprises achieve continuous improvement of equipment efficiency and production capacity.
Keywords
Introduction
In the beer industry, beer filling is the most complex and important link, as the quality of packing is directly related to product cost and sales. The main packaged forms of beer are as follows: glass bottle, plastic bottle, and aluminum can. Differences in sterilization can cause beer to be divided into pasteurized beer and draft beer. In addition, differences in liquid level, beer variety, labeling techniques, sterilization methods, bottle shape, and other factors result in the technical parameters of filling machines becoming uncertain and complex. In turn, filling production management is difficult, resulting in a serious loss of equipment efficiency in the beer filling process, limiting improvement of efficiency. At present, the bottle damage rate and beer loss is high in China, with filling machines losing up to 2%–3%, whereas foreign production sees only 0.5%. However, the filling process is unqualified; as beer may spray out while filling, the liquid level of beer in bottles is inconsistent, capping defects arise, as well as other problems. The efficiency of bottle washing is low with residual alkali remaining after washing, as well as labels that cannot be washed away. In addition, labeling is unqualified, as there are wry labels, folded labels, and broken labels following the labeling process.
In addition to the above problems that exist in beer filling production, there are also management problems pertaining to the filling line. These problems include low information collection accuracy, abnormal events that cannot be processed in time, and the maintenance and management of equipment are backwards. These problems require urgent solutions through establishing an efficiency evaluation system to assess filling machine efficiency and improving production line efficiency for beer enterprises.
The overall equipment effectiveness (OEE) was first introduced by Nakajima 1 in the context of total productivity maintenance (TPM) as a metric of equipment efficiency. As a well-known measurement method, OEE can fully reflect the equipment condition in the production site, and it is widely used in the manufacturing industry to analyze equipment efficiency. Netto et al. 2 used OEE to predict shutdown maintenance and suggested that a correlation exists between the time-between-stoppages and the trend degree of the mean and/or the standard deviation of cycle time, aiming to help predict maintenance shutdowns. Ylipää et al. 3 identified the maintenance improvement potentials using an OEE assessment within the manufacturing industry. Here, various equipment losses were quantified using OEE, including factors such as availability, utilization, speed, quality, and planned stop time. Based on the results, improvement potential and future trends for maintenance can be identified. Tsarouhas 4 researched application of OEE in the beverage industry through the analysis of failure and repair dates on the production line over a period of 8 months. The computation results using OEE accurately identified critical points in the production process requiring immediate action to improve the productivity and the efficiency of the line. Tsarouhas 4 indicated that OEE can also be utilized in the machinery manufacturing sector of the beverage industry. Specifically, manufacturers of bottled products can use OEE to improve the design and operation management of bottling production lines. De Ron and Rooda5,6 demonstrated that OEE could be affected by environment, and as such, the concept of equipment effectiveness, E, was put forward and is solely affected by the behavior of the equipment itself. OEE does not always indicate the influence of changes in equipment properties; however, the introduction of E compensates for this lack. The concept of E is applicable to equipment level only and not to the entire line. OEE has demonstrated good functions in analyzing availability, performance, and quality; however, raw materials and environment, such as production systems, logistics, labor, and operation, may also contribute significantly to the equipment performance. In addition to the method E put forward by De Ron, Garza-Reyes 7 presents an alternative measure derived from OEE called overall resource effectiveness (ORE). ORE can provide more comprehensive information concerning the production process. Hedman et al. 8 researched loss factors from automatic measurements of OEE. OEE losses are difficult to classify if the data set is large. As such, distribution and classification of losses and critical factors that directly affect the accuracy and applicability of OEE measures are identified, helping to utilize the full potential of this automatic data acquisition system. The OEE method is simple and clear and demonstrates excellent performance in analyzing and evaluating equipment efficiency. OEE has been recognized as a fundamental method for measuring equipment performance and is accepted as a primary performance metric. 9 Although OEE quantifies equipment capacity at the device level, it cannot measure the efficiency of the filling line, nor can it identify process bottlenecks, equipment and whole equipment life-cycle efficiency loss, releasing loss, or hidden capacity.10,11 As for the production line, throughput is an important index for evaluating production system performance. Muthiah and Huang 12 researched efficiency losses on the factory level, demonstrating that the overall throughput effectiveness (OTE), derived on the basis of OEE, is a metric of the relative relationship among equipment in a production system. Compared with OEE, OTE measures factory-level performance and can also be used for performing factory-level diagnostics such as bottleneck and identifying hidden capacity. However, OEE can only be used to one machine, and this method cannot find bottlenecks from the global perspective.
This article derives OTE method and establishes universal model (OTE(S)) for general production system, based on this model to analyze the efficiency loss of entire filling line and find out the bottleneck. Then, on the basis of fault analysis, the measures to deal with different fault factors were given.
Overall efficiency evaluation of a beer filling line
In this article, a system for efficiency evaluation of a beer bottling line is established and is shown in Figure 1.

Efficiency evaluation system of a beer bottling line.
To establish an efficient evaluation system of a bottling line, a reasonable and effective efficiency evaluation index should be put forward followed by an evaluation index to research and analyze the efficiency loss. After this proposed analysis, optimization and improvement suggestions are given as demonstrated in this article.
This article researches OEE tools as well as theoretical methods of measuring overall equipment. The overall efficiency measurement formula is deduced from the structural characteristics of a general production system based on the formula to calculate the OEE/OTE indexes.
OEE
OEE is composed of three performance metrics: availability rate (A), performance rate (R), and quality rate (Q). The relationship between these metrics is defined as follows


where A is the availability rate, P is the performance rate, Q is the quality rate, TU is the uptime of equipment or actual processing time, Td is the downtime, TT is the planned running time or total observation time of equipment, TP is the production time of equipment, Ract is the actual processing speed of equipment, Rth is the theoretical processing speed of equipment, Pg is the amount of the qualified product, Pa is the amount of products produced by equipment during the total observation time, and Pu is the amount of unqualified product.
Availability rate refers to the assessment metric of all losses due to breakdown as well as other factors including any events—of which breakdown is the main form—that can lead to changes in production plan such as damage and replacement of tools, serious faults such as equipment failure and shortage of raw materials, or even some emergencies that can lead to production shutdown.
Performance rate is the ratio of the actual process-cycle to the theoretical process-cycle. Performance rate is a measurement of the degree of equipment performance, including various factors that can lead to a machine operating at capacity below initial settings. These factors include failure of the middle test, temporary stoppage of equipment, inspection, cleaning, and adjustments.
Quality rate represents the ratio of the number of qualified products to total production quantity. The concept of quality rate is an assessment of the effective work of equipment, representing possible losses in productivity caused by a production quality problem, such as the product losses while the machine is running.13,14
From equations (1)–(4), another definition of OEE can be given as follows:
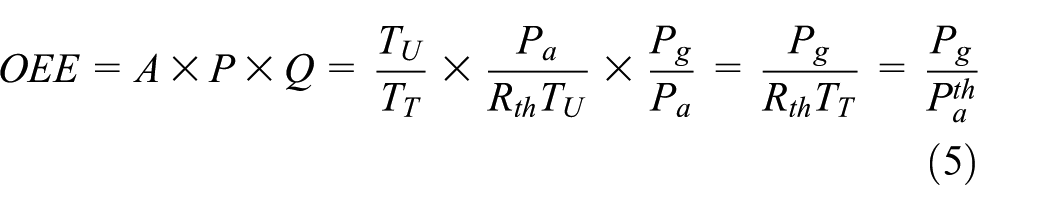
where
Equation (5) delivers the ratio of the actual output to theoretical output for one single equipment, reflecting the qualified output of one equipment.
Obviously, OEE cannot represent global production. Thus, to research overall effectiveness of the entire line, OTE is put forward.
OTE and bottleneck index
OTE has been developed based on OEE and further develops OEE. OTE is the measurement of the relative relationship among equipment in a production system and is used to discuss the operation performance within the system. 12
Using equation (5), the essence of OEE is the ratio of the quantity of qualified output to theoretical output. This concept is applied to the OTE of a production system, which is considered as a separate device in theory. The essence of OTE is therefore the ratio of qualified output (actual output,

OTE derivation of a series system
In a series production system (Figure 2), to derive OTE calculation formula, two important concepts should be introduced.

Series production system.
The theoretical output of the entire production line is determined by the equipment with the lowest processing speed in the production system.
In the case of zero loss, the theoretical output of ith equipment is defined as

The theoretical output,

In production line, the actual output of the system is determined by the equipment with the least qualified output, including the impact on the quality of downstream equipment.
In a series production system, the qualified product output of ith equipment can be derived by transforming equation (5) as follows

In addition, taking into account the influence of nonconforming products produced by upstream equipment on downstream equipment quality, the actual qualified product output,

where Q(j) is the qualified rate of the jth equipment after ith equipment;
Here, the effect of upstream equipment on downstream equipment is taken into consideration, and the resulting equation is given in the form of the product of quality percentage.
In a series system, the minimum output of qualified product is as follows

According to this concept, equation (11) denotes the actual output of the entire production line system.
Substituting equations (8) and (11) into equation (6), the OTE of a series system can be defined as

In a series production system, the
OTE derivation of a parallel system
In a parallel system (Figure 3), actual output and theoretical output are the sum of each component.

Parallel production system.
In the case of zero loss, the theoretical output of the ith component is determined by equation (7), and the theoretical output of this parallel production system is as follows

In parallel production systems, any equipment loss can affect the system output. The actual output of the ith component is determined by equation (9). The actual output of a parallel system can be expressed as follows
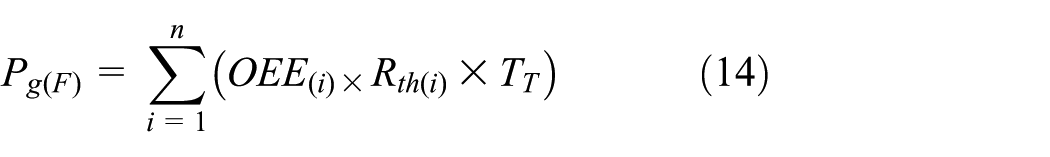
Substituting equations (13) and (14) into equation (6), the OTE calculation formula of a parallel production system can be defined as

Derivation of general production system efficiency
The above derivation is a translation from one single equipment’s OEE to a series production or parallel production system’s OTE, with the OTE calculation formula based on OEE. In actual production systems, a production line or production system generally consists of more than just series or parallel systems, as there are also hybrid systems. As shown in Figure 4, a general production system is composed of n units in series, with each unit consisting of a variety of equipment connected in series, parallel, or hybrid.

General production system.
Beer bottling line production systems can be composed of several units in series. For each unit, the connection between equipment and components is different. Depending on the production line configuration, some units are in series, and some units, such as beer bottling units, could be composed of two machines in parallel to expand production capacity (Figure 5). While there are a variety of connection types for a labeling or stenciling unit, it is most typical to encounter a labeling machine and stenciling machine in series and then parallel (Figure 6).

Unit of filling machines.

Unit of labeling and stenciling machines.
Referring to the derivation process of OEE to OTE, we can complete the derivation of general production system OTE(S). From Figure 4, OTE(i) is the overall effectiveness of unit i, and the entire production line is composed of units in series. Combining with equation (12), the overall effectiveness of a general production system is defined as

where OTE(i) is the overall effectiveness of unit i, Rth(i) is the theoretical processing speed of unit i, and
To get equation (16), OTE(i), Rth(i), and Q(i) of each unit must be obtained. In the previous section, the overall effectiveness of a series system and parallel system was given. The overall effectiveness of hybrid systems also needs to be derived. Under the general assumption regarding the connections between each component equipment in each unit, every unit can be assumed to be a hybrid system as shown in Figure 7. Here, the system is composed of p branches in parallel, with each branch composed of q devices in series. The unit is a parallel system that is composed of p devices when q = 1, and the unit is a series system composed of q devices when p = 1.

Hybrid unit i.
Derivation of overall effectiveness of unit i
Treating this unit as a separate device, the essence of OTE is the ratio of qualified output, meaning actual output,
In a hybrid system (Figure 7), consider a series system and then connect them in parallel. Combining with equations (12) and (15), the qualified production output, Pg(r), of the rth series production line can be defined as follows
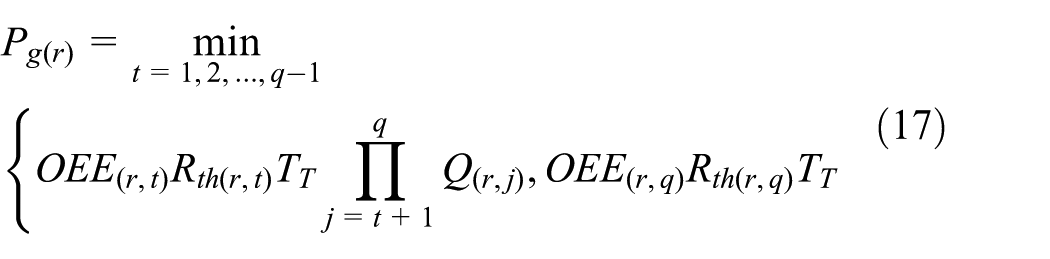
where
The theoretical output,

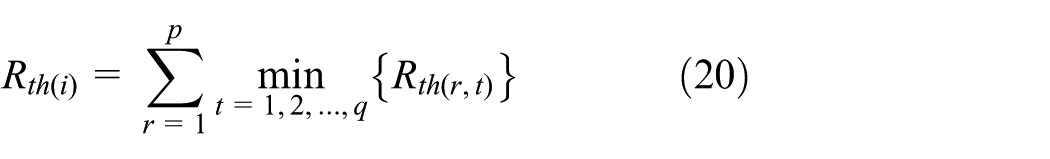
Connecting p production lines in parallel, the overall effectiveness of hybrid system is

The theoretical processing speed of unit i can be defined as
Derivation of three performance metrics of unit i
Regarding unit i as a separate device, the three performance metrics, availability rate A(i), performance rate P(i), and quality rate Q(i), can be discussed further. The calculation formula can be modified with reference to the OEE and three metrics of one single component. In theory, the production cycle of this unit equates to a bottleneck machine production cycle. To determine
The availability rate of a production line or production process equals the availability rate of a bottleneck machine. If there are several bottleneck machines, the availability rate of a production line or production process equals the weighted average of these bottleneck machines. The weight of one machine is directly proportional to its production capacity or theoretical processing speed.
The performance rate of a production line or production process equals the performance rate of a bottleneck machine. If there are several bottleneck machines, the performance rate of a production line or production process equals the weighted average of each bottleneck machine. The operation of all parts in a production line or production process equates the running of a bottleneck machine.
Only when defective or inferior production occurs in or after a bottleneck link, they are regarded as factors that can affect the quality rate. The quality rate of a production line or production process equals the quantity of parts produced by the bottleneck process minus the quantity of quality defects and inferior products produced in or after the bottleneck process, which is then divided by all products produced in the bottleneck process.
In unit i (Figure 7), the bottleneck index of a series system can be used to derive a bottleneck machine, x, in the rth branch, which can lead to the minimum value of
In theory, the availability rate of unit i equals the weighted average of the bottleneck machines in each branch, so the availability rate of unit i can be defined as
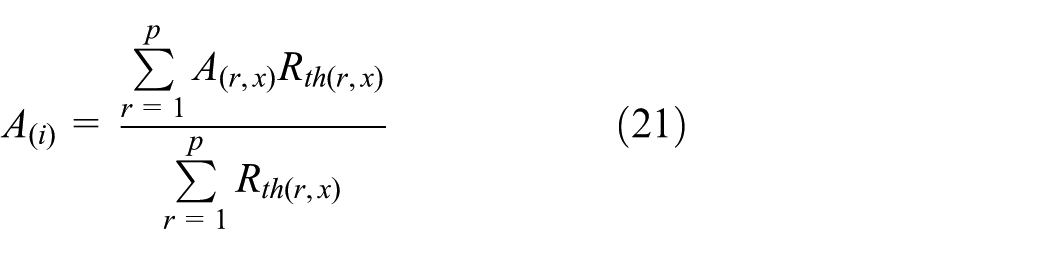
where
In theory, the performance rate of unit i equals the weighted average of the bottleneck machines in each branch. As such, the performance rate of unit i can be defined as
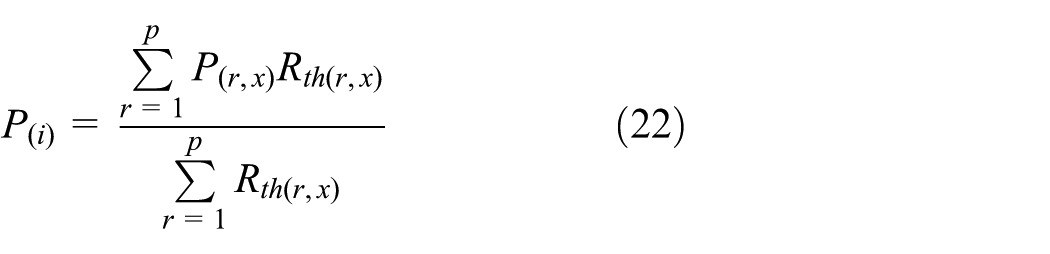
where
The quality rate of unit i is as follows
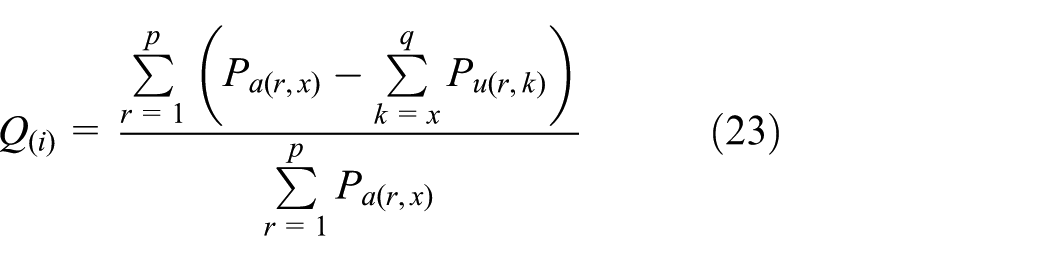
where
Derivation of overall effectiveness of general production system
Incorporating equations (19), (20), and (23) into equation (16), the overall effectiveness of a general production system (OTE(S)) can be obtained.
Derivation of three metrics of general production system
Similarly, with reference to the bottleneck concept of a series system in section “OTE derivation of a series system,” the bottleneck index of entire system is
Through
The availability rate of an entire system is the same as that of the bottleneck unit y, (A(y))

The performance rate of the entire system is the same as the bottleneck unit y, (P(y))

The quality rate is

Statistically, the OEE for one single machine can identify the causes of efficiency loss through three measurements. If the entire production line or production system is treated as one coherent piece of equipment, the bottleneck index and three performance metrics of OTE(S) can reflect the overall efficiency loss from a global perspective. Thus, it is important to enhance the overall effectiveness of the production system.
Application of overall production system effectiveness in a beer filling line
A beer bottling line is composed of the following components: box unloading, bottle washing, beer bottling, beer checking, labeling, packing, and other links. The processing technology of beer filling line is shown in Figure 8.

Processing technology of beer filling.
As for unloading and packing links, since the box types and packing types vary, there are multiple conditions needed to be taken into consideration. The representative process from bottle washing to labeling is selected as the research object, with the process model shown in Figure 9. This process is followed by bottle washing, bottle checking, bottling, capping, sterilization, inspection, labeling, and coding links. This production line is composed of two beer bottling machines set up in parallel, of which the capacity is 36,000 bottles/h, with a theoretical production capacity of up to 72,000 bottles/h. In order to match the production capacity, distribution parallel equipment is adopted in other links of the production lines to improve production capacity.

Model of beer filling production system.
Calculation of the OEE for the bottling machine
For convenient study, every link can be regarded as a single unit. Unit 2 is composed of two bottle-checking machines in parallel; unit 3 represents bottling and capping links composed of bottling machine 1 and capping machine 1 in series, which are then doubled this series line in parallel; unit 5 is composed of two photoelectric detector in parallel; and unit 6 is composed of two branches in parallel, with branch composed of a labeling machine and a printing machine in series. The entire system can be considered as a hybrid system composed of six units. Observation time is set to 1 h, during which the production data and parameters of each device are shown in Table 1.
Production data of devices.

To calculate the value of OEE and three performance metrics of each device, the bottle-washing machine in unit 1, for example, the derivation process of OEE follows the following process. First, the availability rate is calculated by taking the observation time, TT, and downtime, Td, into equation (2), and the availability rate of bottle-washing machine can be obtained as A = 0.9567.
Second, the performance rate is calculated by taking the total production, Pa, rate speed, Rth, observation time, TT, and downtime, Td, into equation (3). In doing so, the performance rate of bottle washing is calculated as P = 0.8644.
Following this, the qualified rate is calculated by taking total production, Pa, and unqualified production, Pu, into equation (4). The qualified rate of bottle washing is thus obtained as Q = 0.9887.
Finally, using equation (1), by multiplying A, P, and Q together, the OEE of the bottle-washing machine is calculated as OEE = 0.8176.
The OEE derivation of other devices is the same as above; the results of each device are shown in Table 2.
OEE results of devices.

Calculation of overall efficiency of beer filling line
Through downtime, total production, unqualified quantity, and other production data, the value of OEE and the three metrics of each piece of equipment are given in Table 2. Next, to obtain the overall efficiency of the entire production system, the OTE and three metrics of every unit are needed.
Unit 1
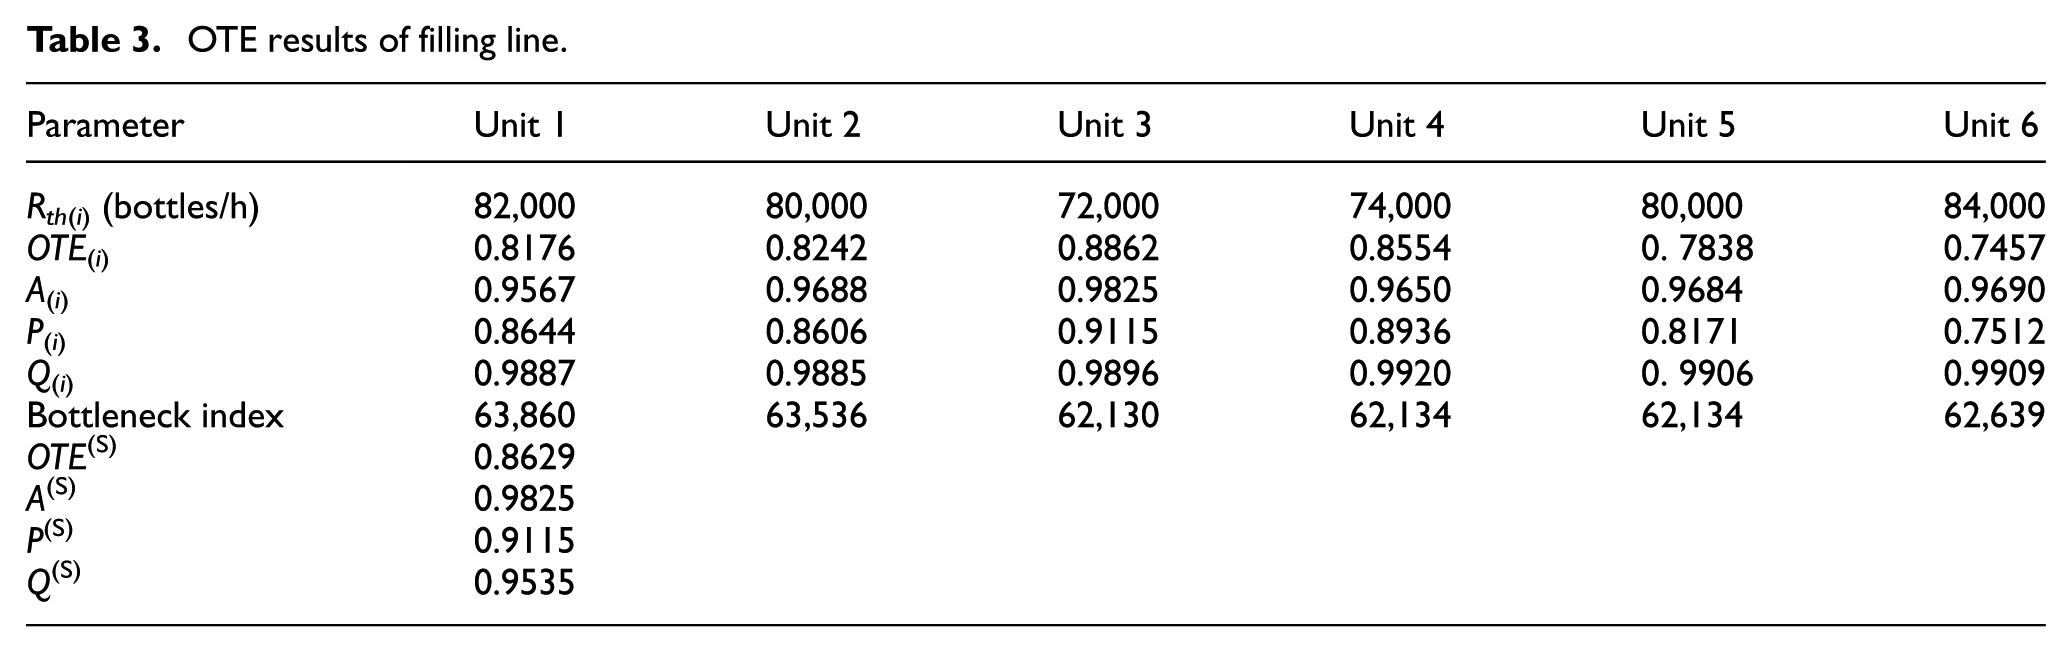
There is only one bottle-washing machine in unit 1, so the OTE(1) = 0.8176, Rth(1) = 82,000 bottles/h, A(1) = 0.9567, P(1) = 0.8644, and Q(1) = 0.9887.
Unit 2
Unit 2 is composed of two bottle-checking machines in parallel. According to equation (15), OTE(2) = 0.8242, Rth(2) = 80,000 bottles/h, A(2) = 0.9688, P(2) = 0.8606, and Q(2) = 0.9885.
Unit 3
Unit 3 is composed of two branches in parallel. The first branch is composed of beer bottling machine 1 and capping machine 1 in series, and second branch is composed of beer bottling machine 2 and capping machine 2 in series. Taking the OEE, theoretical processing speed, and quality rate of these four devices into equation (19), OTE(3) = 0.8862 and Rth(3) = 72,000 bottles/h according to equation (20).
To obtain the desired three performance metrics of unit 3, it is necessary to first identify the bottleneck machine in each branch. In the above section, it has been shown that
Unit 4
There is one sterilization machine in unit 4, giving the calculated values of OTE(4) = 0.8554, Rth(4) = 74,000 bottles/h, A(4) = 0.9650, P(4) = 0.8936, and Q(4) = 0.9920.
Unit 5
Unit 5 is composed of checking machine 1 and checking machine 2 in parallel. According to equation (15), calculation results in OTE(5) = 0.7838, Rth(5) = 80,000 bottles/h, A(5) = 0.9684, P(5) = 0.8171, and Q(5) = 0.9906.
Unit 6
The derivation process is the same as with unit 3, giving OTE(6) = 0.7457, Rth(6) = 84,000 bottles/h, A(6) = 0.9690, P(6) = 0.7512, and Q(6) = 0.9909.
Taking OTE, theoretical processing speed, and qualified rate into equation (16), OTE(S) = 0.8629. According to
OTE results of filling line.
Analysis of efficiency loss of beer filling lines
Through OEE and OTE(S), the bottling device and production line are assessed, analyzed, and diagnosed in this section. Determining the loss of efficiency in the beer bottling line, and targeting the loss to implement improvement measures, the improvements are reflected in evaluation metrics where the efficiency evaluation system of the beer bottling line has been established. Through continuous cyclic improvement, the purpose of improving the utilization and management efficiency of the production line and equipment can be achieved as shown in Figure 10.

Continuous improvement cycle of equipment (production line) efficiency.
Analysis on efficiency loss of filling machines
Equipment efficiency loss analysis based on OEE
The running conditions of the equipment can be calculated by OEE metrics using three different factors: availability rate, performance rate, and qualified rate to quantitatively analyze the running conditions. In order to maximize OEE, the three major metrics must be maximized. Decomposing and refining the three major metrics to find out terminal factors—the fundamental cause of poor equipment—then the six losses that affect equipment efficiency can be obtained. These factors include setup and adjustment time loss, failure and breakdown losses, reduced speed loss, idling and minor stop loss, start-up defect losses, and production defect losses. These six losses are closely bound to the quality and cost of enterprise. These losses are especially significant for small- and medium-sized enterprises, as the losses have a significant impact on them. The relationship of OEE and the six major losses is shown in Figure 11.
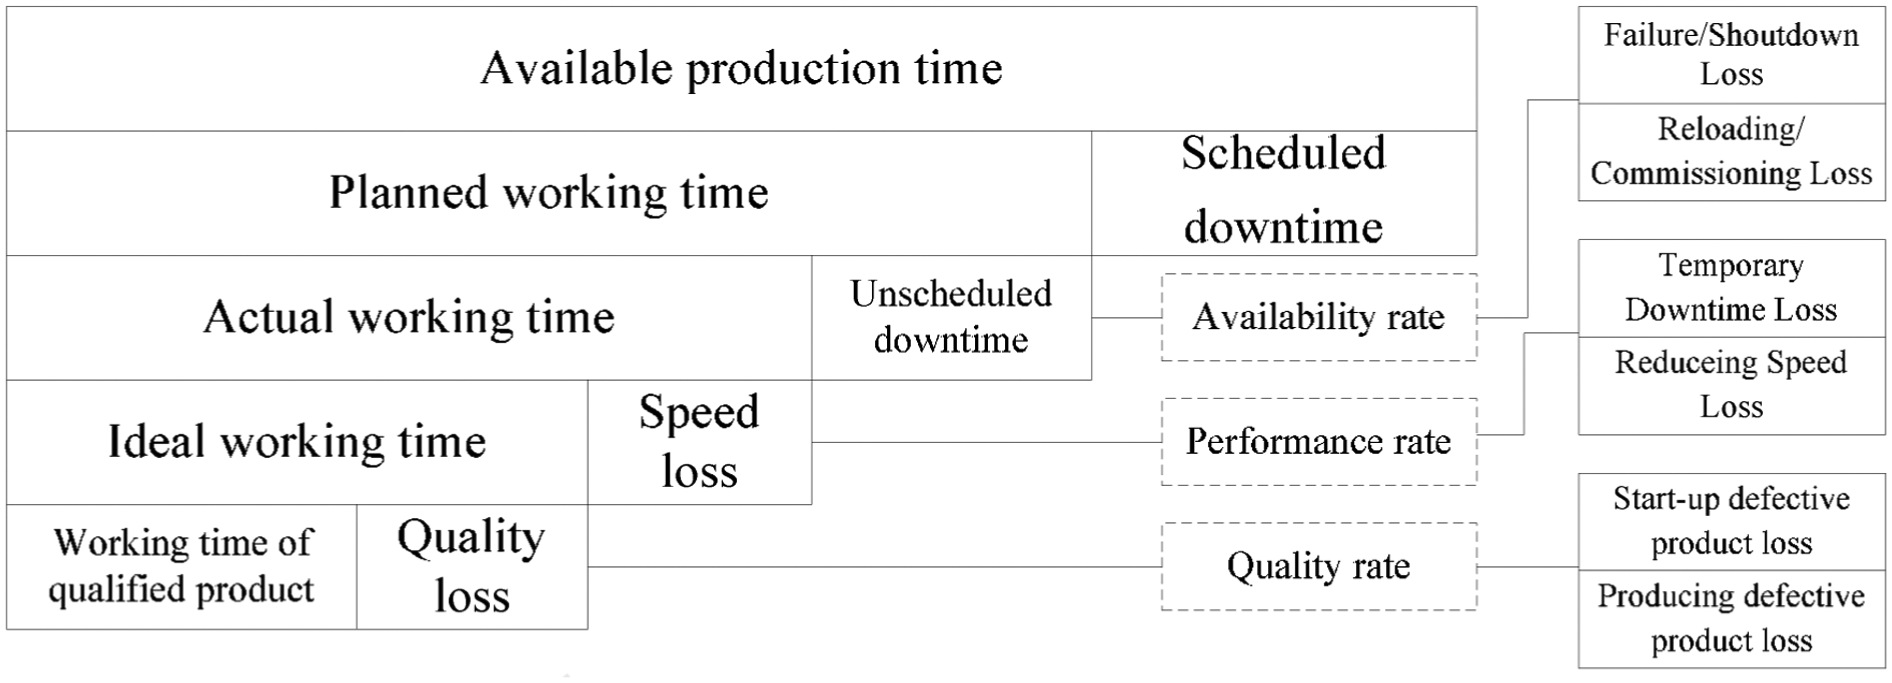
Relationship between OEE and six major losses.
Failure and breakdown losses include two aspects: time loss and quantity loss. Time loss refers to time lost due to equipment failure or breakdown. Quantity loss refers to the decreased production quantity due to defective products. Since the occurrence of equipment failure is usually accidental, staff should always check the equipment and take some preventive measures daily, even to analyze frequent failures to avoid such incidences.
Setup and adjustment losses result from downtime and defective products occurring when the production of one item ends and the equipment is adjusted to meet the requirements of another item. The total setup time is composed of internal setup time and external setup time. The whole setup time can be greatly reduced by decreasing the internal setup time, reducing losses from setup and adjustment.
Idling and minor stop losses occur when production is interrupted by a temporary malfunction or when a machine is idling. There is a strong urgency in this situation, usually 5–10 min, which results in some losses due to cleaning work. Productivity losses caused by idling can be reduced by improving personnel skills and literacy.
Reduced speed loss refers primarily to losses caused by differences between actual speed and design speed. Improving operation level and repairing defective equipment can resolve these factors.
Start-up defect loss refers to loss occurring in the early stage of production from machine start-up to stabilization. Since start-up and stabilization processes will always be present, these losses are not avoidable. However, there is some uncertainty with this kind of loss. Start-up defect loss can be reduced by improving equipment performance and operation levels, and reducing process fluctuation.
Production defect losses and quality defects caused by malfunctioning production equipment require reworking. Some sudden defects can be eliminated by adjusting the device, while chronic defects are difficult to find and are easily ignored or forgotten.
Causal analysis of bottling machine OEE
Combining OEE analysis tools and production characteristics with an actual production situation of a beer bottling line, factors that will affect the availability rate, performance rate, and quality rate can be determined using a fishbone diagram from the perspective of quality. The analysis results are shown in Figures 12–14.

Causal analysis of equipment availability rate.

Causal analysis of equipment performance rate.

Causal analysis of equipment quality rate.
Using these fishbone diagrams, it is determined that the comprehensive and systematic analyses of efficiency loss in the production process and the main factors that affect the OEE are as follows: frequent failures, inadequate maintenance of equipment, and logistics issues. In the equipment management process, maintenance and prevention should be targeted to strengthen.
Analysis of common problems in filling devices
There are many devices in a beer bottling line. The technological process is complicated resulting in many problems in the bottling process. Based on the investigation of the production line in a packaging workshop, the analysis and elimination of common problems in the main equipment are summarized in Table 4.
Common issues in bottling line equipment.

Analysis of efficiency loss on the entire bottling line
Analysis on efficiency loss factors based on OTE(S)
Analyzing the overall equipment efficiency OEE and three performance metrics provide reasons for efficiency loss reasons in the beer bottling line. The OTE(S) and its performance metrics are from a global perspective for measuring and evaluating the enterprise line. The corresponding relationships between the influence factors and performance metrics are shown in Table 5.
Analysis on efficiency loss of beer filling line.

Analysis of efficiency loss on the entire line based on theory of constraint
The core idea of theory of constraint (TOC) is that although each system has one or more constraint links, the performance of the entire system is determined by the weakest link. The specific performance is as follows:
The loss of the entire system is determined by the loss of the bottleneck resources, for example, the resources loss of the bottleneck in an hour is the loss of the entire system in an hour;
The utilization of non-bottlenecked resources is determined by bottlenecked resources;
The capacity of the system cannot be improved by saving non-bottlenecked resources;
The output of the entire system is determined by the bottlenecked resources.
In the previous section, the OTE(S) was calculated, and the bottleneck indexes are put forward to identify the bottlenecked unit that could affect the output of the system. The performance of the entire line is reflected in three performance indexes. Such evaluation indexes fully reflect the core idea of the TOCs that the entire line efficiency loss is determined by the efficiency loss of the bottlenecked unit. Therefore, the bottlenecked unit will be the focus for entire line efficiency loss analysis. 15 Combining TOC with OTE(S), the application of this theory to the entire beer bottling line loss analysis process is as follows:
Identify the bottlenecked unit of the beer bottling line system;
Analyze the efficiency loss of the bottlenecked unit;
Determine how to maximize the use of bottlenecked resources;
Mobilize other resources in the system to support the above decisions;
Take necessary measures to optimize the bottlenecked resources;
If the bottlenecked resources are eliminated, return to the first step and continue to identify bottlenecks in the system.
Specific steps are shown in Figure 15.

Analysis method of efficiency loss based on TOC.
Suggestions for improving beer bottling line efficiency
After identifying the factors that affect the overall effectiveness, specific measures can be implemented as follows.
Equipment techniques
Sum the deficiencies of the equipment performance in the production process and optimize the equipment structure design, including the bottle-conveying chain and other connection facilities, as well as technique design, including Clean-in-Place (CIP) cleaning techniques. Timely improvement reduces the failure rate and increases equipment reliability. The quality rate of all equipment on one production line is shown in Figure 16. Figure 16 shows that the quality rate of the bottle-washing machine is lower than other devices. Bottle washing is an important link in the beer bottling line and lies upstream from the filling process providing the packaging material for beer filling. The quality of bottle washing is directly related to the quality of the beer as well as entire line productivity. As such, bottle source management must be strengthened, starting with improving bottle-washing techniques including replacing the bottle-box mouth, properly reducing water pressure, modifying bottle falling methods, increasing steam pressure, regularly cleaning water scale, dredging the spray system, adjusting alkali concentration according to bottle quality, overhauling or replacing parts to ensure that the seal is intact, cleaning the filter in front of the pump, and replacing the impeller.
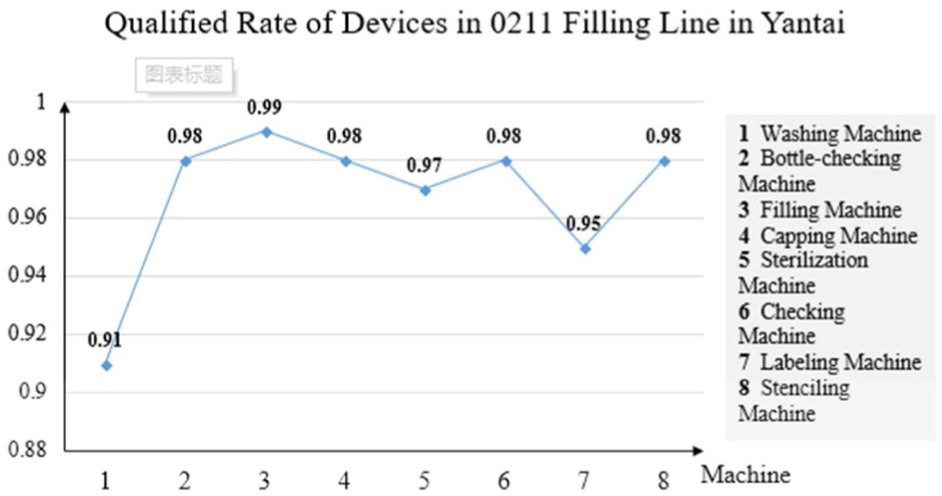
Qualified rate of filling equipment.
Maintenance system
Collection and analysis of data from equipment failures set up a resource for abnormalities. Through ranking and analysis of abnormal equipment, the mangers can make pre-judgments on equipment failure, establish a maintenance system for each component of the beer bottling line, clear maintenance tasks, relevant operation staffs, maintenance time, take preventive measures to reduce the occurrence of failures, make relevant technical management measures, conduct regular inspections and maintenance for the devices that are often problematic, and implement total productive maintenance (TPM). Table 6 provides the list of the top five reasons that lead to equipment failure on the Yantai beer production line in one day.
Common issues list of filling machine.

From the table, the self-fault of filling machine is the biggest factor that causes the overall efficiency to lower. It can begin with equipment maintenance to checking and excluding failure causes. Specifically, spot checking the system can be implemented for a filling machine by following the requirements of “eight-fixation”:
Fixed people: assign spot check staff for the filling machine, and clear personnel responsibilities;
Fixed point: determine the location, project, and content to check;
Quantitative: quantitatively measure deterioration tendency of failures;
Fixed period: set a spot-checking cycle according to failure frequency;
Fixed standards: target each spot check location to make judgment standards in order to analyze whether that component works normally.
Fixed checking schedule: make a standard checking schedule with detailed regulations with relevant personnel, spot-checking time, content, date, and location given in this schedule, using the recorded spot check results in abnormal situations.
Fixed record: include work records, anomaly records, and failure records formed into a fixed format.
Fixed spot-checking business process: determine the standards for all spot-checking work according to the possible result of the spot checking to pre-rank the issues priority, leaving non-emergency issues for a maintenance plan, and gradually achieve the purpose of predictive maintenance.
Balance production
Minor stop problems such as material shortage and material waiting increase the performance loss of a beer bottling line. Therefore, it is necessary to ensure continuity throughout the entire beer bottling line and reduce the stand-by time so as to ensure the balance of the production system. For example, set up the appropriate Working-in-Process (WIP) inventory before key and bottleneck processes, strengthen the overall awareness of operators, and enhance the proficiency of setting the filling equipment. Other methods include taking note of abnormal situations in upstream or downstream equipment to reject fallen or broken bottles, and adjust the device speed to adapt to the production cycle so as to ensure the entire line remains balanced, orderly, and operates efficiently.
Eliminate bottlenecks
Using the deduction method, identify the bottleneck. The bottlenecking unit is always present with dynamic variability. In order to improve bottling line efficiency, it is important to continue excavating the bottleneck and improve it. The bottleneck analysis results of all equipment in the Yantai beer bottling line are shown in Figure 17.

Bottleneck indexes of all devices in one production line.
Figure 17 shows that the bottleneck index of the filling machine is the lowest, making the filling machine the bottlenecking unit. Through analysis of the OEE, the availability rate, performance rate, and quality rate of the filling machine in Figure 18, the availability rate is lower, which means the equipment failure rate is high, and adjustment time and preparation time are too long. Although the OEE of filling machine is high, the factor that leads to low bottleneck index is that the production capacity is lower compared to other devices. Therefore, the filling machine capacity can be improved by optimizing the techniques and structure of the filling machine.

Trend analysis of OEE metrics.
Optimize layout
Logistics should be given more attention while optimizing techniques. By optimizing the factory layout using analysis of orientation and improving logistics allows for a balanced and smooth operation. Ensure information flows smoothly between the upstream and downstream components. Design a reasonable bottle buffer where stoppage data and failure loss can be summarized on the basis of design and optimization of the buffer area. Table 7 presents a list of the top five abnormal situations among all the equipment in the Yantai beer production line.
Ranking table of abnormal situations of one beer production line in Yantai.

The information in Table 7 shows that lack of bottles or blocking bottles in downstream or upstream components is a serious issue. The filling machine is the most critical machine in filling line and is the bottlenecking unit of production capacity. As such, efficient and continuous operation of the filling machine will maximize the production line capacity. Bottle blockages in the filling machine exit means that the buffer area between the filling machine and downstream equipment is insufficient, leading to the inability for output to be stored in time when downstream equipment fails. Similarly, a lack of bottles in upstream components indicates that the transport system between the filling machine and upstream equipment is unreasonable. Increasing conveyor chain buffers, planning buffer size and other measures reasonably, can ensure smooth transitions between upstream and downstream equipment.
Personnel management
Poor personnel management influences availability rate, performance rate, and quality rate. Improving the operation training system is an effective way to optimize personnel management. This can be rectified by reasonably arranging training time and updating the training content in a timely manner. As for personnel skill training, more attention needs to be given to motion studies and parallel analysis. In addition, emphasis should be placed on standardization of the operation process, allocating human resources reasonably, strengthening awareness of spot checking, and reducing batch maintenance frequency. Equipment maintenance personnel and technical personnel need to keep an eye on equipment dynamics and failure risks should be solved quickly. Sabotage should be eliminated, making full use of meeting time to thoroughly educate and improve quality awareness among workers.
Department coordination
Strengthening the coordination between the quality supervisor and the production supervisor to reach a consensus among departments as well as attempting to shorten adjustment and preparation time could influence the availability rate and line work. For example, start-up detection, technique detection, and model-exchanging detection should be shortened or staggered to avoid idling due to waiting, in order to improve the availability rate of equipment, increasing entire line efficiency. However, the problem of poor execution of the production plan can be improved through increasing communication frequency. For example, having the heads of the sales department, production department, filling department, purchasing department, and inventory department participate in a weekly meeting; provide a weekly plan; discuss and coordinate the production plan; and promote coordination and convergence between various departments through communication.
Conclusion and future work
This article focused on the study of the application of the OEE method in efficiency evaluation for a beer bottle filling production line, focusing on the following issues:
Deduction and derivation the OEE, OTE, and OTE(S) methods of a general production system.
Calculate the OEE of filling machines and OTE of a filling system combined with real production case studies.
Conduct a causal analysis of equipment efficiency loss using a fishbone diagram based on OEE and give metrics to the causes of problems. Establish a cycle efficiency loss analysis model for the entire line by combining OTE with TOC.
Summarize the common problems in filling production and provide improvement measures.
The OEE assessment analysis found that the OEE figure of each machine is less than 0.9, and the stenciling machine is 0.7275, which contributes to the minimum value for the filling system. From the indexes, the exact equipment that needs to be improved was identified. The OTE computation of each unit in the filling system showed that the unit furthest downstream brings the minimum value to 0.7457. However, the OEE and OTE figures only reflect the utilization of the individual equipment of unit. Considering production capacity, unit 3, whose output was the lowest, is the bottleneck link of the system and should be the key link to improve production line efficiency. OEE has better practicality in terms of equipment production efficiency evaluation. Using the OEE method allows for measurement of equipment utilization and is helpful for equipment efficiency loss analysis and efficiency improvement.
As for future research in this area, a modeling and simulation method may be developed on the basis of OTE to facilitate new factory design. Furthermore, OTE method can be considered into the construction of intelligent factories, by implementing OEE and OTE into a software tool to automate single equipment and entire factory performance analysis and diagnostics process.
Footnotes
Acknowledgements
F.H. studied the algorithm of OEE/OTE and wrote the paper; K.S. performed the case study and the numerical computations, and wrote the paper; L.L. analyzed the causes of efficiency losses and proofread the paper; and Y.T. had surveyed of the practical production and given the improvement suggestions for production bottleneck.
Handling Editor: Shun-Peng Zhu
Declaration of conflicting interests
The author(s) declared no potential conflicts of interest with respect to the research, authorship, and/or publication of this article.
Funding
The author(s) disclosed receipt of the following financial support for the research, authorship, and/or publication of this article: This work was financially supported by the National Natural Science Foundation of China (51575280) and the Fundamental Research Funds for the Central Universities (30917011303), and the Priority Academic Program Development of Jiangsu Higher Education Institutions (PAPD).