
Abstract
The applicability potential of correlation methods (damage correlation indexes) based on frequency domains in the impact damage detection fields of reinforced concrete columns were examined in the present study. In the current study’s experiments, four reinforced concrete bridge pier members of reduced scale were impacted by a new type of ultra-high drop hammer experiment system in order to simulate the processes of medium-sized trucks impacting bridge piers. The frequency response functions of the members before and after damages occurred were measured using an acceleration acquisition system. The experimental results revealed that the damage correlation indexes (DCI) taken into account the multi-order modal frequencies could be used to accurately identify the degrees of damage to the piers. In addition, an impact finite element model and a modal analysis method were matched with the experiments and were established using the commercial program LS-DYNA. Finally, the setting of the finite element parameters matching the experimental results was applied for the purpose of simulating the impact processes between the medium-sized trucks and the reinforced concrete piers. In order to meet the structural design requirements, a peak impact force (PIF) formula under vehicle impact conditions was proposed based on the damage indexes.
Keywords
Introduction
The gradual acceleration of the urbanization process had led to rapid growth in the number of vehicles and traffic facilities in the region. Consequently, collisions between vehicles and bridge piers have become the main threat to the safety of urban overpasses. In recent years, researchers have conducted many statistical studies regarding major accidents caused by bridge collapses since the 21st century, among which the accidents involving ships or vehicles impacting bridges were determined to account for approximately 20%. 1 In such cases, applications of structural health detection technology are of particular importance. Damage assessments and repair processes require huge economic investment, which may cause difficulties to the implementation of the necessary actions. In fact, the progress which has been made sensor and computer technology has provided improved solution choices for damage assessments. Among the newly introduced technologies, vibration based monitoring methods enable engineers to collect data in real time, allowing structures to be evaluated in real time by comparing the parameters of the original structure with those of the damage state. 2 The most commonly used data include natural frequencies 3 , modal shapes 4 , mass values 5 , stiffness values 6 , damping matrixes 7 , and frequency response functions (FRFs). 8
In order to solve the impact problems, various countries have actively put forward corresponding design codes. The most representative code is the proposed AASHTO LRFD, 9 which takes the equivalent static force of 2670 KN as the design value of bridge piers at a distance of 1500 mm from the road edge. The initial rough finite element model established by Chen et al. 10 was used to evaluate its reasonability, and the results showed that the values taken in the aforementioned code were too conservative in some cases. Consequently, the finite element model proposed by Abdelkarim and ElGawady 11 was used to verify the above-mentioned values and compare them with those obtained using a 25 ms average peak force method and the equivalent static force calculation method (equation (1)) proposed by Euro-code. 12 The results indicated that it was more reasonable to use the average force of the 25 ms peak force proposed by Buth et al. 13 as the equivalent static force for structural designs:

where m is the mass of the vehicle; Vr denotes the velocity of the vehicle; δc represents the distance variable between the vehicle head and the center of mass; and δD is the transverse deformation of the column at the impact point. Buth et al. 14 used a 36t tractor-semitrailer to carry out transverse impact experiments on a full-scale rigid pier model. The model visually showed the vehicle head crushing, cargo-pier impact, and other mechanical behaviors of the bridge pier. Chen et al. 15 constructed an anti-collision guardrail composed of five short columns, and utilized a Dongfeng-EQ140 medium-sized truck to carry out transverse impact experiments. The impact force, deflection, and other parameters were recorded during the experimental processes. Then, based on the acquired experimental data, a simplified finite element guardrail model was proposed. Cai et al. 16 carried out impact experiments on 15 square scale columns using a transverse impact experimental device. The influencing effects of the slenderness ratios on the impact energy, peak impact force, and member deformations were the main focus in the aforementioned study. In another related study, Zhou et al. 17 explored the dynamic responses of concrete pier members under cumulative impact conditions using an ultra-high drop-hammer experimental system. The results showed that with the increases in the damage degrees, the internal energy dissipation capacities of the structures had gradually decreased, and a damage judgment method based on the changes in modal frequency was proposed. There is no doubt that previously conducted impact experiments have greatly promoted the development of numerical simulations in this field. Adhikary et al. 18 carried out weight reduction experiments on reinforced concrete beams and established a detailed finite element model to analyze the impact mass ratios, longitudinal reinforcement ratios, concrete compressive strength, and other parameters in detail. In addition, since the dynamic behaviors of beams are more easily observed during impact processes, Pham and Hao 19 established a simplified mechanical model and a numerical model of reinforced concrete beams; proposed a method to deduce shear and bending moment diagrams; and confirmed the assumption of the linear inertial force distributions along beams. Also, Chen et al. 20 developed an equivalent impact frame for the purpose of simulating the impact effects of large trucks and reinforced concrete columns. Then, by comparing the deformations and internal energy relationships between frames and actual trucks, the equivalence values between the frames and actual trucks were realized. Finally, an appropriate finite element simulation was established in order to verify the overall similarities between them. Sharma et al. 21 developed finite element pier models under different vehicle impact conditions and proposed the concept of performance-based design for impact problems. In addition, the damages under different states were successfully classified, and a set of program frameworks was established in order to estimate the capacities and demands of dynamic shear force in RC columns. However, the classification of bridge pier safety grades based on performance design criteria is too vague, and there is no reasonable and reliable quantitative index.
In the study, a high-applicability calculation method for damage evaluation indexes and impact forces was proposed. In this study’s experiments, simplified impact tests using trucks were carried out on circular section piers with a reduced scale. The dynamic responses of the RC columns during impact and the modal frequency changes after damages to the members were measured. Then, in accordance with the experimental results, a detailed finite element model was established, and LS-DYNA software 22 was used to verify the experimental results. A finite element model of a full-scale pier under impact conditions was also developed. The results of this study’s numerical simulations revealed the relationships between the peak impact force (PIF) and the damage degrees. Then, an equivalent static force calculation formula of vehicle impacts in a short period of time was established with the damage of the bridge pier considered, which could potentially provide valuable references for future structural designs. The research methods involved in this article are shown in Figure 1.

Technical route diagram of the experiments.
Damage assessment methods based on frequency domains
The basis of the vibration-based impact damage assessment method relies on the change of dynamic response caused by the existence of damage. This phenomenon makes it possible to identify the existence of damage from the change of dynamic response. In this section, two types of damage indicators are introduced. The one is the Modal Assurance Criterion (MAC) 23 and the Coordinate Modal Assurance Criterion (CoMAC). 24 This indicator is used to express the deviation of the mode shape before and after the damage of the reinforced concrete structure. The difference is because MAC only considers the deviation of the first-order mode shape, COMAC considers the deviation of the multi-order mode shape. The second is the damage correlation coefficient (DCI), which can reflect the difference of multi-mode frequencies before and after structural damage. In this research, CoMAC is considered as a traditional damage assessment index, and the damage index DCI proposed for impact damage is the object to be verified.
MAC and CoMAC
The MAC is a dimensionless scalar constant, which represents the degree of correlation between the modal vector and another reference modal vector, as shown in equation (2). In the equation, ΨAi represents the i-order modal vector from State A. The co-ordinate modal assurance criterion (COMAC) 24 is an extension of the modal assurance criterion (MAC), and its correlation is modal related. As shown in equation (3), ΨAij is the j-order mode shape at point i in State A:


Damage correlation index (DCI)
In this study, the damage degrees were evaluated by the differences or similarities between the original modal frequency and the damage modal frequency. The quantitative value was used to evaluate the differences between the two samples. The sample Pearson Correlation Coefficient (PCC)
25
in the form of a covariance was applicable to the problem. As shown in equation (4), A and B, respectively, represent the two states of health and damaged,


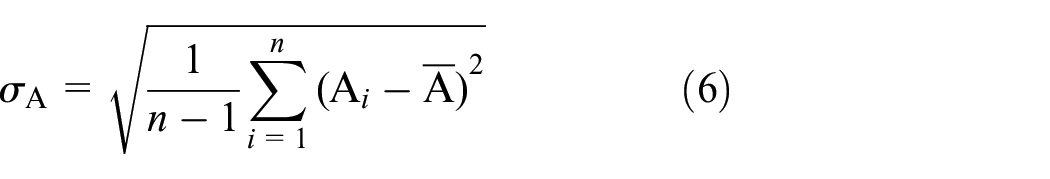
For real numbers with PCC value of [−1,1], 1 represents the linear correlation; 0 represents the complete correlation; and −1 represents the reverse or indirect correlation between the data sets compared. However, such cases do not appear in this study since they represent the reverse correlation of the frequency. Therefore, assuming that PCC is bounded in the range of [0, 1], the damage correlation coefficient DCI could be calculated. It was not difficult to determine that the value of DCI was 0 when the column was undamaged and 1 when the correlation was completely lost:

Experimental processes and analysis results
This object is to study the impact of the effective loss characteristic index, were divided into two steps, first by a lateral member percussive impact system, and then the member after injury vibration test, measured modal parameters. For this study, four circular cross-section 1:3 scaled bridge pier components are designed. The specific dimensions of the bridge pier model are given in Section “Vehicle-bridge impact model,” and the test model is scaled based on the
Experimental processes
Preparation of the damaged components
The detailed specimens are shown in Figure 2. Each specimen consisted of a 900 × 300 × 400 mm3 RC base and a circular RC column with a section radius of 170 mm and a height of 2200 mm. All of the specimens were cast using concrete with a cube compressive strength of 42 MPa.

Specimen dimensions and detailed.
The impact testing instrument was a super-high heavy-duty drop-hammer experimental testing machine system, which was composed of a vertical drop-hammer driving system and a horizontal impact system (Figure 3). As shown in Figure 3(a), the kinetic energy of the horizontal impact test vehicle was provided by the vertical drop-hammer driving system. The conversion relationship is shown in equation (8), where


Impact testing system: (a) experimental test 2D view, (b) horizontal impact system, and (c) FE model of the RC column with the steel impactor.
Information of the components.

The axial compression ratio is calculated by
Vibration tests
This study’s modal tests were carried out on the damaged components after impact. Uninstall axial load in order to ensure the axial force is not involved in the test, and the upper portion of the column is maintained free vibration. Vibration testing system shown in Figure 4(a) and (b), 10 accelerometers were distributed in the direction of impact specimen back (Figure 4) to ensure that the measured third-order modes. Externally stimulated the front of the impact until the column frequency measurement results are stable. Wherein the accelerometers was used to measure the vibration characteristics of the pier during excitation, then the data transmitted to the data logger, the last time domain signal was collected by the computer and obtain a frequency domain data by Fast Fourier Transform. Figure 4(c) shows the acceleration time-domain data collected by the damaged column C1. It is not difficult to observe that the frequency of each order of the damaged column decreases, especially at the higher order frequencies. The appropriate number of accelerometers to ensure the accuracy of the experiment.

Modal testing system: (a) analytic flowcharts, (b) experimental facility, and (c) comparison of frequency response plots of post-impact and original RC piers.
Stiffness measurements
It is necessary to measure the change in the overall stiffness of the column, but the shear stiffness and bending stiffness cannot be made in detail to distinguish during the experiment, the stiffness variation will be described using the overall stiffness of the column in this study. Following impact, the axial pressure was unloaded in order to ensure that the upper rigid plate was no longer in contact with the column. Equal increment transverse force (100 kn, 200 kn, and 300 kn) was applied to the top of the column using the reaction wall. The magnitude of the force was recorded by a dynamometer, and the displacement changes were recorded using a displacement meter installed on the top of the column, as shown in Figure 5, in which


Stiffness measurement system.
Experimental results and analysis
Modal experiments
Figure 6 and Table 2 detail this study’s comparison of the results of the experimental identifications of the natural frequencies. It was found that the cumulative impacts resulted in decreased stiffness of the sections where cracking occurred. The decreases in the natural frequencies caused by the development of cracks were not monotonic. 26 When the damage was small, the change of the first-order frequency was not sensitive, and the degree of damage cannot be characterized. The DCI calculation results showed that this index was extremely sensitive to damage due to the consideration of multi-order modal frequencies. The DCI will increase as the degree of damage increases, contrary to the development trend of CoMAC. Compared to using only the first-order modal frequency, it is more reasonable to use DCI as an evaluation indicator.

Modal frequencies of the components: (a) modal frequencies (undamaged) and (b) modal frequencies (damaged).
Modal test results.
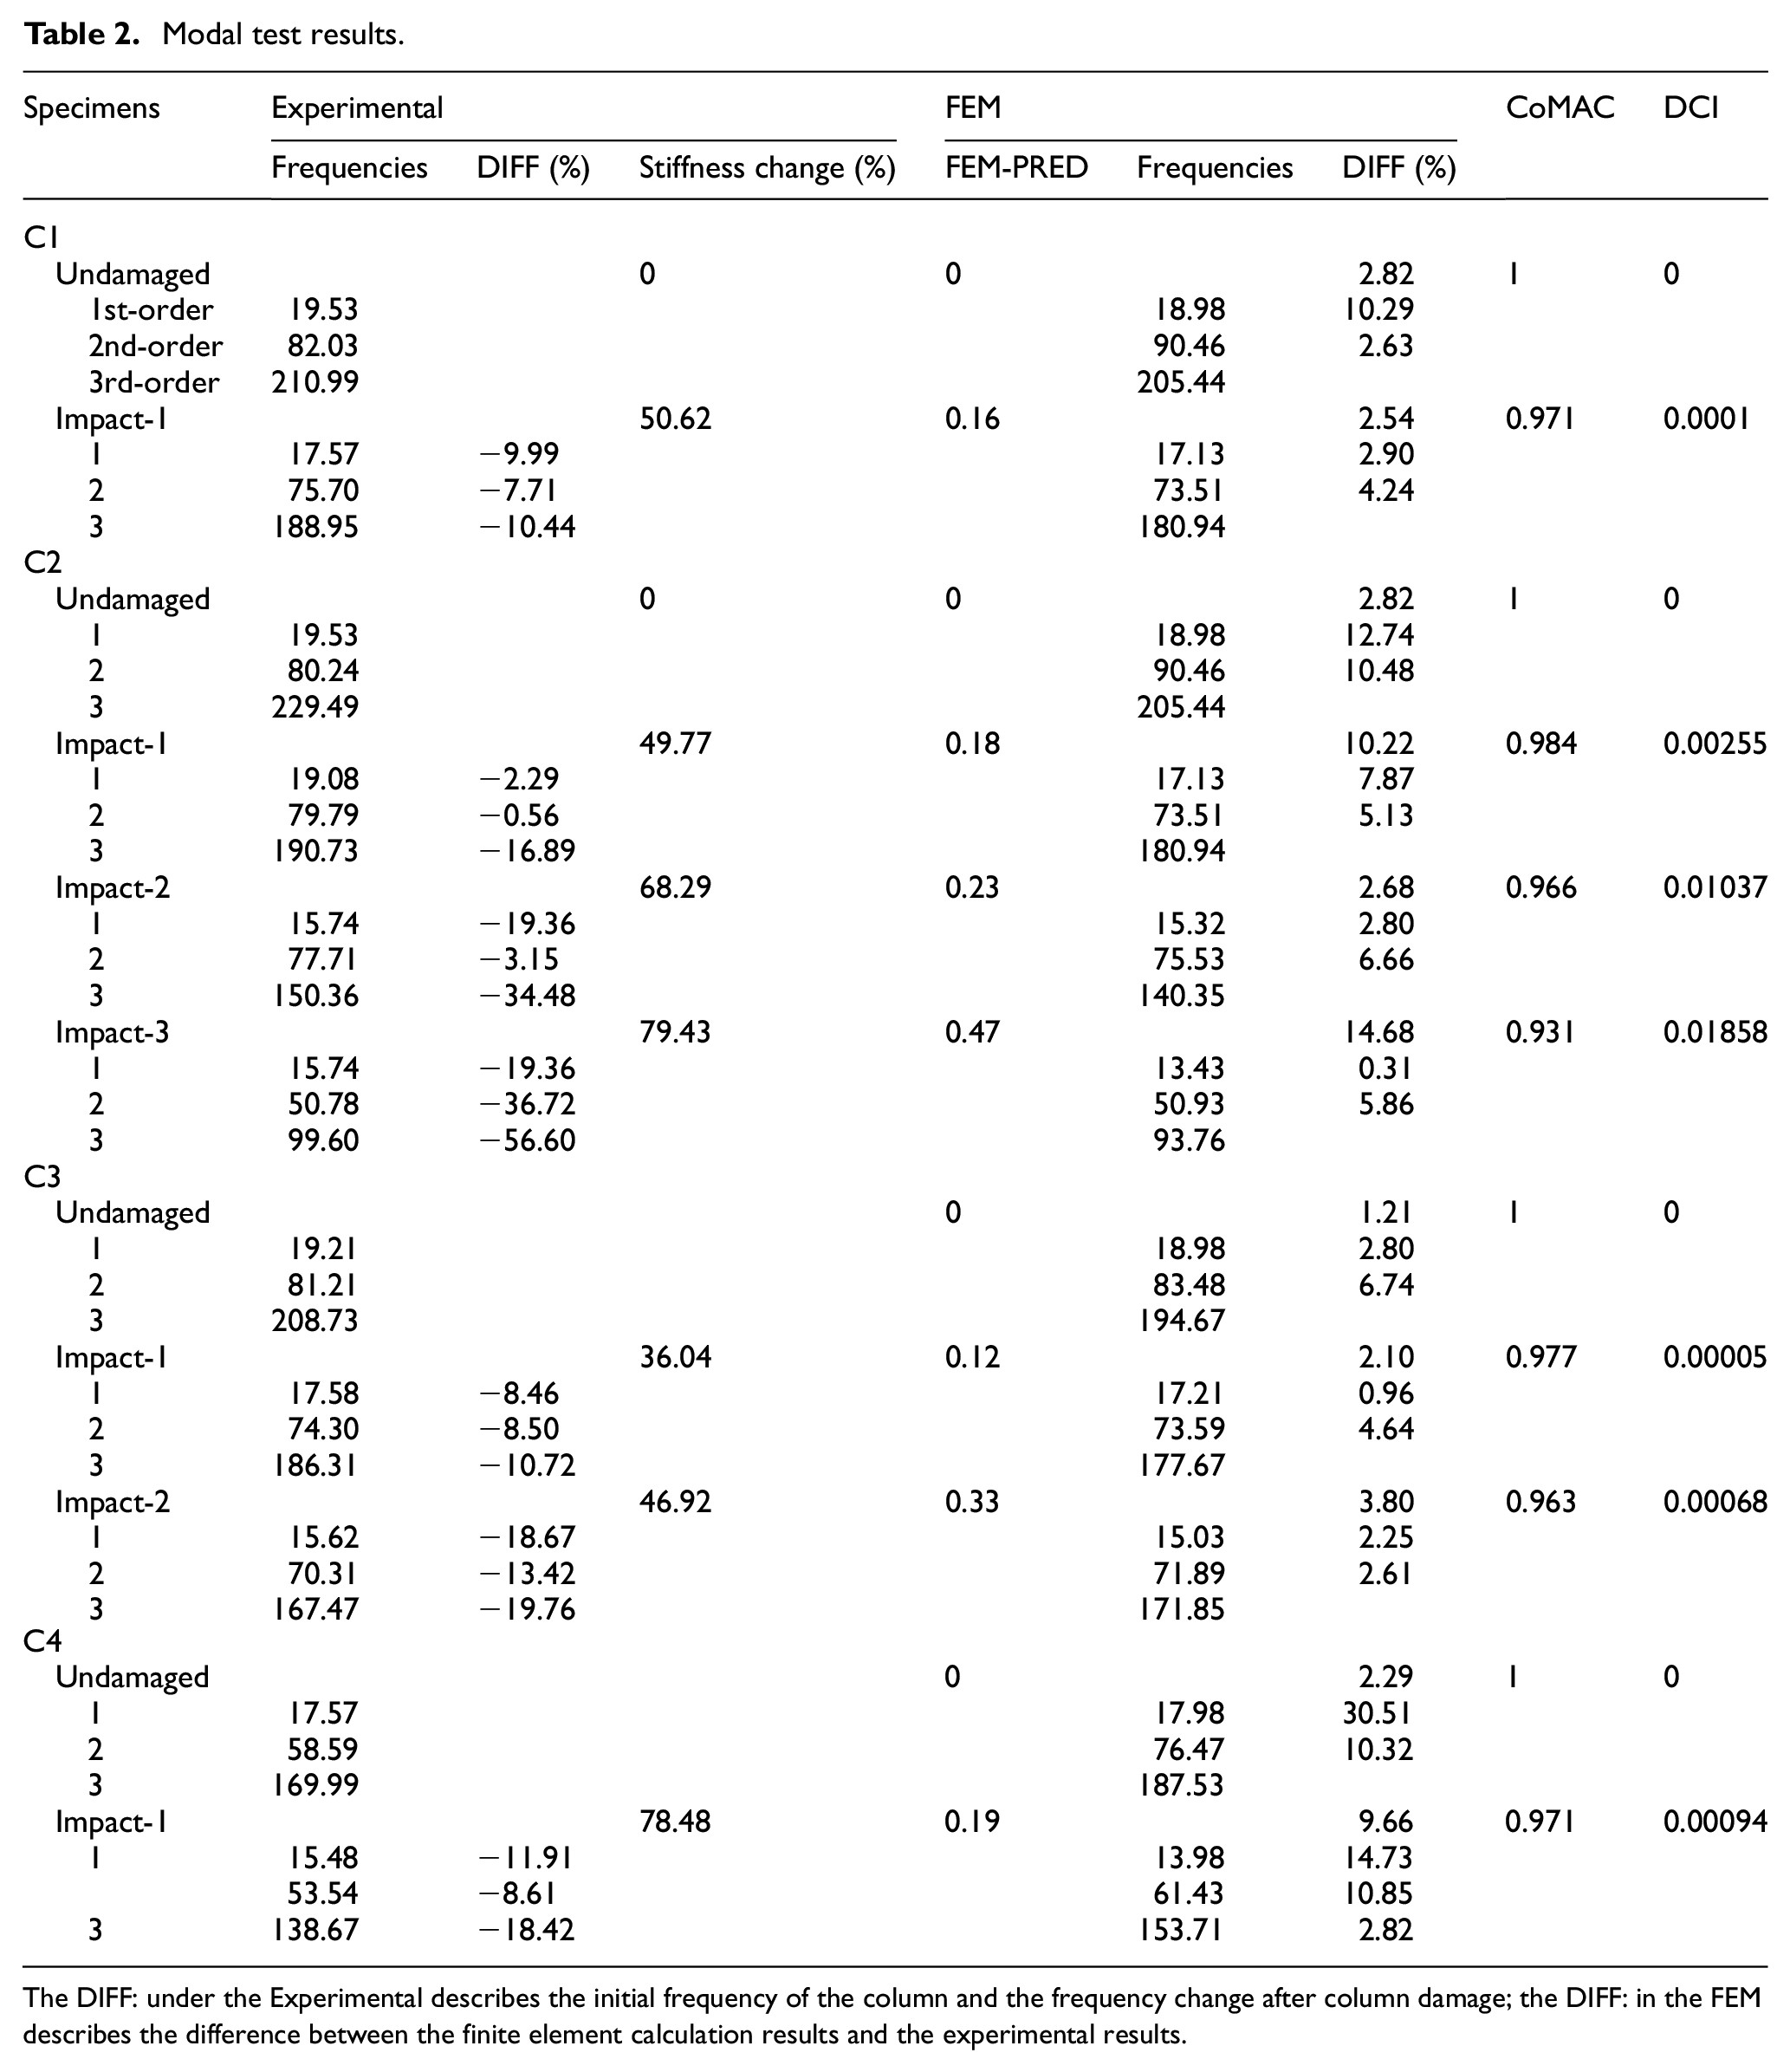
The DIFF: under the Experimental describes the initial frequency of the column and the frequency change after column damage; the DIFF: in the FEM describes the difference between the finite element calculation results and the experimental results.
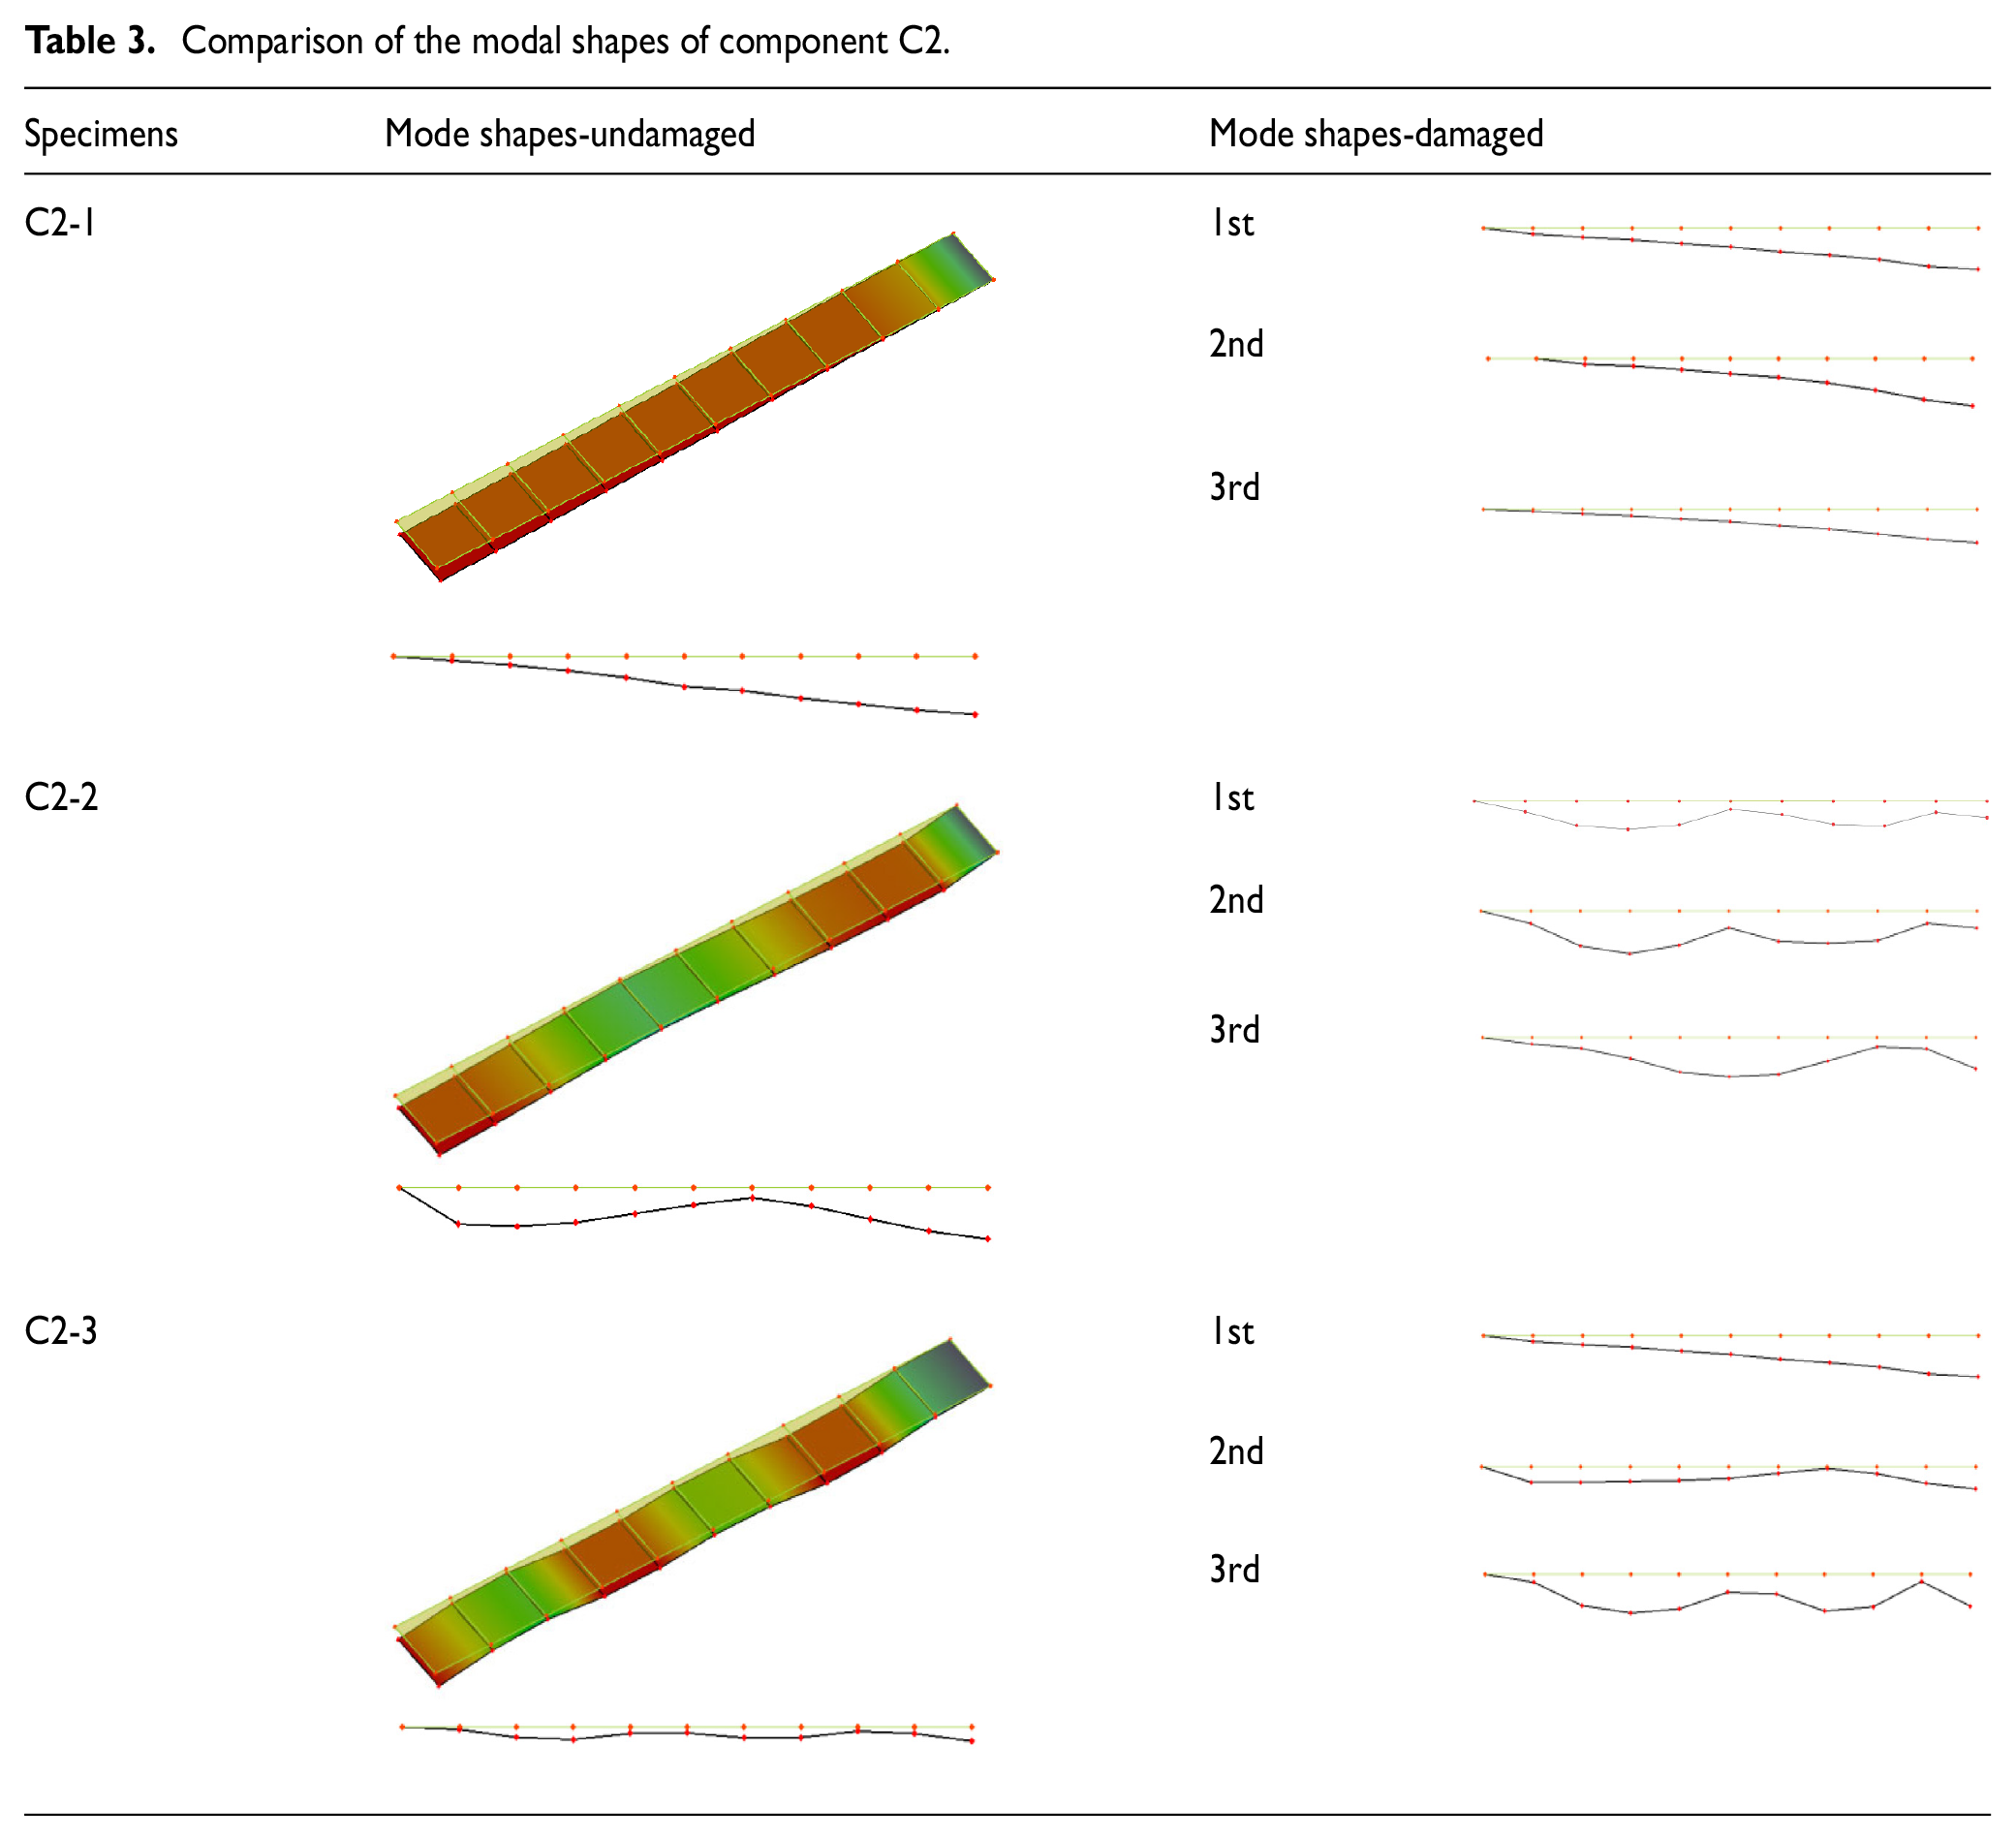
Similarly, the changes in the modal shapes could not be ignored. Table 3 shows the modal shape measurement results of Component C2 before and after impact. The first-order mode shape was not sensitive to the changes in the damage degrees. However, by observing the change processes of the second-order and third-order mode shapes, it could be preliminarily judged that the damage locations. The cracks were dense at this location, which proves the effectiveness of the method.
Comparison of the modal shapes of component C2.
Impact experiments
Figure 7 shows the relationships between the time history changes and the damage degrees of the three impact forces of component C2. As the degree of column damage increases, the column DCI increases and the peak impact force (PIF) decreases. The smaller losses in the stiffness values were found to have little effect on the peak impact force. However, the pier responses were noticeably weakened after two impacts. The lack of column stiffness resulted in the weakening of the responses.

Comparison of the impact force time history and DCI changes of Component C2.
Stiffness verification
The changes in the values of the stiffness of the components before and after impact were obtained using the method described in Section “Stiffness measurement.”Table 4 details the statistics of the change rates of the stiffness values of all the components.
Changes in the stiffness.

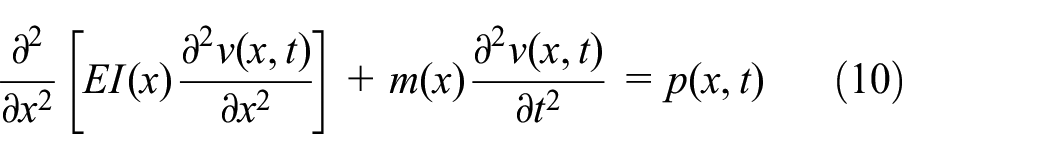
The decreases in the overall structural stiffness caused by the impacts resulted in changes in a series of natural frequencies. The development of this problem mainly originated from the characteristic value problem of the system vibration equation. Therefore, motion equation (10) of the undamped mechanical system was applied. The first third order frequency approximation of the experimental model was solved using the Rayleigh Method 27 and the accuracy of the experimental data was successfully verified. Therefore, in accordance with the principle of energy conservation, in which the strain energy at the maximum displacement time is equal to the initial kinetic energy, equation (11) was established:

The strain energy expression of a cantilever beam considering only the displacement in one direction is as follows:

The kinetic energy expression is as follows:

Therefore, according to equations (10)–(13), the following was obtained:

In the current study, based on the above-mentioned method, the natural vibration frequencies of the cantilever components under the effects of gravity were solved and the first three order approximate solutions were determined as follows:

The expressions of the structural stiffness were determined (equation (16)), and the structural stiffness were obtained using the calculations detailed in Table 4:

The modal frequencies of the experimental model were theoretically calculated using the stiffness values measured in this study’s experiments. The approximate values of each order of frequency of the components are shown in Table 5:
Comparison of the theoretical calculations and the experimental data.

In the table, C2-1 represents the experimental data of the C2 member following the first impact; Test represents the experimental result.
In the present research investigation, by comparing the experimental results with the theoretical calculation results, the accuracy levels of the experiments were verified. It was not difficult to determine through the findings of the experiments that the low-order frequencies were insensitive to the stiffness degradation phenomenon. This had led to deviations in the measured values from the theoretical approximate solutions. Since this study’s experimental processes could not ensure stable fixed boundaries, elastic treatments of the boundaries will be required in order to achieve more accurate calculations. However, the experimental results showed that there were reasonable correlations between the DCI and stiffness changes (Figure 8). Therefore, it was considered that in engineering practices, the measured component frequency changes could be used to accurately predict the degrees of stiffness loss.

Correlations between the DCI and stiffness losses.
Numerical simulation and discussion
A finite element model which matched with the experiments was established using LS-DYNA commercial software. After analysis of the collision by explicit analysis, modal analysis by its implicit analysis. This section calibrates the finite element model and describes the solution to the conversion between algorithms.
Finite element (FE) model
The adopted 3D nonlinear finite element analysis model based on the experimental model is shown in Figure 3(c). Both the concrete and steel impacting cars adopted hexahedral elements with single integral points, and the reinforcement elements adopted Hughes-Liu sectional integral beams of 2 × 2 Gauss integral elements. Also, both the longitudinal reinforcements and the stirrups were regarded as elastic-plastic materials, which could be reasonably described using a piecewise nonlinear model. In this study, the dynamic intensification factor (DIF) relationships provided by Li and Hao 28 were used to consider the strain rate effects. The relationships between the strain rates and DIF were obtained using equation (17). The model was described using multi-stage elastic-plastic curves. In the current investigation, DIF = 1 represented the material state description under the quasi-static conditions. The corresponding yield point could then be expressed as the material changes from an elastic state to a plastic state when the stress level reached 350 MP and the strain reached 0.2%. As shown in Figure 3(b), the superstructure in the experiments was an axial hydraulic loading platform, and the keyword named *LOAD_BODY_Z was used in the numerical model in order to apply the gravity load to the entire model, and was equivalently simplified with an elastic material of suitable mass. The mass of the elastic material could be adjusted by changing its thickness. Similarly, due to the fact that the stiffness of the RC structure was far less than that of the steel trolley, the steel trolley was simplified as an elastic material for calculation purposes. Table 6 details the material parameters:

Model material parameters.

In the current study, LS-DYNA contact keyword *CONTACT_SURFACE TO SURFACE contact algorithm was used between the mass object and column, and the keyword named *CONTROL_DYNAMIC_RELAXATION was used for the dynamic relaxation analysis of the structure 0.1 s prior to the calculation in order to ensure the stability of the axial force application. Then, based on the research results obtained by Yuan et al. 29 regarding grid size sensitivity, the concrete grid size was controlled at 10 mm. In addition, since the deformations of the steel impact trolley were very small during the contact processes, it could be regarded as a rigid body. Therefore, its grid was divided into 50 mm. In regard to the contact setting between the reinforcement and the concrete, CONSTRAIN_BEAM IN SOLID was used to consider the slip effects between the reinforced concrete.
Concrete material model validation
The key validity proof CSC modal in that the plastic deformation is determined whether it can be reasonably and unloading stress occurs reasonable. This section refers to the simple finite element model of Φ150*300 mm cylinder proposed by Malvar, 30 as shown in Figure 9. The axial compression experiments of the cylinders were simulated and cyclic loading was carried out through a displacement process. The material parameter settings were described in a previous section. As shown in Figure 9, the stress–strain development process of the elastic element and the failure element during the loading process were recorded, respectively, and compared with the experimental and finite element model results in literature,31,32 the model was able to accurately reflect the effects of stiffness degradation during the damage accumulation processes. Similarly, trial calculations of the concrete constitutive model were conducted using the established experimental model. Figure 10 shows the impact force time history and crack development of Component C4 measured in the experiment, and the experimental results were compared with the numerical calculation results. The results showed that the constitutive model was able to reasonably predict the peak value of the impact force and the development of impact force under low velocity impact conditions. The differences between the calculated results and the experimental results were determined to be less than 10%.
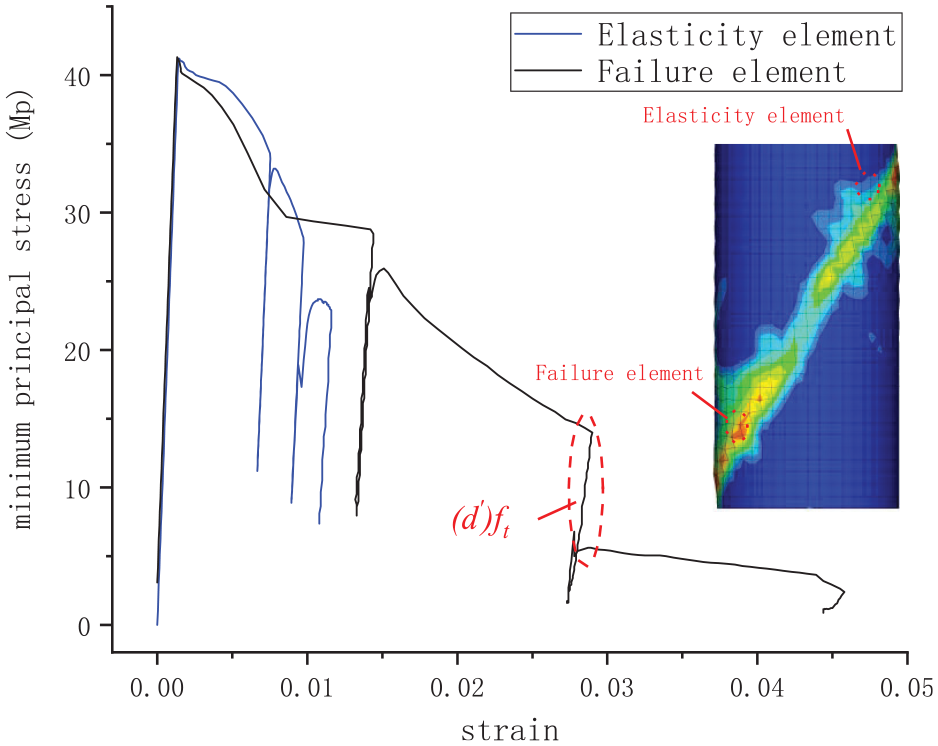
Cylinder model and result diagram.

Experimental results of Component C4 and comparison of the value calculation results: (a) dynamic responses of specimens C4 and (b) impact damage of specimens C4.
Modal analysis of damaged model
Due to the oblique punching cracks (Figure 10) which occurred after impact, pre-existing damages were required in the numerical calculations. The pre-existing damage (PRED) parameters provided by the CSC model reasonably solved this issue. Modal analysis was carried out for the same calculation model under different PRED values, and the results are shown in Table 7. It was found that the increases in the PRED values led to nonlinear reductions of the modal frequencies.
Comparison of the modal frequencies under different damage degrees.

Restart technology provides the possibility to study the cumulative damage problems of RC piers and modal analysis. Kishi et al. 33 carried out experiments and numerical simulations of these problems. However, the method provided by KISHI was only applicable to the problems related to the impacts between simple rigid bodies, and was not applicable to nonlinear large deformation impact problems with complex structures and many failure factors. Therefore, this study provided a new restart method as follows:
Following the first calculation, the calculation results were checked using the post-processing software Ls-Prepost, and the experimental data were compared. When the calculation results were found to be correct, the OUTPUT option in Ls-Prepost was used to output such data as the element and nodes, in order to use these data in a geometric model for the next calculation.
At the same time, the stress and plastic strain of all the elements at the completion of the first calculation were output through DYNAIN option in Ls-Prepost, and the initial damages were applied to the material for the purpose of forming a stress-strain initialization file at the initial time of the second calculation.
Then, the solution options and assemble a geometry file and stress initialization file were reset in order to obtain the second impact file. It was worth noting that the model could be appropriately simplified during the assembly of the modal analysis files, such as removing the steel trolley and the upper steel plate, as well as setting the solver to implicit analysis.
In the current investigation, in order to ensure the accuracy of the modal calculations, the PRED values were adjusted in order to ensure that the MAC values were within a reasonable range. Then, the range was divided in order to facilitate the calculation process. Table 7 shows the numerical calculated modal frequency values. The results show that the calculation method is suitable for the present study.
Vehicle-bridge impact model
The DCI can also provide references for engineering designs. In order to study the relationships between dynamic responses and modal frequencies of bridge piers under the effects of cumulative impacts of vehicles, a large number of numerical simulation calculations were carried out using columns with different section sizes, and various impact velocities and vehicle masses. The results showed that there were two types of impact forces at the time of impact, which were controlled by the cargo mass and velocity values. It was found that according to the experimental results, the appropriate finite element analysis parameters could be determined. Then, when combined with the Ford F800 medium truck model developed by National Crash Analysis Center (NACA) and a full-scale model of the pier to verify the validity of DCI damage indicators used in this study. Through regression analysis, the relationship between damage degree and dynamic response was studied.
Information regarding the piers and vehicles
In order to ensure the validity of the finite element model, this study adopted the same modeling method as described in Section “Concrete material model validation,” including the material model, contact mode, and strain rate effect parameters. Consolazio et al. proposed that a bridge model composed of a bridge columns and two spans can effectively predict the dynamic response of a multi-span bridge, and the prototype problem had been simplified which consists of a circular single column, superstructure and two supports. As shown in Figure 11, the size of

Specific sizes of the pier models.
Numerical simulations of the component information.

In the table, C800-V60-W8-1 indicates that the 800 mm diameter column is the first to be impacted by the vehicles with a total weight of 8 t and a speed of 60 km/h; 10C22 means 10 steel bars with a diameter of 22 mm; 25@150 means that the stirrup spacing is 150 mm and the diameter is 25 mm.
As shown in Figure 12, the Ford vehicle model was used to represent the collision of the vehicle on the bridge pier, Abdelkarim et al. 11 and Sharma et al. 21 shared the model and verified its accuracy through experimental tests. In this study’s model, the total mass of the Ford truck was 8 t, including a 0.24 t engine mass and a 2.8 t cargo mass. The engine and cargo were simulated using elastic materials, with an elastic modulus of 11,000 MP and 2000 MP. The weight of the vehicle model was controlled by changing the quality of the goods.
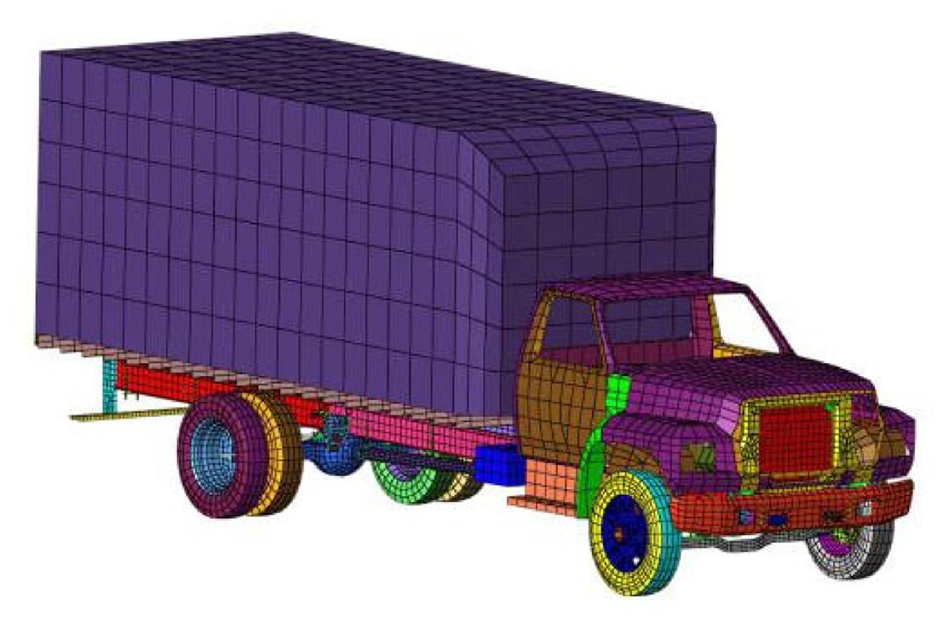
Truck model.
Vehicle impact responses
Peak impact force (PIF)
The change of damage degree is reflected by cumulative impact.. The typical time history of the three consecutive impacts and corresponding DCI values are shown in Figure 13. In the figure, a time history diagram of the three impact forces (C800/1000/1200) of the V110-W8 component is detailed. Each calculation time was set as 200 ms, with 400 ms being the end time of the second impact and the beginning time of the third impact, respectively. The peak values of the three impact forces were all caused by the contact between the engine and the bridge pier. Therefore, according to the comparison results, the time history diagram of the first typical impact force was consistent with the form of the time history diagram of the impact force developed by Chen et al. 34 and Cao et al. 35 Figure 14 describes the damage degrees of the components using the effective plastic strain after impact. The accumulation of the impact times caused the modal parameters of the components to gradually move away from their initial states, and the decreases in the stiffness values led to decreases in the PIF values. This phenomenon was found to be representative of piers which had suffered accidents. It was also worth noting that this phenomenon was not obvious in C1200-V110-W8. This was due to the fact that the impacting effects of the medium-sized truck at that speed had difficulty affecting the stiffness values of the pier of that particular size. As shown in Figures 13 and 14, results show that DCI values with increasing degree of damage increases. For a stronger ability to resist piers, which rise in value more slowly degree, demonstrate the effectiveness of DCI pier damage detection.

Time history diagram of the typical continuous impact force and damage degrees of the bridge piers.

Comparison of the impact damage degrees: (a) C800-V110-W8, (b) C1000-V110-W8, and (c) C1200-V110-W8.
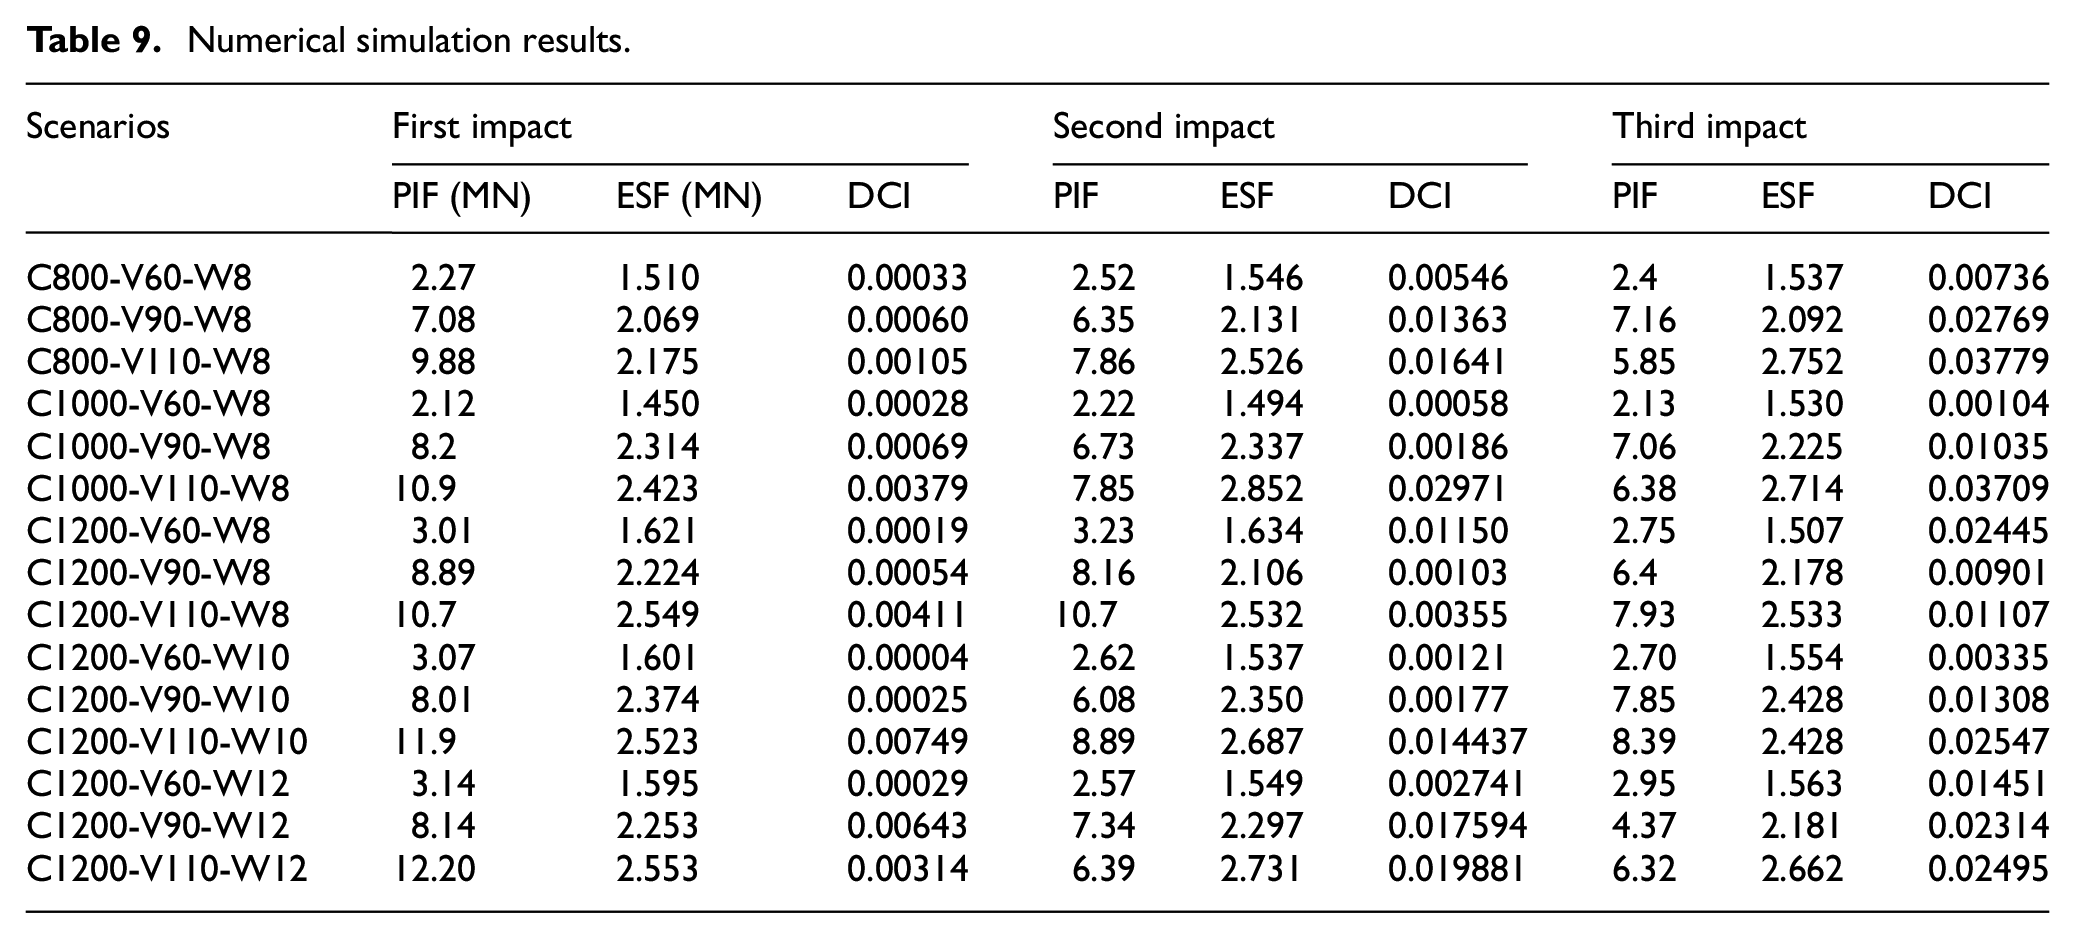
Table 9 details the statistical data of the numerical simulation results of the columns with different sizes, including the peak values, duration Tn, and 25 ms equivalent static calculation results of each impact force. All of the components in the table were impacted by a medium-sized vehicle of 8 t, which represented a typical type of engine impact scenario.
Numerical simulation results.
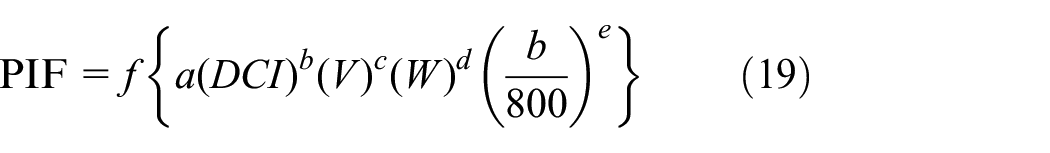
The studies conducted by EI-TAWIL [40] showed that the peak force formula (equation (18)) of ship-bridge impacts provided by American Association of State Highway and Transportation Officials (AASHTO) was also applicable to vehicle impacts. The impact velocity V (m/s) and the mass W (kg) of the impacting bodies were considered in the formula. In this study, a new expression equation (20) was proposed for the pre-damaged impact problem, and two dimensionless parameters, damage factor DCI, and the equivalent stiffness (b/800) were introduced. Therefore, the formula was able to achieve a more comprehensive description of each parameter. Five regression coefficients (referred to as a, b, c, d, and e) were determined using a nonlinear regression analysis method. It was found that when subjected to continuous impacts, the PIF engine could be estimated using equation (20). Figure 15 details this study’s comparison of the fitting results and the numerical simulation results:


Comparison between simulation results and equation (20): (a) C1200-W10 and (b) C1200-W12.
Conclusion
The frequency domain-based correlation method (DCI) proposed in this study was used for damage identification and structural safety assessments of the bridge piers impacted by low-speed vehicles, and verified its feasibility and applicability. The following conclusions were drawn from the research results:
In the proposed method, the measurements of the frequency response functions of the structures with impact damages were used as the main means, and the modal frequency parameters of the structures were obtained using fast Fourier transform (FRFs) processing. It was found that the cracking processes had major effects on the natural frequencies of the columns. In addition, due to the effects of the impacts, the stiffness values of the columns at the crack sections decreased and the modal frequencies displayed nonmonotonic decreases. Therefore, based on the measured data, the structural damage correlation indexes (DCI) could be calculated and compared. The results indicated that the DCI could effectively predict the changes in the residual stiffness values and the damage degrees of the structures.
The calculation method of reinforced concrete column impact based on the finite element method and the calculation method of modal identification after structural damage are introduced, and the accuracy of the benchmark experimental model is verified.
In the current research investigation, pre-damaged vehicle-pier impact events were calculated using a finite element method. The DCI was used to predict the peak impact force (equation (20)). It was found that when compared with the conclusions reached in related research studies, the advantages of the proposed formula were that it had taken into account the loss of stiffness and the decreases in the impact force caused by structural damages. Therefore, the proposed method provided valuable reference for the primary stages of future structural designs.
Footnotes
Handling Editor: Chenhui Liang
Declaration of conflicting interests
The author(s) declared no potential conflicts of interest with respect to the research, authorship, and/or publication of this article.
Funding
The author(s) disclosed receipt of the following financial support for the research, authorship, and/or publication of this article: The research findings described in this paper was sponsored by the Characteristic Innovation Project of Guangdong Universities (Project Number: 2020KTSCX128), and the Engineering technology research and Development Center for intelligent marine and terrestrial geotechnical material in Foshan for their help in this work.
Data availability
We verify that all our test data are accurate and reliable. The test data are included within the article and can be made freely available.