
Abstract
Dropper is an important component of pantograph-catenary system employed in high-speed railway. The cyclic stress in dropper can lead to the fatigue failure during operation. The study of the fatigue life of dropper is the premise to ensure the safe exploitation of the train. The analytic vibration equation of dropper is proposed. Based on the finite difference method and MATLAB numerical calculation program, the vibration process and stress variation of the dropper are simulated. The influence of excitation frequency, vibration amplitude, and applied force on fatigue life of dropper is studied, according to the stress history of the dropper, the Basquin equation, and the Palmgren–Miner linear fatigue cumulative damage criterion. The numerical results show that the logarithm of the fatigue life of dropper shows a linear decreasing trend with the increase in the excitation frequency, vibration amplitude, or applied force.
Introduction
The total mileage of China’s high-speed rail is bigger than 22,000 km, exceeding the sum of all other countries in the world by the end of 2016. The pantograph-catenary system is an important component of the traction power supply system of the high-speed train, as shown in Figure 1. Dropper is the support of the whole pantograph-catenary system, and it is the transmitter of vibration and force between messenger wire and contact wire, and the key component of the safety operation of power supply catenary. During exploitation of high-speed railway, the cyclic stress appeared in a dropper may cause the fatigue failure of dropper. It directly leads to failure of train running. At high speed and large traffic density, the failure will cause more frequent interference to the running state of the catenary system. Worth to notice that the cyclic dynamic stress amplitude of dropper is very high, and fatigue damages can be easy to be occurred. Therefore, the study of fatigue life of catenary parts such as dropper is important for ensuring the high reliability of pantograph-catenary system and the safe operation of high-speed train.

The pantograph-catenary system.
In the study of fatigue characteristics of power supply catenary system, many research groups have done a lot of efforts. Wang et al. used ANSYS finite element software and the direct integration method to simulate the pantograph-catenary coupling system dynamically. He determined the stress history of the contact wire and followed the fatigue life of the contact wire using the linear cumulative damage theory. 1 Bi et al. have calculated the fatigue life of each element of the contact wire using the rain flow counting method and the Miner linear fatigue cumulative damage theory. They have studied the influence of span, pretension of contact wire and messenger wire, sectional area, train speed, and dry friction on fatigue life of contact wire.2,3 Song et al. used Davenport and Panofsky’s power spectra to simulate the stochastic fluctuating wind acting on a pantograph-catenary system. The authors deduced the aerodynamic forces acting on the catenary and studied the wind-induced vibration fatigue of contact wire of the high-speed railway under random wind field. 4
The influence of the amplitude, frequency, and the magnitude of the stochastic force on fatigue life of dropper under the condition of equivalent experimental model was investigated in this article. The dropper behavior under complex loading, that is, axial and shear forces, as well as bending moment, was simplified to a composite deformation component. The differential equations of the vibrating string were derived. The equations were transformed into finite difference equations by means of numerical method, and the code of variations of stress versus time for each element of the dropper and the visual program for bending moment, axial force, and stress distribution of cross section were compiled using MATLAB software. Then, the fatigue life calculation program was written by MATLAB based on the Basquin equation, the double logarithmic S-N curve, and the Palmgren–Miner linear fatigue cumulative damage criterion. Finally, the numerical results were analyzed and compared at various values of the numerical parameters, such as amplitude, frequency, and the maximum force, and the influence of the above factors on the fatigue behavior of dropper was studied.
Details of analysis
Stress calculation
In the actual operation of the pantograph-catenary system of high-speed railway, when the catenary is in a stationary state, the dropper is subjected to a tensile force caused by the constant loading of the contact wire, and it is in a stretched state. When the high-speed train is passing, dropper is in a state of unloading under the lifting of the pantograph. When the train passes, dropper goes back to the stretching state under constant load of the contact wire. Each time the pantograph passes, the dropper completes a periodic vibration. The vibration of the dropper under actual conditions can be equivalent to the forced vibration caused by the harmonic vibration of the connecting point between the dropper and the messenger wire. There is a vertical downward acting force F due to the weight of the contact wire at the lower end of the dropper.5,6 Figure 2 is a schematic diagram of our experiment. The strands in the diagram represent a dropper. The stranded wire in Figure 2(a) is in a natural straightening state. Figure 2(b) shows the state of the dropper when the train passes through, or when other factors (such as the wind and rain) lead to the compression of the dropper. The actual dropper and the contact wire are connected by a dropper clip. At the moment of compression and rebound, they may be separated transiently. The effect of the force interaction of the lower dropper part is expressed by F as shown in Figure 2(d). It is unrealistic if all complex vibrations in the working process of a dropper are completely reproduced by experiments. Therefore, we use sinusoidal vibration to simulate the vibration of the dropper in the first stage of the experiments.
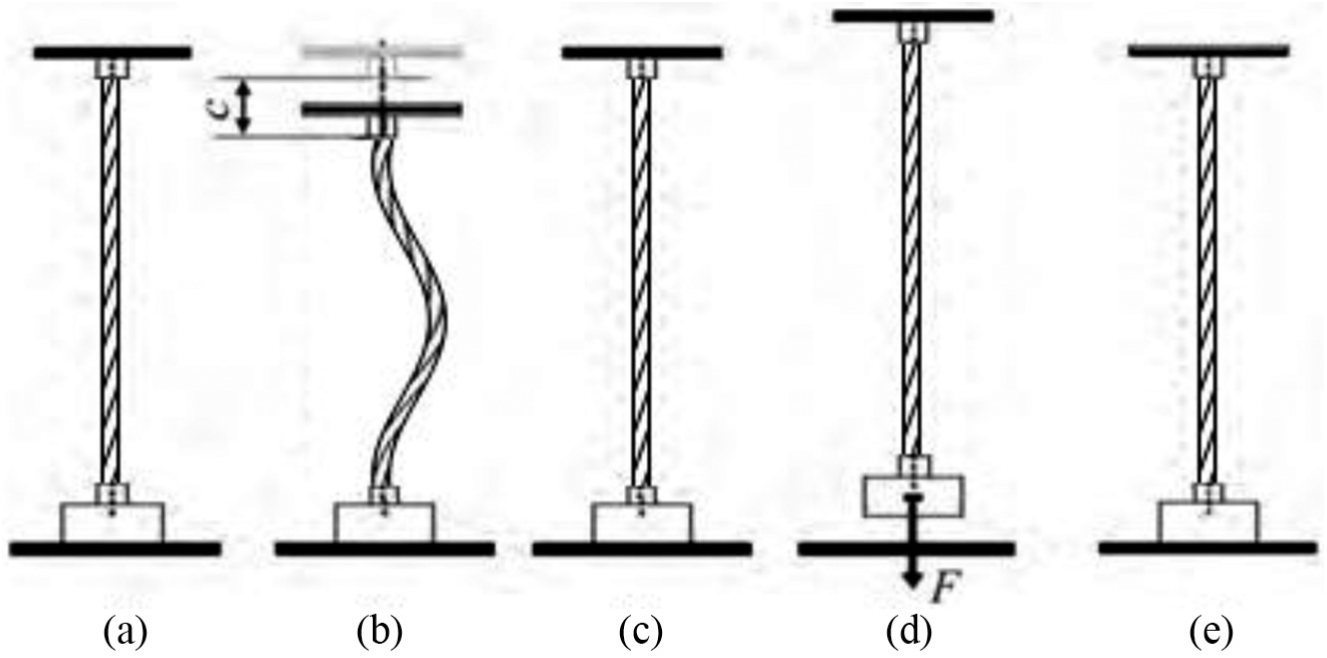
The dropper behavior under loading (a) A natural straightening state of dropper. (b) Some factors (such as the train passing through, or the wind and rain) lead to the compression of the dropper. (c) After the train passes through, the dropper resumes a straightening state. (d) The effect of the force interaction of the lower dropper part is expressed by F. (e) it indicates a return to (a). The diagram from (a) to (e) is a simplified equivalent vibration of the dropper under actual conditions.
Analytical approach
In order to calculate the stress state components in the dropper under conditions from Figure 1, an infinitesimal element of string is taken for stress analysis (Figure 3).
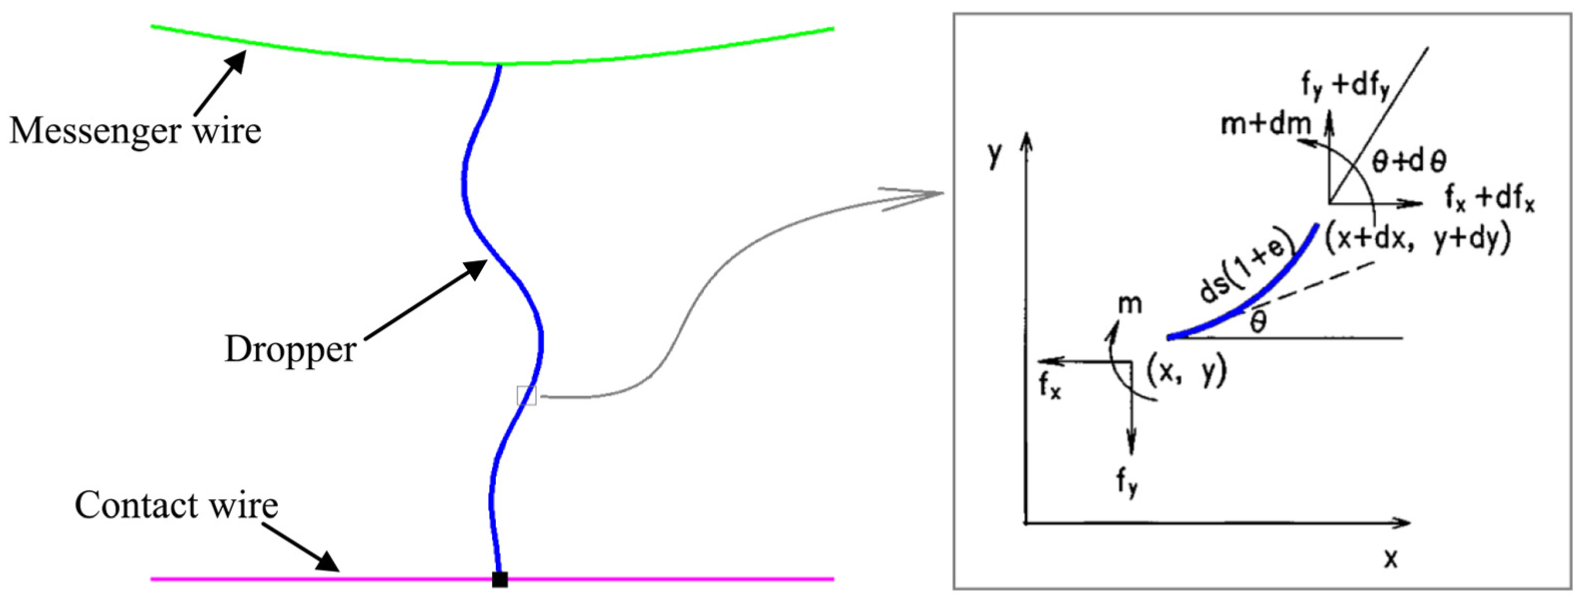
Description of the segment dropper behavior using 2D coordinate system.
The axial tensile force and shear force of the infinitesimal segment of dropper can be expressed as follows

where
The axial strain of the minor segment of the dropper caused by the axial tension can be expressed as follows

where
According to the relation between the position coordinates

where
The following equations can be obtained from the differential relationship between bending moment and shear force and deformation due to bending


where
According to Newton’s second law, the equation of motion of the infinitesimal section of dropper is


where
The differential relation between the angle

Solving equations (1)–(8) at employing the boundary conditions and initial conditions of dropper, the position
For the sake of computational simplicity and convenience, the following dimensionless variables are cited
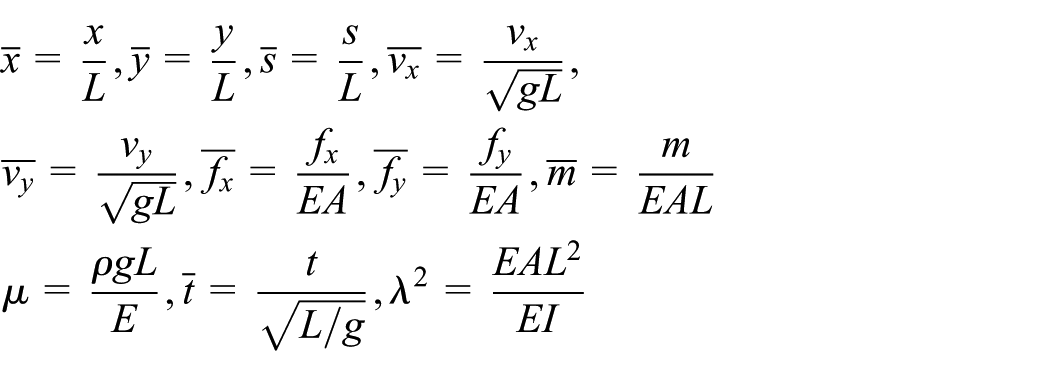
where
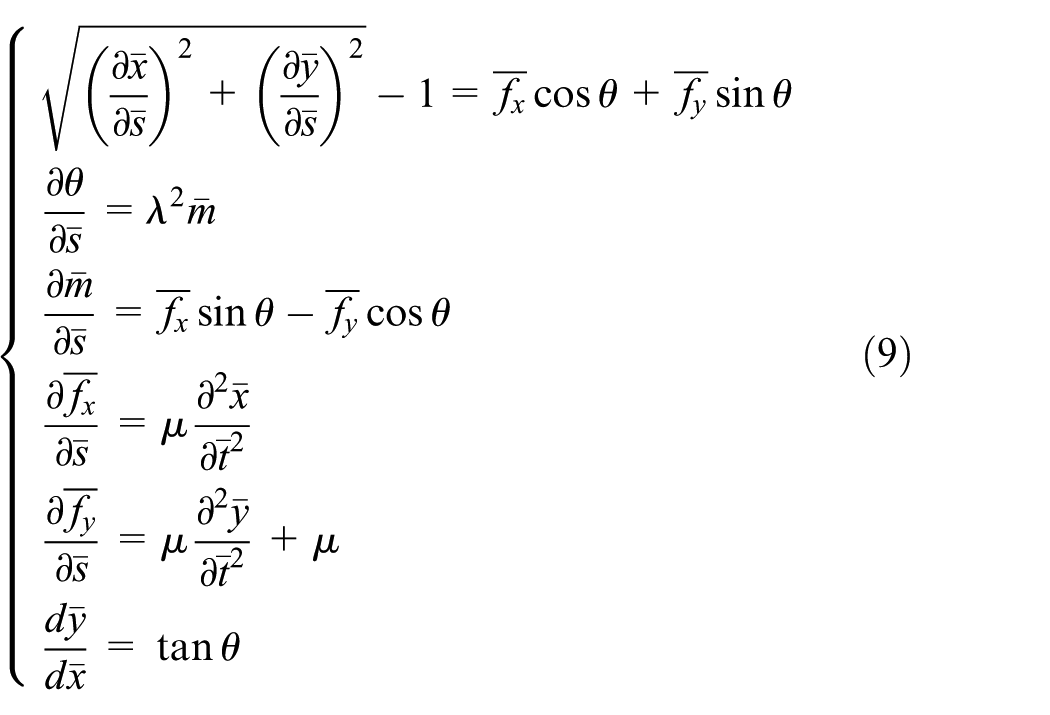
The above equations contain six dimensionless unknowns:
The initial condition can be expressed as
Boundary conditions can be expressed as

and
where
Numerical approach
Equation (9) about the motion of dropper is a set of nonlinear partial differential equations. An analytical solution is very difficult to obtain. The dropper geometry is divided into many minor elements, the differential equations are transformed into finite difference equations, and MATLAB code is used to solve the finite difference equations. Finally, the numerical solution of the motion of dropper is obtained.
It is assumed that the whole dropper is discretized into n elements with the same length, and the dimensionless length of each element is
Substituting the above expressions into equation (9), and selecting the appropriate number of discrete elements n and timestep
Dimensions of the dropper and its parameters used in numerical calculations.

Fatigue life analysis
With regard to the fatigue properties of materials with copper, many researchers have carried out relevant investigations. Huh et al.
7
have studied the fatigue behavior of copper film by electronic speckle pattern interferometry (ESPI) system. The authors have analyzed the dislocation microstructure evolution in polycrystalline copper under cyclic strain amplitude. They have investigated the relationship between the S-N curve and microstructure.
8
Nasution et al.
9
followed the fatigue characteristics of the flexible copper stranded wire. These studies expressed a significant influence on the materials microstructure on its fatigue strength. The dropper considered in the article is made of long and thin copper wire. It is similar to the form of copper strand used in Nasution et al.,
9
so the fatigue S-N curve refers to the parameters presented in Nasution et al.
9
For the material type, the double logarithmic S-N curve obtained by Basquin equation
With respect to various effects, such as the train pantograph passes at high speed and the interference of the gale, the vibration shape of dropper is very complicated and the stress changes are very complex. It can be seen from the above calculation and the numerical results that, even if the vibration of dropper is simplified into a numerical model in this article, the stress distribution on the cross section is not represented by a sinusoidal function, but a cyclic curve with fluctuation of the amplitude. Variable amplitude is one of the most common reasons to failure. Researchers have proposed many approaches to fatigue life calculation basing on various cumulative rules of fatigue damage, such as Palmgren–Miner (linear damage accumulation method), Manson (bilinear fatigue damage accumulation method), Macro-Starkey (nonlinear fatigue damage accumulation method), and probabilistic fatigue cumulative damage method.10–13 Among these methods, the Palmgren–Miner rule is the conception widely used by engineers. This method is employed in the article for calculation of the fatigue life of dropper. The Basquin equation is substituted into the Palmgren–Miner equation

where D is the cumulative damage variable,
The proposed fatigue life calculation supported by the stress history for each element of dropper obtained by the use of numerical conception, and a software for fatigue life prediction of dropper is developed using MATLAB code. The variations of fatigue lifetime for frequency, amplitude, and maximum force are obtained.
Results
The axial force and bending moment are obtained through numerical calculation. Then, we use two methods to analyze the stress of the dropper:
Considering the effect of bending moment, the formula of stress calculation is as follows

where F is axial force, A is cross section area of dropper, m is bending moment, and WZ is dropper’s section modulus in bending.
The action of bending moment is not taken into account, hence, the formula of stress is as follows
It is found that the difference is negligibly small through the comparison of the results of two methods. This is in accordance with the actual situation because the bending stiffness of dropper is very small.
In order to reach an influence of loading frequency, amplitude, and force on the stress distribution on cross section of the dropper, the visualization in MATLAB software, applying dynamic display of bending moment, axial force, and cross-sectional stress of dropper in the vibration process, is carried out. The results are presented in Figures 4–6.

Details of dropper vibration process at time equal to 1.6652 s.
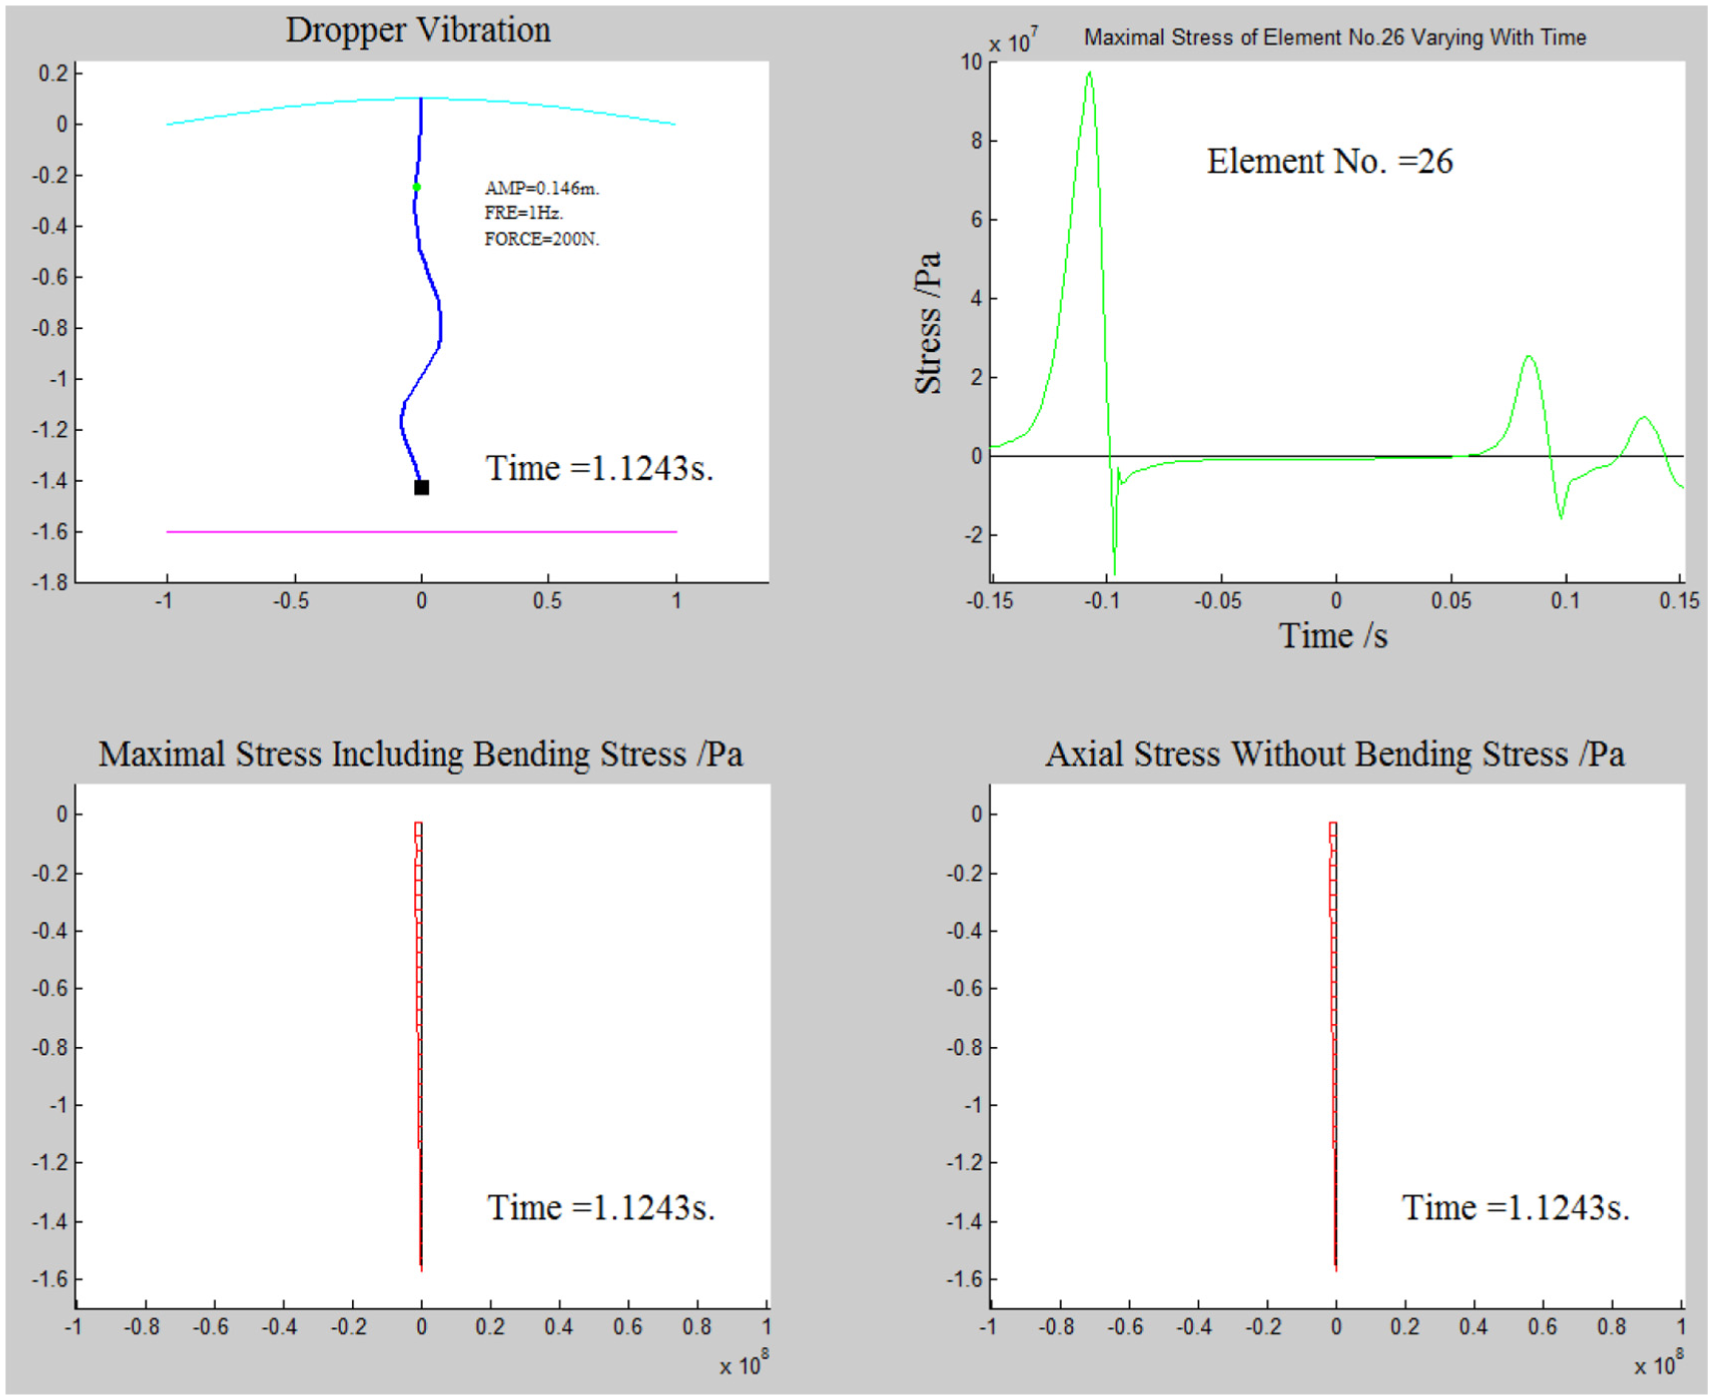
Details of dropper vibration process at time equal to 1.1243 s.

Variations of maximal value of stress versus time for element no. 26.
Figures 4 and 5 are the interfaces of two visualization programs developed by the authors. The results are dynamically displayed in these visualization programs when the numerical calculation is completed in a background process. The program shown in Figure 4 captures the shape of the dropper, the bending moment, and the axial force of each section synchronously.
The program presented in Figure 5 is designed to display the stress information during the vibration process. Four sub-windows are synchronized in time. The window of the upper left corner shows the shape of the dropper, the window of the upper right corner illustrates the stress–time curve of the cross section of a certain node. The window of the lower left corner expresses the maximum stress of the dropper under the combination of tension and bending when considering the action of flexural rigidity. The window of the lower right corner presents the cross section stress only considering the axial force.
Applying these two visualization programs, we can observe and obtain information in details for dropper vibration when the frequency, amplitude, and force are different.
In order to obtain the basic data of fatigue life calculation, stress–time curves are recorded for various combinations of different frequencies, amplitudes, and forces. Figure 6 shows the stress–time curve of a typical case in the first 3 s (frequency = 1 Hz, amplitude = 0.074 m, and force = 200 N). The stress–time curves of other situations are elaborated, but they are not presented in the article.
The compression period is the key point for the simulation of dropper vibration. If the compression stage is distorted, it is likely to lead to larger errors. With respect to the stress–time history of various combinations of different amplitude, frequency, and force values, two essential differences for the analysis can be noticed.
When the force is large, the amplitude is small, and the frequency is low, there is no significant bending deformation in the whole vibration process and the dropper is in a tiny bending state during compression periods. Variation of stress is shown in Figure 7.

Case one: variations of maximal stress of dropper versus time.
In this case, the stress–time relationship can be divided into three sections. The first is an instant rebound stage. The dropper deforms instantaneously from compression to tension, and the stress changes suddenly to the maximum from the value of nearly zero, then a compression is emerged by the inertia. The second is the damped sinusoidal vibration stage of the straight line state. At this stage, the dropper behavior is similar to a spring oscillator. The third is the tiny bending compression stage. At this stage, the dropper is in a tiny bending state. Because the bending stiffness of dropper is very small, the stress of cross section is almost zero. When dropper is transitioning from one stage to another, it is subjected to an impact force.
When the force is small, the amplitude is big, and the frequency is high, there is obvious large bending deformation during the vibration process. In the transversion of straightening to compression and then bending, there is a large shock effect. The stress mutation is very significant at this moment and then the stress at the bending state is basically zero. Variation of stress is shown in Figure 8.

Case two: variations of maximal stress of dropper versus time.
From the process considered, variations of maximum stress on cross section of dropper versus time can be evidenced. The driving point performs simple harmonic vibration, as the driving point is lifted and the dropper is tensioned, the stress decreases and fluctuates. When the driving point moves downward to the origin, dropper begins to sag and flex, it is subjected to a greater instantaneous impact, and then the compressive stress decreases rapidly. The stress on the cross section of the dropper is always kept small before straightening the string. For upward movement of the driving point, dropper is subjected to very large impact stress instantaneously when the string is straightened, and the tensile stress value at this time is the maximal value tensile stress in the whole vibration process. In the following vibration process, the driving point moves in reciprocating motion according to simple harmonic vibration. The stress of the cross section of dropper still keeps the same rule and varies in the same period.
Discussion
Effect of loading frequency on stress variations
At the amplitude of 0.035 m, the force reaches 100 N. For the vibration frequency, the stress history of dropper under different excitation frequencies is obtained. The maximal and minimal values of stress at various frequencies are shown in Figure 9. It can be seen that the maximal values of stress increase with the increase in the frequency. The minimal values of stress decrease with the increase in the frequency when its value is less than 2.4 Hz. The maximal and minimal values of stress are approximately linearly changed with frequency. When the excitation frequency is greater than 2.4 Hz, the relation between stress and frequency becomes complicated. An analysis of the dropper dynamic process enables to find that the range of motion at the lower end of dropper becomes very large. This results in that the instant the dropper changes from bending to straightening, tension does not occur at the time driving point passes the origin. At this point, the relationship between the frequency and the velocity of lower end of the dropper relative to the driving point is complicated. The instantaneous impact force is closely related to the relative velocity, thus, there is no simple linear relation between the maximal value of stress and frequency.

Variations of maximum and minimum stresses on the cross section of the dropper as a time function.
Amplitude on maximum and minimum stresses
An influence of amplitude on stress is captured at force equal to 200 N and frequency of 1 Hz. The maximum and minimum stresses on the cross section at various amplitudes are shown in Figure 10. It can be found that the stress values are strongly related to amplitude. The maximum cross-sectional stress increases with the increase in the amplitude. The minimum value of stress decreases with the increase in the amplitude.

An influence of amplitude on variations of maximum and minimum stress values.
Force on maximum and minimum stresses
For the effects due to force, frequency is equal to 1 Hz, and the vibration amplitude reaches 0.2 m. The maximum and minimum stresses at different forces are presented in Figure 11. It can be found that the maximum stress increases for higher values of forces. The values of minimum stress are stable.

An influence of force on variations of maximum and minimum stress values.
Frequency on fatigue life
The effect of frequency on stress of dropper is obtained for the amplitude equal to 0.035 m and the force of 100 N. The fatigue life of dropper is calculated according to the stress–time history curve at different frequencies (Figure 12). The semi-logarithmic coordinate system is used for the results.

The fatigue life of dropper varies with frequency.
From the result in Figure 12, the fatigue life of the dropper is greater than 107 (the general value of the cycle base number Ne is 107), and there is no need to consider the problem of fatigue at this situation in the engineering. However, the authors have decided to investigate the trend of the effects of frequency, amplitude, and force on fatigue life of dropper. They have reached the following results: if the amplitude and the force are further increased, the fatigue life of dropper is likely to be less than 107. Therefore, the influence of frequency, amplitude, and force on fatigue life is evidenced.
Looking the data on Figure 12, a linear relationship between the fatigue life and frequency for its value of 2.4 Hz is evidenced. When the frequency is greater than 2.4 Hz, the fatigue life fluctuates.
Amplitude on fatigue life
The effect of amplitude on the stress of dropper is obtained for the frequency of 1 Hz and the force equal to 200 N. The fatigue life of dropper is calculated based on the stress–time history curve at various values of amplitude (Figure 13).

The fatigue life of dropper varies with amplitude.
For the results, a linear reduction of the fatigue life with amplitude increase is visible.
Force on fatigue life
An influence of force on the stress in the dropper is analyzed for the amplitude of 0.2 m and frequency equal to 1 Hz. The fatigue life of dropper is calculated according to the stress–time history curve under force values (Figure 14).

The fatigue life of dropper varies with force.
Variations of the fatigue life versus force value are linear up to 280 N. For the force close to 310 N, a significant lowering of its value is visible. At the bigger values of the parameter, the force reduction disappears.
Conclusion
The main conclusions are as follows:
The maximal values of stress appear when bending is changed on straightening. Its values increase linearly with increasing frequency, amplitude, and force. The minimum stress occurs for the following moment. The mass at the lower end of the dropper rises sharply due to inertia, causing the instantaneous compression of dropper. The minimum stress decreases linearly with the increase in the frequency and amplitude, but an influence of force on the minimum value of stress is relatively small.
The fatigue life of dropper is approximately linear up to frequency up to 2.2 Hz. Fluctuation of the relationship is clearly manifested for the higher values of the parameter.
The fatigue life decreases with increase in the amplitude, frequency, and force values.
Footnotes
Handling Editor: Michal Kuciej
Declaration of conflicting interests
The author(s) declared no potential conflicts of interest with respect to the research, authorship, and/or publication of this article.
Funding
The author(s) disclosed receipt of the following financial support for the research, authorship, and/or publication of this article: The authors thank the Key Project of Technological Research and Development Plan of China Railway Corporation (2017J010-A) for financially supporting this work.