
Abstract
There are a lot of complex tubing in aviation, aerospace, automobile, and other industrial machinery and equipment. The reliable assembly of these tubing directly affects the quality of the products. Tube has two targets in assembly including assembly performance and avoiding obstacles. Thus, the assembly results is an overall merit based on the geometry error. It is easy to get geometry error of a tube, but the problem is how to evaluate the assembly result according to the geometric errors. The current approaches have a good performance in analysis of idealized assembly. However bend tubes have complex topology and shape, current solvers cannot account for the natural manufacturing and assembly variability that occurs in assembly of bend tubes. In order to make accurate predictions about assembly performance and product quality, the variability of the assembled tubes must be evaluated in the assembly model. This article outlines two key targets in tube assembly based on the function of bend tube. To achieve the assembly targets, a method based on virtual fixture is proposed to evaluate the bend tube assembly performance. The evaluated bend tubes are adapted by the virtual fixtures and reach to an exact position to evaluate the assembly performance. Numerical experiments with Monte Carlo method are designed to simulate the method, analyze the results, and prove its feasibility. Designers and manufacturing engineers can efficiently evaluate the assembly performance or judge the assembly ability of a produced tube from its geometric errors.
Introduction
Installation of tubes is widely encountered in the field of aerospace, automobiles, railway industry, and vessels. As the devices in these fields become lighter and smaller, the tube components become more complex than before. The final quality of the device is influenced by the compliant assembly of the tubes. Actually, the tube assembly is influenced by the geometric errors, which is mainly caused by the bend tube machine and the springback of the tube. Bend tube has a complex topology and shape, and the shape is sensitive to the error from each bend parts. Each bend parts has a geometric errors caused by springback, it may lead to a deviation of the endpoint, and the tube cannot be assembled to product. Furthermore, the springback of bend part cannot be avoided, and it relates to serial factors such as tube material, bend angle, bend radius, and thickness of tube wall.1–3
Tools such as gauges,4–7 three-coordinate measuring machine, 8 or other non-contact measuring instruments9–11 can provide the geometric parameters of manufactured tube, but they cannot analyze and evaluate the assembly performance of the tube.
Usually, bend tube is manufactured by a bending machine with processes of pushing, bending, and rotation. The shape of tube can be described as a combination of straight and curved cylinders as shown in Figure 1. The topology of bend tube can be described by its center line, and the center line is a combination of straight line and arc line. The intersection of straight lines are control points which are denoted by a cross mark. The intersection of arc lines and straight lines (or the tangent points on arc lines) with two endpoints are key points of a tube, which are denoted by a circle mark.

(a) The center line of the tube of (b). The dot dash line means the axis of the cylinders in the tube; the fine line is the center line of the tube; the heavy line is the edge of the tube. The cycle mark represents the key point (endpoints and tangential points) in the tube, and the cross mark is the control point of the tube.
Three kinds of representation to describe a bend tube are as follows: (1) the YBC data, (2) the position of control points, and (3) the position of key points. The YBC data are a representation for the processing plan of tube directly, 12 including lengths of line segments Y, bending angles of arcs C, and angles between the surface normal vectors of two adjacent arcs B, as shown in Figure 2. The offset of YBC data can report the geometric errors of a tube. But spatial tubes have a complex topology, only comparing the YBC data between the manufactured model and designed model is not intuitive enough.

An example of tubes’ YBC data.
Unlike the YBC data, control points and key points are from tubes’ center line, which are represented by a serial of point coordinates in the three-dimensional (3D) space. The control points of a tube include two endpoints and the intersection points of the tubes’ straight center lines, which are applied to design and generate the bend tube in a computer-aided design (CAD) system. The key points contain the tangent points on the tubes’ curved center line and the two endpoints, which can be applied for analyzing the assembly tolerance of bend tube. 13 According to the results of analysis, standard model can be produced for fitting tube to judge the tube assembly ability. This method is a traditional and regular way to evaluate the tube assembly performance, but no geometric errors can be fed back to show how different the manufactured tubes’ shape from the designed model.
Due to the development of digital detections7–9,11,14 and data processing algorithms,15–17 the measurement of a tube is more rapid than before. These methods obtain the tubes’ geometric parameters or geometric errors rapidly but cannot provide an evaluation of the assembly performance for the measured tubes. Therefore, it is still hard to build a connection of geometric errors with the assembly result. Especially, for the tube, the topology of it is very variant and complex. The current method 18 solves the position and location of bend tube in an overconstrained situation or an idealized condition.
For those variant and complex components which have free shape, they could be measured in a free state. Abenhaim et al. 19 measured a flexible curved surface in a free state without fixtures and compared with a CAD model. Radvar-Esfahlan and Tahan 20 presented a virtual fixture with finite element, analyzed for measuring a free surface, and then compared it with the design model. These methods apply virtual fixtures to measure free shape product, in which the position of fixtures influences the result of measurement.
The virtual fixture is a weighted value to constrain the region for object to move in virtual space. 21 It is also used in manufacturing presenting jigs, gauges, and fixtures. 22 During the measuring, the virtual fixture can be applied for allocation of tolerance. 23 The virtual fixture has two functions. One is for constraining those key points with a high weighted value. The other is for creating the forbidden zone to control the adaption under those constrained points. For a rigid object such as the tube, only three key points can locate its position and posture in three-dimensional (3D) space. Therefore, it is overconstrained for choosing all key points such as constrained conditions to measure the geometric errors.
Actually, the aiming of assembly results for some tubes is not as complex as promising each key points in a high accuracy. For example, as shown in Figure 3, the tube (Figure 3(a)) is from the aerospace, and it needs a high accuracy only in two endpoints; the tube (Figure 3(b)) is from the automobile, and it needs a high accuracy in two endpoints and the two marked curved parts. Thus, two basic targets are considered as follows:
The ability to assemble, which means both the ends matching the assembly condition.
The bend parts in a tube have an ability to avoid obstacles.

(a) Tube is from aerospace with an assembly requirement in two endpoints and (b) tube is from the automobile with an assembly requirement in two endpoints and two marked curved part.
We consider these two targets as the assembly performance in this article. A tube assembly performance evaluation using virtual fixtures is proposed in this article. The evaluation first chose key points as virtual fixtures from designed model. Then set virtual fixtures to select key points which have a high demand of accuracy in assembly. The geometric errors of these selected points are calculated with a high weight in a fitting calculation. Finally, according to the calculated geometric errors of these selected points, the evaluation of tube assembly performance can be judged. We designed numerical experiments to simulate the evaluation and analyze the results, the results showed the feasibility of the method. The experiments take the modern manufacturing level into consideration. The push error can be limited in ±0.2 mm, and the error of rotation can be limited in ±0.2°. 13 The proposed approach not only provides an evaluation to judge the bend tube after manufacturing but also provides designers an intuitive assembly performance rapidly. Besides, for a further consideration, some flexible tubular components such as cables or soft tubing need to be constrained in assembly path planning or modeling,24–26 our virtual fixture method has a potential to provide constraints.
The virtual fixture method
Overview of the evaluation
The main idea of the proposed method in this article is adjusting the model of manufactured tube into a fitting position and adapting to a stand model determined by virtual fixtures. According to the fitting and adapting results, the tube assembly performance can be evaluated. Each virtual fixture is explained by a weighted value, and the evaluated tube is adapted to the standard model by a weighted fitting calculation. The whole processing can be shown in Figure 4.

The basic flow of evaluation of tube assembly performance.
According to the fitting results, the assembly performance of the manufactured tube can be evaluated.
Setting the virtual fixtures
The virtual fixtures can be determined by the designed model. Generally, the tube designed model is represented by YBC data or the position of control points. According to researches, 27 the YBC data or the position of control points can be converted into the position of key points. Meanwhile, the virtual fixtures are described by weighted values, and the weighted values have a range from 0 to 1. The virtual fixtures with a weighted value toward 1 mean the key point needs a high accuracy in assembly. For example, if the evaluated tube is only considered the ability to assembly as the targets 1 (both the ends matching the assembly condition) explained in section “Introduction”, the virtual fixtures on two endpoints could have a high weighted value toward to 1. The certain value of the weight is determined by experiments, and the detail is described in section “Weight selection.”
Weighted fitting calculation
A tube with n bending can be represented by a sequence of points. Each element of the sequence is the key point of a tube as shown in equation (1). According to the definition of the key point, when the index i of the sequence is equal to 1 or 2n + 2 (i = 1 or i = 2n + 2), these two points are the endpoints of the tube. Others are tangential points of the tube

Each position is rotated and displaced; the adjustment is shown in equation (2)

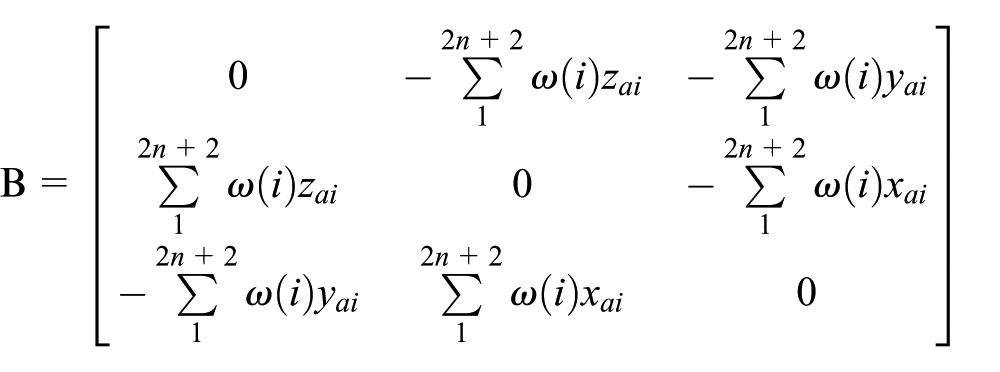
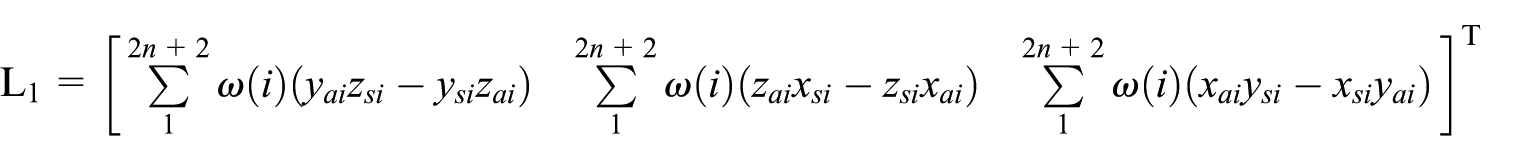
In equation (2),
According to fitting calculation as in equation (2), the position and posture of the evaluated tube can be determined by only three points. Generally, a bend tube with only one curved part has at least four key points. Thus, the fitting calculation is an overconstrained problem. We considered a weighted value in each key point as the virtual fixtures. The virtual fixtures with a high weighted values can promise the corresponding key points have a high accuracy in assembly. Therefore, the weighted fitting calculation can be represented as equation (3).
The point

When the Q comes to a minimum value, all the parameters can be calculated by equation (4)

In equation (4)


The results of the weighted fitting calculation adapt the tube to a exact position under the constraint of virtual fixtures. The different combinations of selected key points with high weighted values lead to different fitting results. For example, as shown in Figure 5, the point marked by circle means the key points with a high weighted value in calculation. For the same tube, the combination of two high weighted values leads to two different results. In condition a, two key points in curved part are chosen with a high weighted value, and thus, two endpoints have large deviation from the designed model. However, in condition b, two endpoints are chosen with high weighted values, and the fitting results show that the two endpoints are close to the designed model.
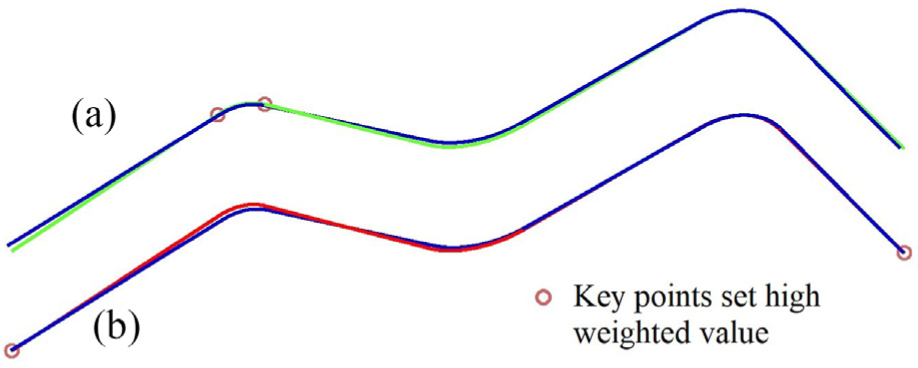
(a) Two key points in curved parts are selected with high weighted values and (b) two endpoints are selected with high weighted values.
According to the results and comparing to the requirements of the designed model, the assembly performance can be evaluated.
Evaluation of assembly performance
The evaluation of assembly performance refers to the comparison between the fitting results and the requirements from the designed model. Two kinds of requirements are considered:
The tolerance of the selected key points.
The position and orientation of the selected key points in the assembly coordinate system.
If the deviation of the fitting results can satisfy the designed requirements, the evaluated tube has a good performance in assembly.
Numerical experiments
We carried out a series of experiments to support the method proposed in the second part. These experiments include the weight selection for the virtual fixtures and the calculation of weighted fitting. Simulations are also carried out to show the performance of the method under the selected weighed value. Besides, the feasibility of the method can be proved by experiments.
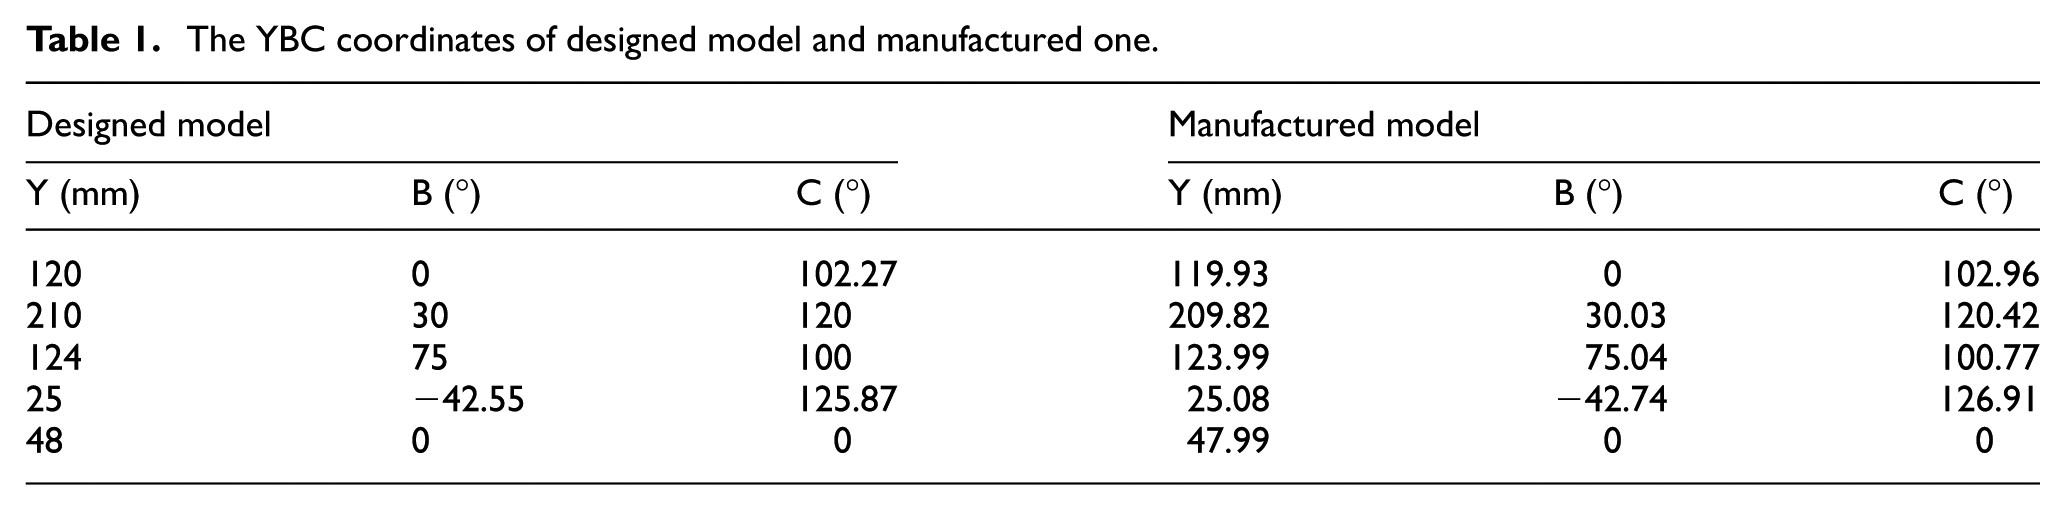
We generate a designed model and a manufactured model with geometric errors randomly in YBC coordinate system as shown in Table 1. The geometric errors are considered based on the modern manufacturing level. The push error has a range of ±0.2 mm, rotate error has a range of ±0.2°, and the error of bend angle is in the range of 0.2°–2°.
The YBC coordinates of designed model and manufactured one.
Weight selection
The calculation as shown in equation (3) has six parameters and 2n + 2 weighted values, which is a non-linear least square problem. Each weighted value needs to be determined, but no simple rules can be applied to determine the weighted values. Therefore, we made a simulation experiment and processed the data in some statistic method.
Two levels are set for the key points. If the key points need a high accuracy in assembly, the weighted value is equal to 1, and the others are set to a value below 1. The simulated tube has four bends, so there are 10 key points in this tube. We choose the two endpoints with weighted value of 1. This situation exists commonly in assembly. Aiming at investigating the variation of the evaluation with the weight changed, we draw a graph as shown in Figure 6.

The two endpoints are selected with weighted value equal to 1, and the other key points have a varied value. The ECR changes with the variation of weight.
In Figure 6, we defined a new quantity called the error correct rate (ECR). The main difference between the method in this article and the fixtureless evaluation is the calculation with a weight. Actually, the fixtureless method has a default weight, which is equal to 1. That is similar to the tube tolerance analyzing in research.
19
However, unlike the fixtureless method, the selected key points with a high weighted value can promise its geometric error in a low level during the weighted fitting calculation. The ECR is shown in equation (5). The d0 means the geometry error in fixtureless evaluation. The d is a function with the variation of

Obviously, the ECR is a ratio relative to the fixtureless method. When the ECR is a positive number, the fixtureless method cannot provide the assembly performance exactly. Actually, the results are generalized, and we designed a simulation based on Monte Carlo method to prove it. We generated totally 5000 random errors for this designed YBC data. And the same processes are carried out in each error result. We recorded all the variations of two endpoints, and the average value of ECR is shown in Figure 7.
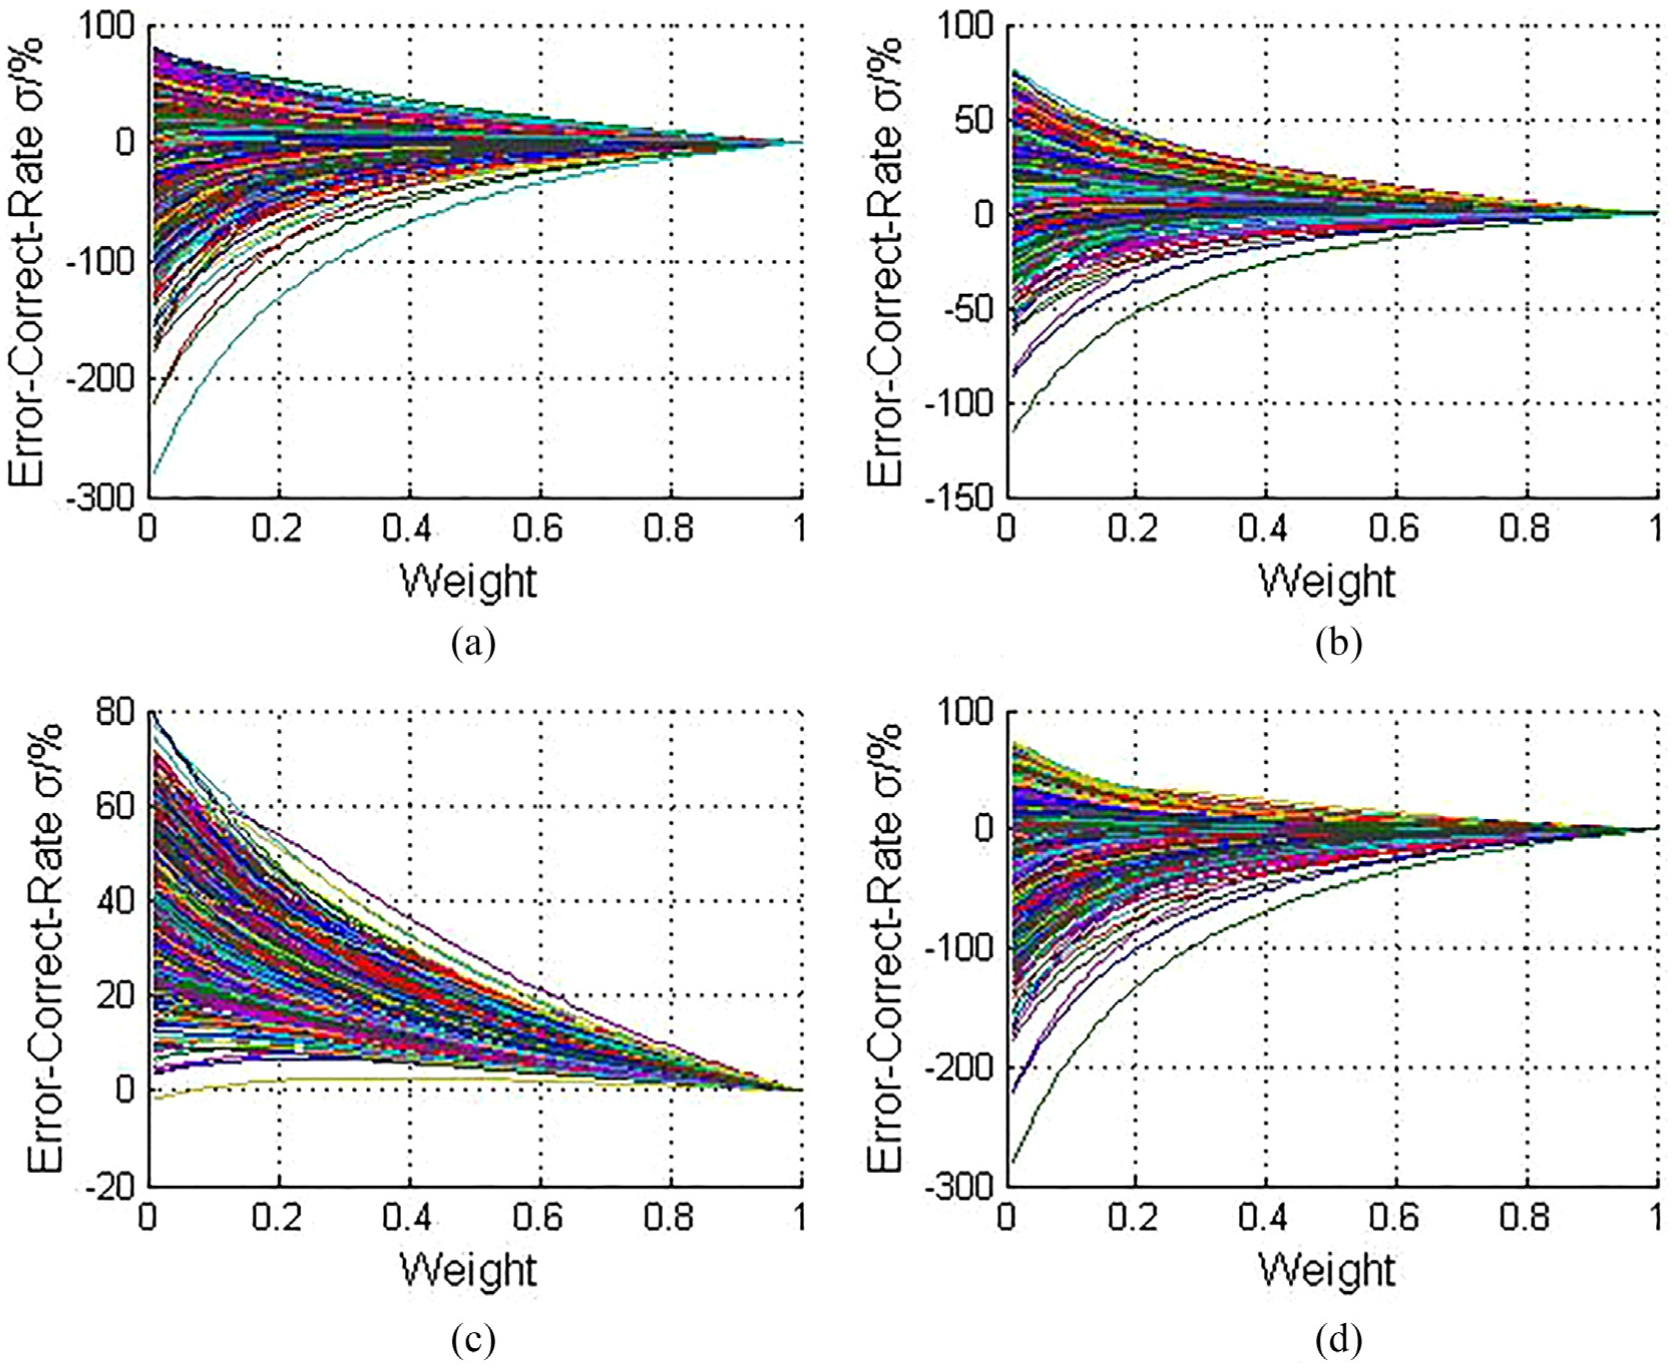
Select the two endpoints as the fixtures. An experiment with the Monte Carlo method simulated the manufacturing error in 5000 groups. The curves of the variation are all shown in (a). The variations of the average value are shown in (b). One of the endpoints has a variation in (c). The other one is shown in (d).
According to the results in Figure 7, the ECRs are not all positive values. We also recorded the variation of the ECR. Once the ECR reaches to a positive value, the virtual fixture method has an effective weighted value to evaluate the assembly performance. Thus, we investigated the average value of ECR, and the results are shown in Table 2.
The results of the Monte Carlo simulation (5000 groups).
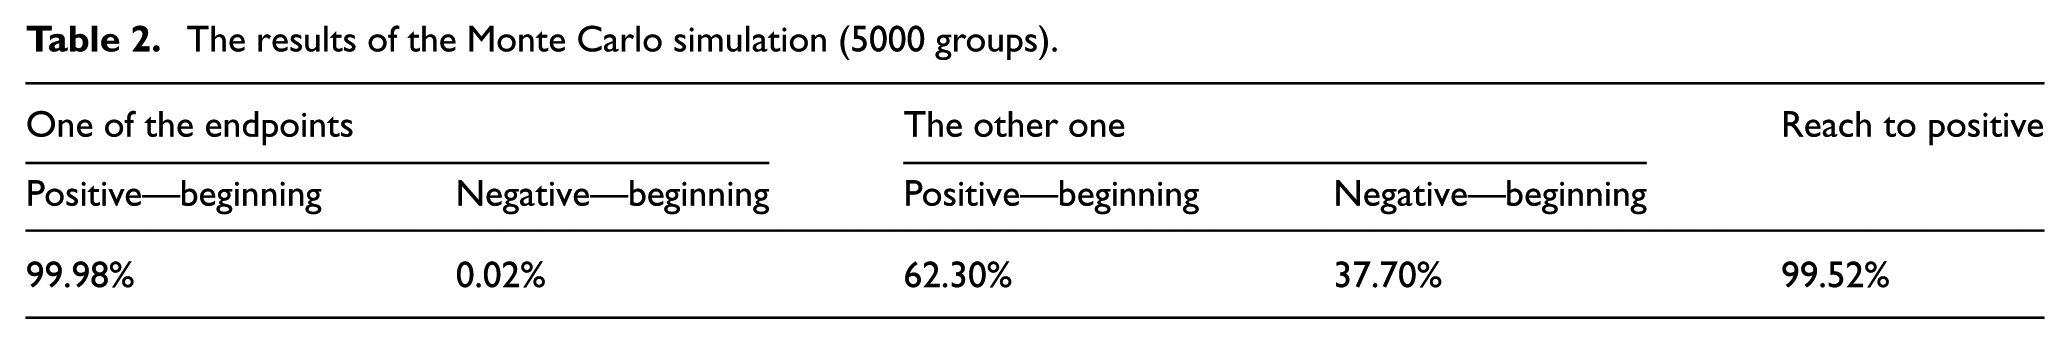
At the beginning, for one of the endpoints, 37.70% of ECRs are negative value, but a corresponding weighted value can be determined and let the ECR reach to a positive number. The results showed that 99.52% of ECR can reach to a positive value during its variation. Therefore, for most of the bend tubes, our virtual fixture method can be applied to evaluate the assembly performance.
Figure 7 and Table 2 showed a quantity of positive ECRs. However, which weighted value corresponds to the majority results can help us determine the weighted value. We recorded and investigated the distribution of the weighted values for the good correct results as Figure 8 shows.

Distribution of the weight when the ECR is a positive value.
The majority weighted values are in the range from 0 to 0.1. In theory, the smaller the value of weight, the good the outcome, but the weighted value cannot be zero in equation (3). Because the solution of the vector X could be singular. For facilitating the numerical calculation, we choose 0.1 as a normal value of weight in this article.
Simulations for evaluating tube assembly performance
The Monte Carlo simulation in section “Weight selection” shows that 99.52% of ECR can reach to a positive value. The results are based on the condition that chooses the two endpoints with the high weighted value. However, the performance of the method is ambiguity, when the chosen key points does not include or only include one endpoint of the tube. This is also common in assembly. For example, the exhaust pipe in a car, one endpoint and some curved part have an accuracy requirement in assembly. Therefore, experiments should be carried out to investigate the results of other virtual fixture selection.
We chose the same YBC data in Table 1 and eight groups of fixtures and calculated the assembly error. The selected key points are calculated with a weighted value equaling to 1. The others are 0.1. In this case, the evaluating result of each group is typical. The result is shown in Figure 9 and Table 3.

Choosing different combinations of fixtures influences the result of geometry error: (a) point 1 and point 10, (b) point 1 and point 9, (c) point 1 and point 5, (d) point 3 and point 5, (e) point 2 and point 10, (f) point 1, point 3, point 5 and point 9, (g) point 3, point 5 and point 6, and (h) point 3, point 5, point 6 and point 8.
The ECR under different combination of virtual fixtures.

ECR: error correct rate.
According to the outcome, the result is different from the suitable solution. The group c and group d have a same fixture in point 5. These two groups have only two fixtures, and one of them is the same. But the result is so different in numerical. In group c, the ECR of point 5 has a negative value about −85.37%. In the same time, the ECR of point 5 in group d has a positive value as high as 64.72%. Except these two groups, group f is compared to group h, and each group has points 3 and 5. Nevertheless, the ECR of the same point has different values. Obviously, group h has a good outcome, but group f does not.
These abnormal results being the minority or the majority are not clear. The main idea of further experiment is to find the common regulation of the situation. So, we combined the entire possible groups from two fixtures to eight fixtures based on the YBC data in Table 1. Then, we investigated all the ECR by the method presented in this article. Two quantities were calculated in this experiment, the average of the ECR and its stand value. The outcome is shown in Figure 10.
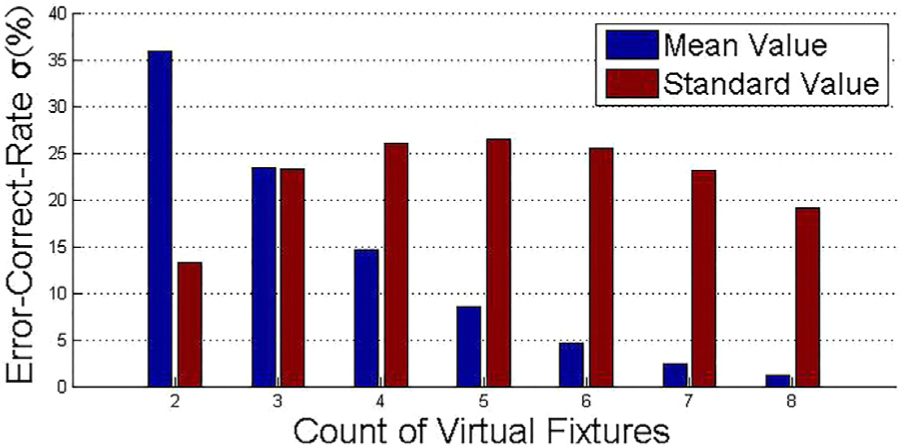
Enumerate all the fixture combinations and calculate the mean and standard value of ECR.
In each number of fixtures, two bars are shown in Figure 10. The left one for the average value of ECR, and the other is for standard deviation. Explicitly, when the fixtures are increased, the average of the rate is decreased as a geometric variation. And the variation of standard deviation increases at first and then decreases. This shape is more like a quadratic curve. This means that the ECR in a high level is usual. And the error for each combination does not have an obvious difference. But with the increasing of the fixtures, the average of rate decreases quickly.From this result, we drew three conclusions. First, the fewer the fixture, the selected point with high weighted values has a more suitable position to evaluate the assembly error. Second, the rate decreasing with the count of the fixtures is about the free degree of the limited tube. Tube is not only a 3D entity but also a rigid solid, so a tube with two fixtures still has two free degrees. To evaluate the assembly error, the fixtures should be increased and a more suitable position can also be located. The words more suitable means the adaption range. If the fixture is up to three, the adaption range is limited in only one dimension. The more the fixtures, the smaller the adaption space. Finally, the stability of ECR has a good performance in fewer fixtures or in more fixtures. The fewer fixtures made the geometry error evaluated in a high accuracy, so the stability is good. The more fixtures made the adaption space finite, so the performance of stability is also good. But the reason is totally different.
According to the further experiment, using the YBC data with error data in Table 1 of this article, the virtual fixture method is available in majority cases. And investigating the stability, we brought out some conclusions to support the method. However, the result cannot represent catholicity of the virtual fixture method. For example, in Table 3 group c and group f, the ECR of the selected points as fixtures have a minus ratio. This means the method is invalid. We considered the invalid condition is common or not. The feasibility of the method should be tested. Thus, we need more experiments to solve the problem.
Proven of feasibility by experiments
To solve the problem proposed in the last paragraph of section “Simulations for evaluating tube assembly performance,” we expanded the experiment. The statistic method is also carried out in this experiment. We generate the YBC data randomly, in which reasonability is ensured, so does the geometric error of the YBC data. The bends of tube are from 2 to 8, and each group made a repeat test in 5000 turns. Then, in a single turn, we also enumerated all the combinations and calculated the average of the ECR. And the average of the 5000 turns was also calculated. The result is shown in Figure 11.

Result of the statistic simulation.
According to Figure 11, the average of the enumeration is coverage to zero. And the shape of the curve is also similar to the shape in Figure 11; the less fixtures have a high average value. So, this experiment can prove that the virtual fixture method in this article is an available method, and the fixture can be applied in majority situations. But this conclusion is based on statistic, if the single instance is not corresponding; the measured tube is not satisfied with the design model.
Applications
Evaluation of tube assembly performance
We demonstrate two basic applications of the proposed method by two examples which are showed in Figure 3. The tube shown in Figure 3(a) is a tube from satellite, and the designed model requires two endpoints with a high accuracy for assembly. Thus, we chose the two endpoints with a weighted value of 1 and others are 0.1. After the weighted fitting calculation, the deviation of each key point is shown in Figure 12. According to the requirement of the designed model, the tolerance of two endpoints is not over 0.1 mm. Thus, the tube has a good performance in assembly.

Evaluation of the example tube from aerospace.
The other example is for the tube from automobile as shown in Figure 3(b). This tube has a requirement of high accuracy for the two endpoints and two curved parts to assemble. Thus, we chose the key points in these parts with a weighted value of 1 and others are 0.1. The deviation after fitting calculation is shown in Figure 13. According to the requirements of these key points, the selected points with high weighted value are below to the requirement. Therefore, the tube also has a good performance in assembly.

Evaluation of the example tube from automobile.
We also considered a comparison of the fitting calculation without weighted values, which can be seen as the calculation of geometric errors. The two tubes do not satisfy the assembly requirement. Actually, these tubes can be assembled successfully, but only calculating their geometric errors of these tubes cannot judge their assembly performance correctly. However, our method can evaluate the assembly performance correctly.
Strategy for fixing tube error
The virtual fixture method can also be used in tube error fixing. Commonly, the compensation of bend tube machine is obtained by last batch of production. The compensation is used in producing the next batch. This is a global correct strategy and lock of datum in evaluation. Furthermore, the datum is not taken into account in this method. According to our virtual fixture method, the compensation based on datum can be fed back. And more different from the traditional feeding back, the compensation focuses on the two end components.
The data in Table 1 are used again in this instance. Assuming that all the key points except the two endpoints are set high weighted values, eight fixtures were used in this case. The evaluation by fixtureless method and the evaluation by the virtual fixture method is shown in Figure 14.
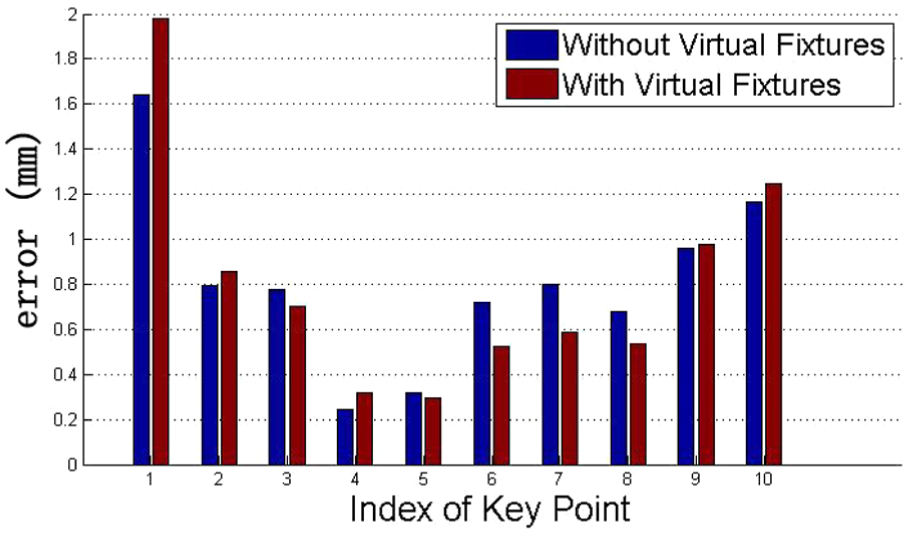
The compared results with the evaluation by fixtureless method.
To explain the outcome of Figure 14, we used two quantities of statistic. The average of the error, which are selected for fixtures, and the standard deviation of these errors were calculated in this instance. Compared with the error evaluated by fixtureless method, the variation of the average represents the difference. The standard deviation can show the overall trend of the error. Table 4 shows the result.
The error evaluated by fixtureless method and virtual fixture method.

ECR: error correct rate.
The average of error reduces in this outcome, and the deviation seems no changing. Thus, after fixing, the point with fixture is fixed and in a higher tolerance based on the selected datum. The deviation represents the basic shape of the value of error. In this instance, the shape of error is changed little.
After this processing, the error could be all accumulated in the two endpoints. So, Figure 14 shows that the assembly error by fixture method is larger than the error evaluated by fixtureless method. But the component with endpoint is freedom in correcting, especially for the bend angle. So, the correcting result is shown in Figure 15.

Comparison of the tube with fixed endpoints.
Based on datum, this method can also guide the manufacturing in springback compensation. And the characteristic of the feeding back is not only making the datum as a fundamental but also has less to correct.
Conclusion
Bend tubes are widely installed in aviation, aerospace, automobile, and other industrial machinery or equipment. The reliable assembly of these tubing directly affects the quality of the products. Because of the complexity of bend tubes’ topology and shape, current approaches cannot account for the natural manufacturing and assembly variability that occurs in assembly of bend tubes. It is easy to obtain geometric errors of a tube but cannot evaluate the assembly performance according to the geometric errors. In order to predict the accurate assembly performance and product quality, the variability of the assembled tubes must be evaluated during their measurement.
This article has pointed out two key targets in tube assembly based on the function of bend tube. To achieve the assembly targets, a method based on virtual fixture is proposed to evaluate the bend tube assembly performance. The virtual fixture is set based on the tube design model and requirement in assembly. Each virtual fixture can be represented by a weighted value in a range from 0 to 1. Then, a weighted fitting calculation is applied to evaluate the assembly performance.
Numerical experiments with Monte Carlo method are designed to simulate the method, and the weighted value is determined in 0.1. The results of experiments also showed that most of bend tube assembly performance can be evaluated by our virtual fixture method. Besides, the experiments proved the feasibility of our virtual fixture method.
Designers and manufacturing engineers can efficiently evaluate the assembly performance or judge the assembly ability of a produced tube from its geometric errors. This method not only be employed to evaluate the assembly performance of tubes from aerospace or automobile but also can be used for feeding back a compensation of springback. With this method, the feeding back is considered as a fixing based on selected key points with high weighted value. The fixed components of tube are as less as possible.
Further extensions of this work are probably to evaluate the assembly performance of flexible tubular such as cables or soft tubing. This method could also be embedded with force analysis to evaluate flexible tubes.
Footnotes
Handling Editor: Jining Sun
Declaration of conflicting interests
The author(s) declared no potential conflicts of interest with respect to the research, authorship, and/or publication of this article.
Funding
The author(s) disclosed receipt of the following financial support for the research, authorship, and/or publication of this article: This work has been funded by National Natural Science Foundation of China (NSFC, 51305031).