
Abstract
The main transmission system, the key component for transferring energy in machine tools, is essential for studying the energy efficiency of machine tools, highlighting the need for manufacturers to measure the input power of the main transmission system to develop energy-saving technology. In response to such a need, this article proposes a new approach that can be applied to calculate the input power of the main transmission system fed by a converter. To develop this approach, the influences of the converter and frequency variations on motor loss are analyzed to build the idle and loaded loss motor models for manufacturers. Based on these two models, the relationships between the input power of the main transmission system, the motor, and its frequency are investigated to establish a calculation approach that is convenient because only the motor input power measurement is required. Finally, 20 group experiments are conducted to validate the proposed approach, and its applications are discussed. The applications demonstrate that this method provides a high level of accuracy and validity for calculating the input power of the main transmission system driven by a converter and could be widely used to study high-efficiency machine tools and monitor the energy efficiency of machine tools.
Introduction
Improving energy efficiency in manufacturing systems is vital to achieving critical global targets in energy efficiency via low-carbon and low-emissions operations.1,2 Many strategies have been specified through rules of conduct and legal directives to promote energy efficiency. 3 Two examples are the regulatory frameworks European 2020 and European 2030, which aim to improve energy efficiency by 20% by 2020 and 27% by 2030, respectively. 4 Machine tools, as the key manufacturing equipment of machining systems, are abundant 5 and consume substantial amounts of energy with low efficiency during the manufacturing process.6,7 Thus, research on the energy efficiency of machine tools is critical. For instance, the International Organization for Standardization (ISO) published the ISO 14955-1:2014 8 international standard, which focuses on design methodologies for energy-efficient machine tools. Similarly, the European Commission has issued the Ecodesign 9 directive, which seeks to develop green machine tools. Therefore, improving the energy efficiency of machine tools has been an important strategy for sustainable manufacturing.
The energy efficiency of machine tools has been extensively studied and reported to date. The efforts can be largely divided into the following three categories. (1) Energy consumption modeling and assessment: studies at this level are designed to know where to apply energy-saving technologies and how much energy reduction is needed. For example, Kara and Li 10 established the specific energy consumption (SEC) model and found that the energy requirement of machining processes was inversely proportional to the material removal rate (MRR); Schudeleit et al. 11 described and compared four general energy efficiency evaluation methods and explicitly recommended the component benchmark method for machine tool design purposes. Therefore, both energy consumption models of machine tools and their components consumption models are important for assessing the energy efficiency of machine tools. 12 (2) Energy efficiency monitoring and management: in this category, energy efficiency on-line acquisition, energy efficiency prediction, and multi-objective optimization problems are discussed to provide essential support to the high-efficiency working of machine tools. 13 Hu et al. 14 developed an energy monitoring method and systems for machine tools fed by a variable speed drive (VSD). However, due to structural limitations, this method cannot be easily applied to certain machine tools on which a cutting–measuring instrument cannot be installed. Liu et al. 15 developed an on-line monitoring method for the energy efficiency of machine tools using the component energy transmission model in the spindle system. Although this method cannot be applied on certain machine tools fed by a VSD, it provides an idea for the acquisition of energy efficiency. (3) Design high-efficiency machine tools: in this category, lightweight component and high-efficiency component selection are investigated. 16 For instance, Kroll et al. 17 investigated the effects of lightweight components on machine tools and summarized lightweight strategies and effects. Chen et al. 18 investigated the structural design of machine tools reformed with artificial granite material. Meanwhile, the energy consumption modeling of components can provide technical support for engineers to select high-efficiency components in the machine tool design stage. 16 Therefore, the energy consumption modeling and assessment, energy monitoring and management of components, and selection of high-efficiency components are essential to achieving energy-efficient machine tools.
As the key component for transferring energy in machine tools, the main transmission system (MTS) is essential for studying the tools’ energy efficiency. However, because the MTS and motor are integrated into machine tools during the assembly phase, it is difficult for machine tool users to measure the input power of the MTS, which is essential for calculating the energy efficiency of the motor, MTS, and machine tools. Many years ago, Liu and Xu 19 proposed the Loss Kload rate Power (LKP) method to calculate the input power of the MTS fed by normal power. Based on LKP, Liu et al. 20 established a method to separate the power information of the spindle system during the machining process that can be widely applied to monitor and assess the energy consumption and efficiency of the spindle system and its components. However, with the application of electrical VSDs in the machine tool field, the LKP method19,20 cannot be applied to calculate the input power of the MTS fed by a converter because the power loss of a motor driven by a converter is a function of the power frequency and not a constant, as considered in the LKP method. To solve this problem, Shi 21 investigated the base frequency loss of the spindle motor and the harmonic loss caused by the converter in machine tools; however, they did not establish the relationship between the power loss of the MTS and the spindle motor. Based on Shi’s studies, Hu et al. 22 studied the load loss characteristics of the MTS and motor to determine the relationship between the input power of the MTS and the motor by conducting numerous cutting experiments. It is not convenient for machine tool users because cutting-force-measuring instruments are required, and it is time-consuming to install sensors and perform experiments.
In conclusion, previous studies have addressed the problem of calculating the input power of a MTS driven by normal power but have not considered MTSs fed by a converter. Specifically, the following issues have not been elucidated: (1) the influence of the converter and frequency variations on spindle motor loss and (2) the relationships between the input power of the MTS, the input power of the motor, and frequency. This article aims to address those deficiencies to develop a new approach for calculating the input power of the MTS that will have wider applicability for MTSs fed by a converter.
Model for calculating the input power of the MTS
The spindle system, which is the power source for machining, has complex energy consumption and energy transmission characteristics, which are shown in Figure 1. In this figure,
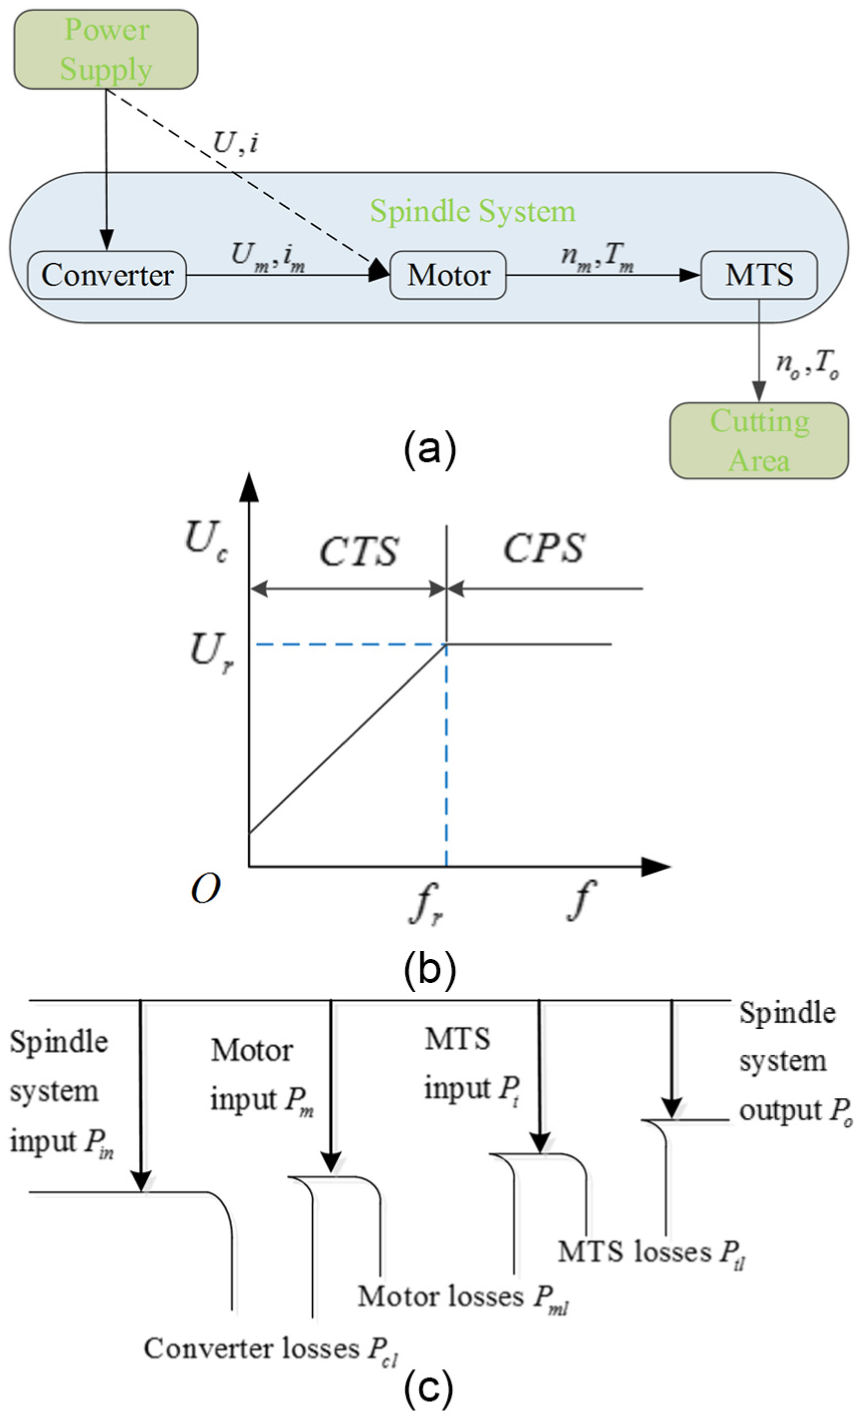
(a) Schematic of the inputs and outputs of the spindle system, (b) Schematic of the inputs voltage of the spindle motor and (c) Schematic of power transmission in the spindle system.
As shown in Figure 1, because of the use of a VSD in motors, 23 the input voltage and current of a motor driven by a frequency converter is a function of the power frequency24,25 (illustrated in equation (1a)), which is different if the motor is fed by normal power directly (detailed in equation (1b) and Figure 1(b))


where
Thus, because of frequency variations, the motor loss (such as idle loss) is variable and not a constant, as considered by Liu et al. 15 Therefore, to calculate the input power of the MTS, a new method (as shown in Figure 2) with respect to the frequency variation caused by a converter is required.
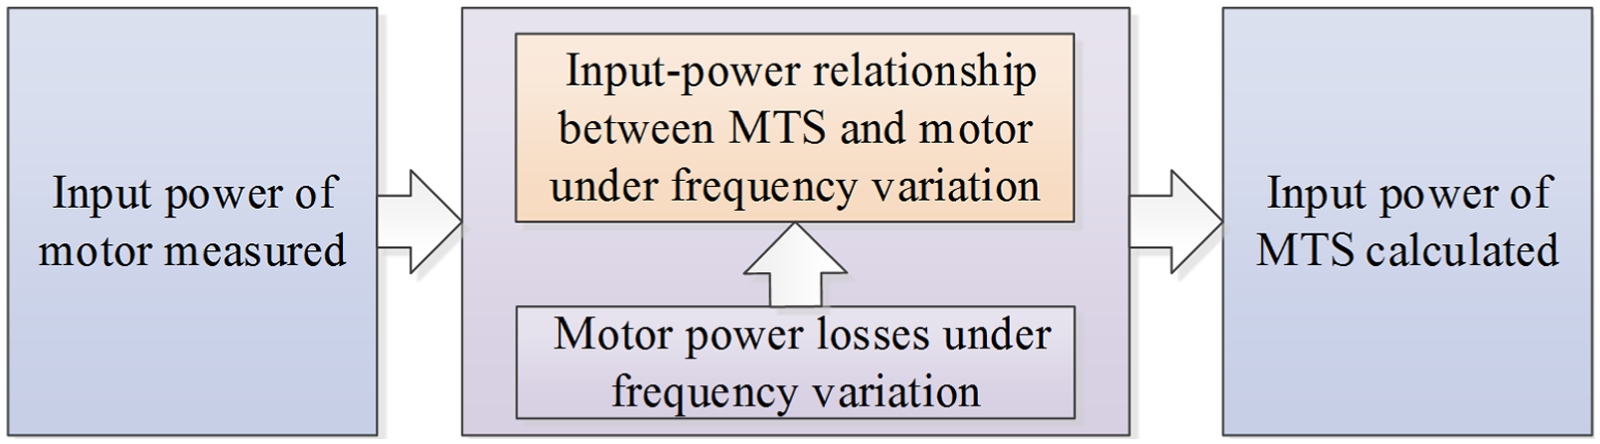
Flowchart of the proposed method for calculating the input power of an MTS.
Due to the structural limitations of machine tools, it is difficult for users in the workshop to measure the output speed and torque of the motor (which can be used to calculate the input power of the MTS by formula

The power loss model of a motor driven by a converter is critical for calculating MTS input power.
Therefore, there are three stages of developing the new approach for calculating the input power of MTSs. First, the influence of the converter and frequency variations on the motor loss must be considered, and the quantitative relationship model between the input power of the MTS and motor loss must be established. Second, the quantitative relationship model between the input power of the MTS, the motor input power, and the frequency of the motor must be established (PPF model). Finally, the input power calculation for the MTS can be proposed based on the PPF model.
Toward machine tool users: modeling motor loss
The motor has complex power loss characteristics that are composed of copper loss, core loss, friction loss, windage loss, and stray loss. 23 Many previous studies have focused on motor loss. For example, Hildebrand and Roehrdanz 24 investigated a loss calculation model based on the structural parameters of a motor, such as the height and width of the stator tooth. Machine tool users only have motor nameplate information and do not have motor structural data. Therefore, the existing method is rarely applied to calculate the input power of the MTS in machine tools. From another perspective, the input power of the MTS is considerably larger than the motor loss; thus, there has been no requirement to develop a precise model for calculating motor loss in machine tools.
Therefore, an approximate estimation model for calculating the power loss of the motor fed by a converter is developed for machine tool users, as described below.
Based on the existing studies, motor loss can be divided into idle loss

A previous study 25 reviewed the difference in motor loss between a motor fed by a converter and normal power. According to that study, the loss caused by a converter is highly complex, but it is irrelevant to the motor load. Thus, it is regarded as a portion of the idle loss, and the idle loss and variable loss can be expressed as


where
Then, the estimation model for idle loss and loaded loss are developed as detailed below.
Idle loss
The rotor current is relatively small and is omitted when the motor is unloaded; then, the fixed loss can be expressed as follows
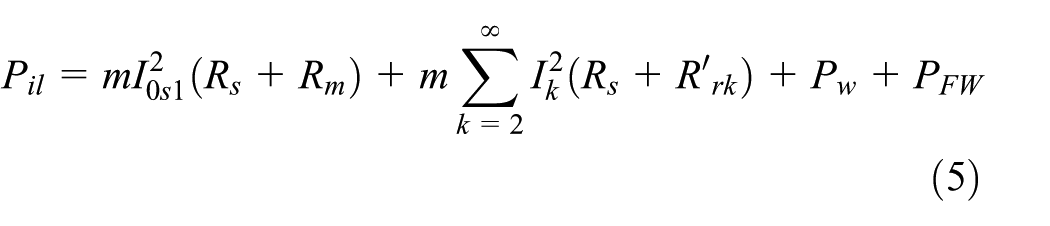
Because

where M is a constant. 26
Then, the expression for fixed loss is

In this article, the friction and windage loss
In the CPS

where
In the CTS

When the motor works on the minimum allowed frequency, the friction and windage loss and the eddy current loss are sufficiently small to be neglected. Therefore, the following relation is obtained:

According to equation (11), the idle loss of a motor in other frequencies can be determined by its idle loss under the minimum and rated frequency.
Loaded loss
When a motor is loaded, the rotor current

where
Combining equation (12) with equation (4) yields the following

When the motor is operating under the rated condition,

Then, the variable loss can be expressed as

Thus, in the CPS

and in the CTS
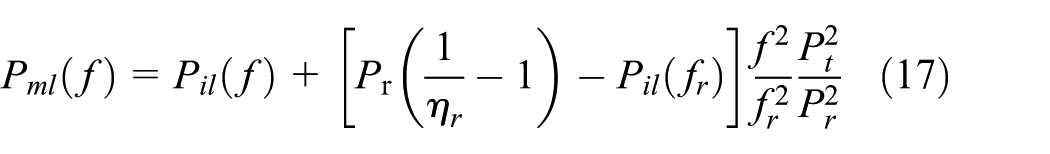
Let
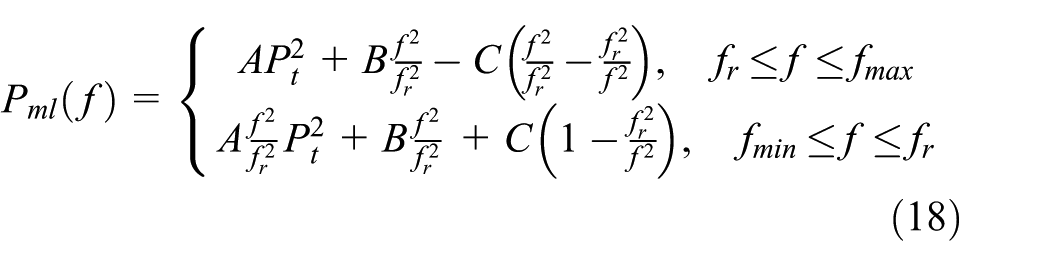
According to equation (18), the motor loss driven by a converter can be determined by the input power of the MTS, the frequency, and the basic data
Equation (18) can provide a new way to investigate the comparison between electrical and mechanical losses under various conditions that have also been studied in the literature.27,28
Input power relationship between the MTS and motor
According to Figure 1, when the motor frequency is

The quantitative relationships among the input power of the MTS


According to the one-to-one relationships between the motor frequency, motor speed, and spindle speed, the relationship


Calculation approach
According to equations (20) and (21), the PPF model is composed of the input power of the motor
Step 1. Preparation for basic data. Obtain the basic data, including
Step 2. Measure the input power of motor by power meter.
Step 3. Combine with the motor frequency, calculate the input power of MTS using equations (20) and (21).
Those basic data (nameplate values of the motor and its idle loss under minimum and rated frequencies) in procedures are available for machine tool users via specification books or predictions. After obtaining basic data during the preparation stage, the only necessary steps are to measure the input power of the motor and combine it with the frequency or speed of the motor, which is convenient for machine tool users. According to equations (22) and (23), the motor speed and spindle speed can be used as substitutes for the motor frequency.
This approach is based on the acquisition of the motor input power
Verification
Experimental methods and apparatus
Because the MTS and motor are integrated in machine tools during the assembly phase, it is difficult for machine tool users to install sensors on the input terminal of the MTS. To validate the proposed PPF approach, the converter and motor of the machine tools are employed to form a new testing platform (see Figure 3) with the help of Chongqing Machine Tools Works Co., Ltd, China. The input power of the MTS is also the output power of the motor; thus, only the output power of the motor needs to be tested.

Experimental apparatus.
As shown in Figure 3, a 7.5-kW ABB motor (QABP132M4A) is driven by a Siemens MM440 converter and loaded by a CZ20-type magnetic powder brake and ZH07-B-type torque speed sensor. The HIOKI3390C power analyzer is used to measure the input power of the motor. The nameplate values of the QABP132M4A motor are as follows:
Accuracy analysis
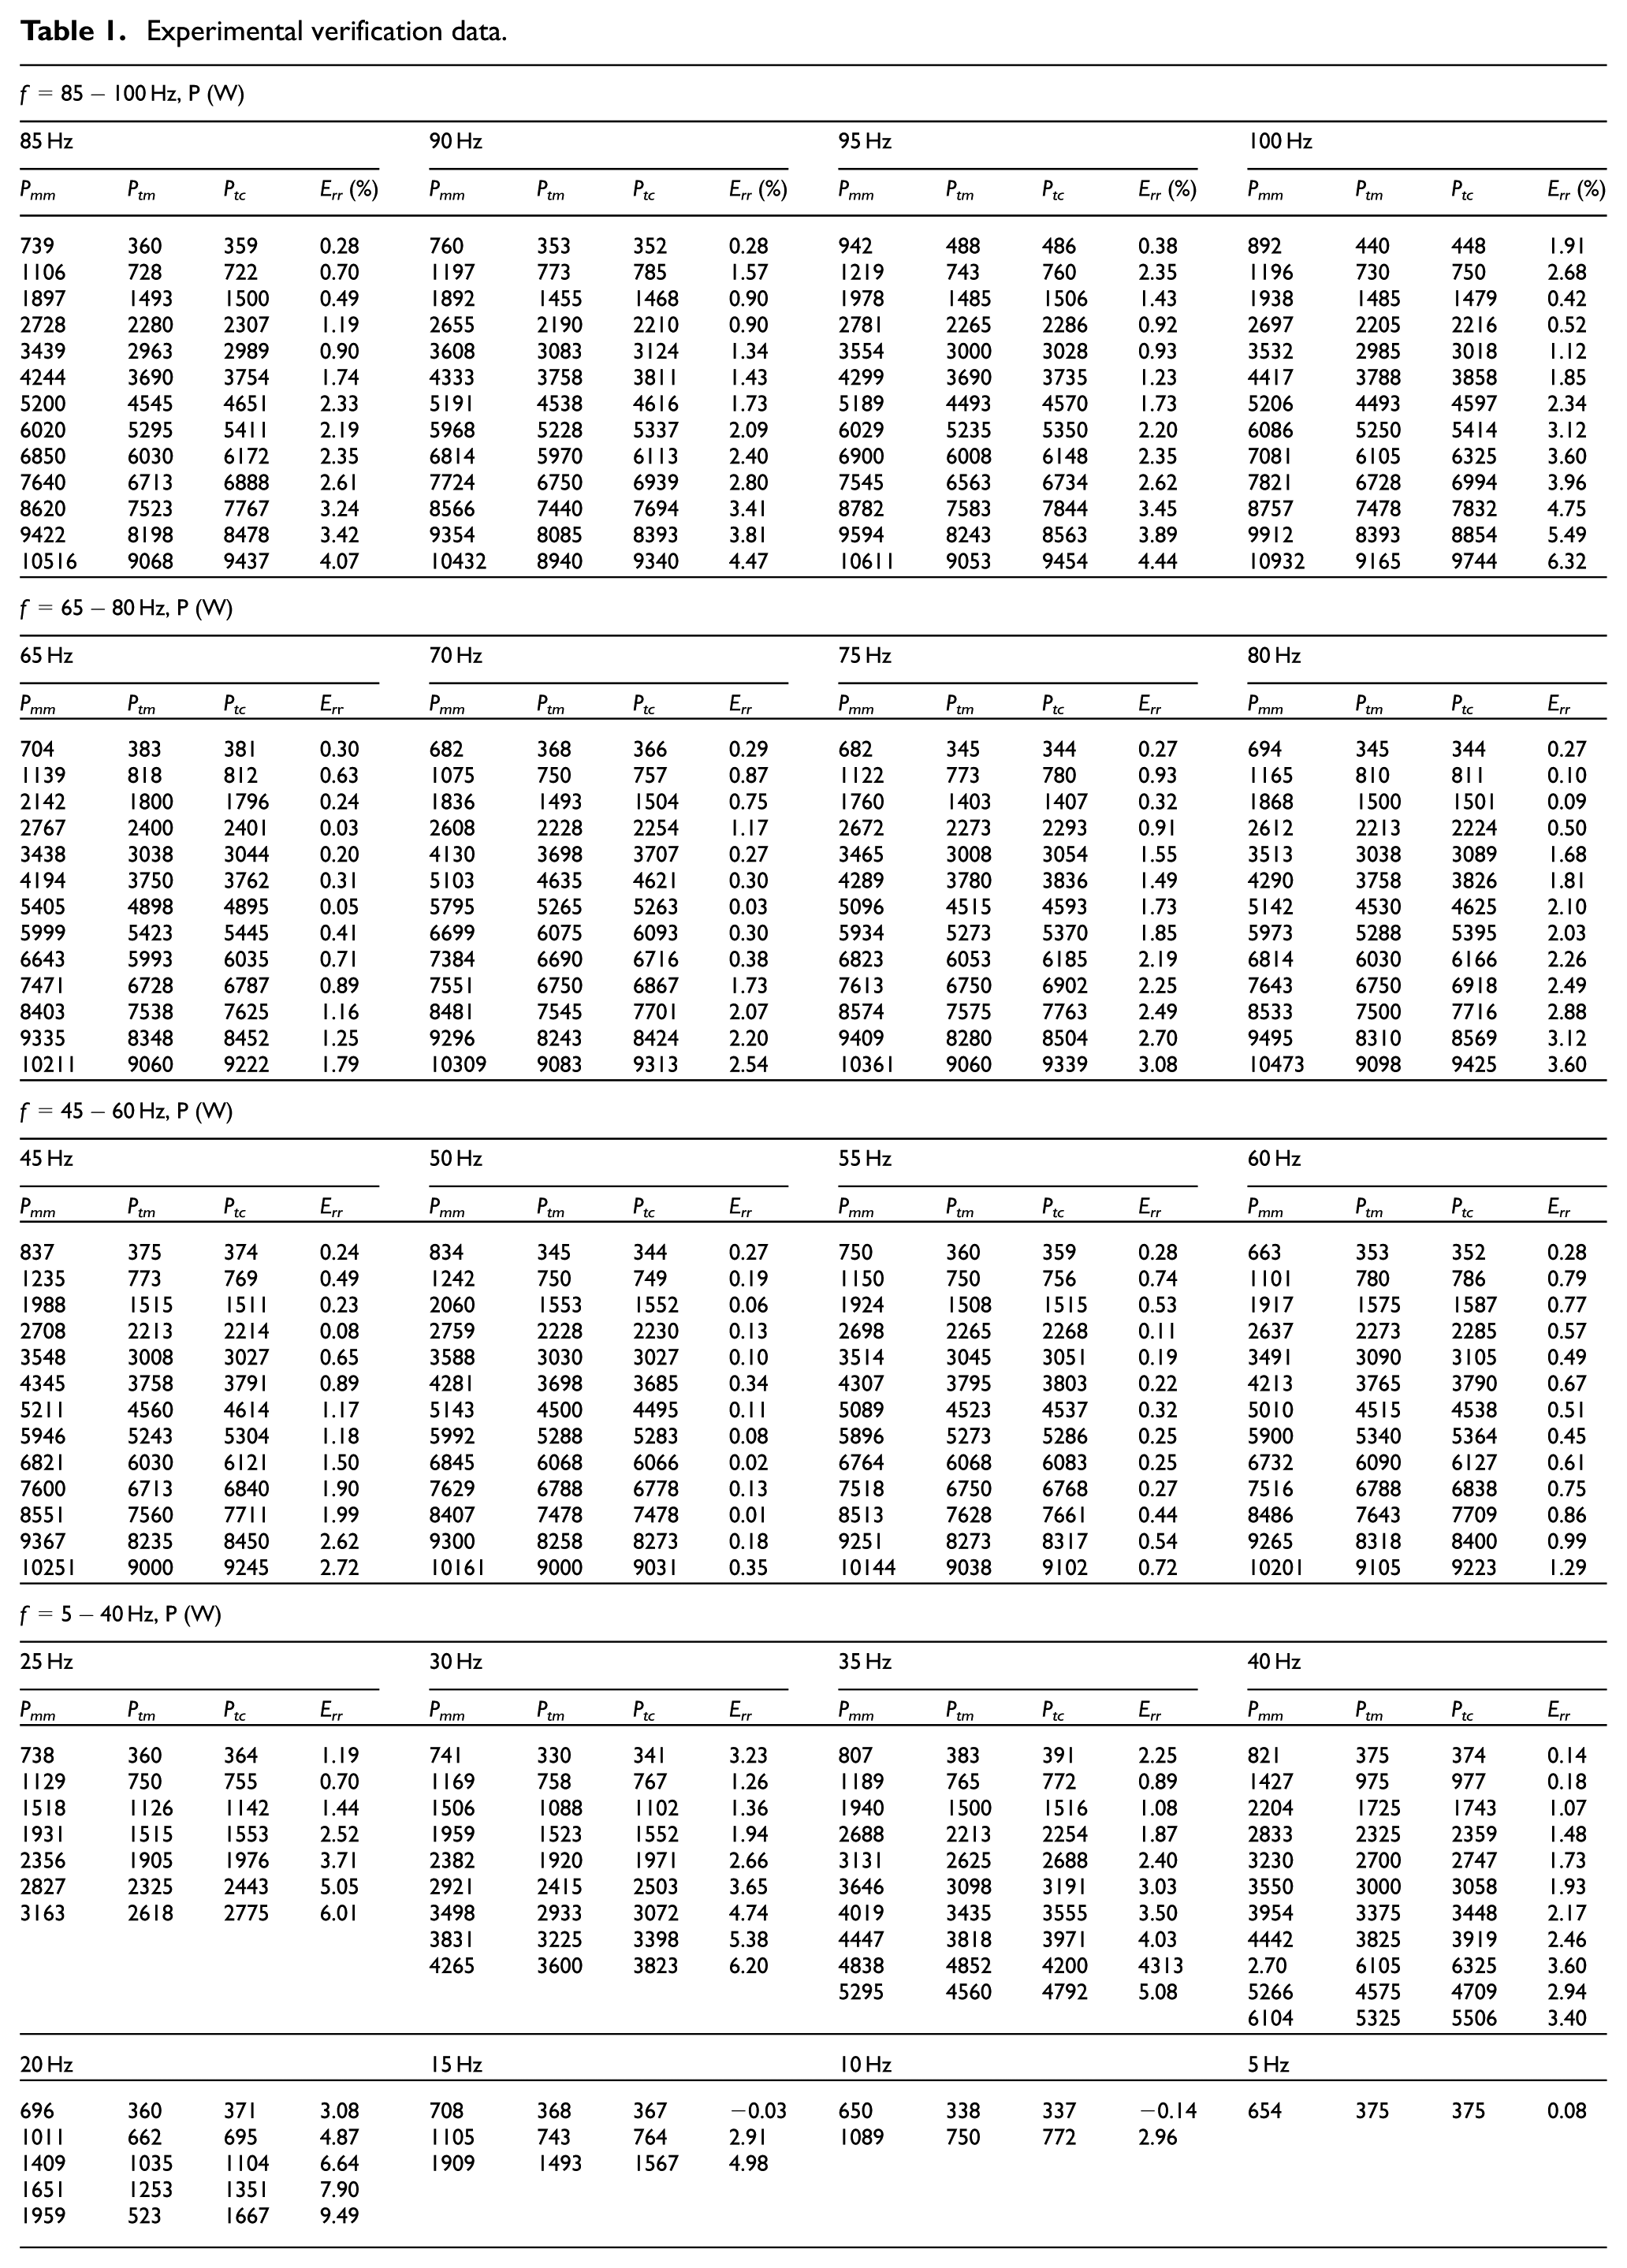
Motor load experiments with 20 different frequencies were conducted to investigate the accuracy and validity of the PPF approach. The experimental results are illustrated in Appendix 1, where

Accuracy of the PPF approach (a) power loss of the motor at 50 Hz and (b) transient input power of the MTS at 50 Hz.
Although there are small fluctuations in the transient input power of the motor, the PPF method is excellent for calculating the input power of the MTS by measuring the input power of the motor.
Furthermore, the power loss of the motor calculated by PPF is smaller than the measured value, and the input power of the MTS calculated by PPF is considerably greater than the measured value in Figure 4(a) and Appendix 1 when the motor is under a low frequency or in the overload state. This trend occurs because the PPF method is developed by investigating and formulating the power loss characteristics of the motor under a regular or commonly used state, and those characteristics change dramatically when the motor is working under a low frequency and in the overload state. 25 For example, the mechanical loss of the motor will increase dramatically if the motor output torque is over its rated value. As a result, the PPF method underestimates the power loss of the motor under low frequencies and in the overload state, and the input power of the MTS is overestimated in those cases. Thus, the error will increase when the motor is working under low frequencies or in the overload state.
The statistical results of the relative errors presented in Appendix 1 are shown in Figure 5, indicating that 84.13% of the errors are under 3%, and over 95% of the errors are under 5%.

Chart of the relative errors.
Therefore, although certain estimated models in the electrical field calculate the power loss of the motor, because the spindle motors of machine tools rarely working under low frequencies or in the overload state, the accuracy of the PPF method is acceptable in the mechanical field.
Application and discussion
The proposed PPF approach for calculating the input power of the MTS is available and convenient for machine tool users because only the motor input power is required, allowing a greater and wider practicability than the methods proposed by Liu et al. 20 and Hu et al. 22 Furthermore, the method can be implemented without any use of a torque (or moment) sensor, as is required in the traditional method. Furthermore, the PPF method can be widely used to study the energy efficiency and energy-saving technologies of machine tools, as discussed below:
1. The PPF method can be used to study the energy efficiency of machine tools and their components. Figures 4 and 5 illustrate that the PPF method provides a high level of accuracy and validity for calculating the input power of the MTS. In addition, F Liu 15 established a method for calculating the power loss of the MTS. According to Figure 1

Then, the expressions for the energy efficiency of machine tools, the spindle motor, and the MTS are as follows


where
Therefore, the input power of the machine tool MTS is essential for calculating the energy efficiency of machine tools, the spindle motor, and the MTS. The PPF method can be used to study the energy efficiency of machine tools and their components.
2. The PPF method can be used to study machine tool energy-saving technologies, including energy saving in the use of machine tools and the design of high-efficiency machine tools. 12 As the main energy consumption component of the machine tool spindle unit, the spindle unit is an important consideration when investigating the energy-saving technologies of machine tools.29,30 According to equation (26)


Contour map of the QABP132M4A motor energy efficiency.
For manufacturers of machine tools, high-efficiency motors are required to design high-efficiency machine tools. Assume that there are N different total motors from which to choose. If the motor working conditions
Therefore, the PPF method can be used to obtain the optimal working frequency and working torque of a motor, which can be used to determine the optimal machine tool working frequency and working torque as well as to select the spindle motors for designing high-efficiency machine tools.
The proposed PPF approach can be applied for machines to calculate the input power of the MTS (the same as the output power of the motor) fed by a converter if those machines, including milling and grinding, have the structure shown in Figure 1. However, it may be difficult to apply the PPF approach if the input power of the motor cannot be measured due to the physical structure of the machine tools. An improved approach may be required to address this deficiency by establishing the relationship model between the input power of a converter and the MTS.
Conclusion
This article presented a new approach (PPF) for calculating the input power of the MTS of machine tools. The influences of the converter and frequency variations on the motor loss were considered in developing this approach. Three input power models of the MTS and motor loss were established based on the nameplate values of the motor and its idle loss under the minimum and rated frequencies. These models include the model that describes the relationship between the idle loss of the motor and frequency, the motor loss model that can be used to determine the motor power loss using the input power of the MTS and frequency, and the PPF model that describes the relationship between the input power of the MTS, the frequency, and the input power of the motor.
A total of 20 group experiments were conducted to validate the proposed approach, and the applications of the PPF method were discussed. To calculate the input power of the machine tool MTS, the PPF method need to measure only the input power of the motor after obtaining basic motor data in the preparation stage. The verification and applications demonstrate that this method provides a high level of accuracy and validity for calculating the input power of an MTS driven by a converter and can be widely used to study the energy efficiency and energy-saving technologies of machine tools. Based on this study, future research will investigate high-efficiency machine tools and energy efficiency monitoring of machine tools.
Footnotes
Appendix 1
Experimental verification data.
|
|
|||||||||||||||
|---|---|---|---|---|---|---|---|---|---|---|---|---|---|---|---|
| 85 Hz | 90 Hz | 95 Hz | 100 Hz | ||||||||||||
| Pmm | Ptm | Ptc | Err (%) | Pmm | Ptm | Ptc | Err (%) | Pmm | Ptm | Ptc | Err (%) | Pmm | Ptm | Ptc | Err (%) |
| 739 | 360 | 359 | 0.28 | 760 | 353 | 352 | 0.28 | 942 | 488 | 486 | 0.38 | 892 | 440 | 448 | 1.91 |
| 1106 | 728 | 722 | 0.70 | 1197 | 773 | 785 | 1.57 | 1219 | 743 | 760 | 2.35 | 1196 | 730 | 750 | 2.68 |
| 1897 | 1493 | 1500 | 0.49 | 1892 | 1455 | 1468 | 0.90 | 1978 | 1485 | 1506 | 1.43 | 1938 | 1485 | 1479 | 0.42 |
| 2728 | 2280 | 2307 | 1.19 | 2655 | 2190 | 2210 | 0.90 | 2781 | 2265 | 2286 | 0.92 | 2697 | 2205 | 2216 | 0.52 |
| 3439 | 2963 | 2989 | 0.90 | 3608 | 3083 | 3124 | 1.34 | 3554 | 3000 | 3028 | 0.93 | 3532 | 2985 | 3018 | 1.12 |
| 4244 | 3690 | 3754 | 1.74 | 4333 | 3758 | 3811 | 1.43 | 4299 | 3690 | 3735 | 1.23 | 4417 | 3788 | 3858 | 1.85 |
| 5200 | 4545 | 4651 | 2.33 | 5191 | 4538 | 4616 | 1.73 | 5189 | 4493 | 4570 | 1.73 | 5206 | 4493 | 4597 | 2.34 |
| 6020 | 5295 | 5411 | 2.19 | 5968 | 5228 | 5337 | 2.09 | 6029 | 5235 | 5350 | 2.20 | 6086 | 5250 | 5414 | 3.12 |
| 6850 | 6030 | 6172 | 2.35 | 6814 | 5970 | 6113 | 2.40 | 6900 | 6008 | 6148 | 2.35 | 7081 | 6105 | 6325 | 3.60 |
| 7640 | 6713 | 6888 | 2.61 | 7724 | 6750 | 6939 | 2.80 | 7545 | 6563 | 6734 | 2.62 | 7821 | 6728 | 6994 | 3.96 |
| 8620 | 7523 | 7767 | 3.24 | 8566 | 7440 | 7694 | 3.41 | 8782 | 7583 | 7844 | 3.45 | 8757 | 7478 | 7832 | 4.75 |
| 9422 | 8198 | 8478 | 3.42 | 9354 | 8085 | 8393 | 3.81 | 9594 | 8243 | 8563 | 3.89 | 9912 | 8393 | 8854 | 5.49 |
| 10516 | 9068 | 9437 | 4.07 | 10432 | 8940 | 9340 | 4.47 | 10611 | 9053 | 9454 | 4.44 | 10932 | 9165 | 9744 | 6.32 |
|
|
|||||||||||||||
| 65 Hz | 70 Hz | 75 Hz | 80 Hz | ||||||||||||
| Pmm | Ptm | Ptc | Er r | Pmm | Ptm | Ptc | Err | Pmm | Ptm | Ptc | Err | Pmm | Ptm | Ptc | Err |
| 704 | 383 | 381 | 0.30 | 682 | 368 | 366 | 0.29 | 682 | 345 | 344 | 0.27 | 694 | 345 | 344 | 0.27 |
| 1139 | 818 | 812 | 0.63 | 1075 | 750 | 757 | 0.87 | 1122 | 773 | 780 | 0.93 | 1165 | 810 | 811 | 0.10 |
| 2142 | 1800 | 1796 | 0.24 | 1836 | 1493 | 1504 | 0.75 | 1760 | 1403 | 1407 | 0.32 | 1868 | 1500 | 1501 | 0.09 |
| 2767 | 2400 | 2401 | 0.03 | 2608 | 2228 | 2254 | 1.17 | 2672 | 2273 | 2293 | 0.91 | 2612 | 2213 | 2224 | 0.50 |
| 3438 | 3038 | 3044 | 0.20 | 4130 | 3698 | 3707 | 0.27 | 3465 | 3008 | 3054 | 1.55 | 3513 | 3038 | 3089 | 1.68 |
| 4194 | 3750 | 3762 | 0.31 | 5103 | 4635 | 4621 | 0.30 | 4289 | 3780 | 3836 | 1.49 | 4290 | 3758 | 3826 | 1.81 |
| 5405 | 4898 | 4895 | 0.05 | 5795 | 5265 | 5263 | 0.03 | 5096 | 4515 | 4593 | 1.73 | 5142 | 4530 | 4625 | 2.10 |
| 5999 | 5423 | 5445 | 0.41 | 6699 | 6075 | 6093 | 0.30 | 5934 | 5273 | 5370 | 1.85 | 5973 | 5288 | 5395 | 2.03 |
| 6643 | 5993 | 6035 | 0.71 | 7384 | 6690 | 6716 | 0.38 | 6823 | 6053 | 6185 | 2.19 | 6814 | 6030 | 6166 | 2.26 |
| 7471 | 6728 | 6787 | 0.89 | 7551 | 6750 | 6867 | 1.73 | 7613 | 6750 | 6902 | 2.25 | 7643 | 6750 | 6918 | 2.49 |
| 8403 | 7538 | 7625 | 1.16 | 8481 | 7545 | 7701 | 2.07 | 8574 | 7575 | 7763 | 2.49 | 8533 | 7500 | 7716 | 2.88 |
| 9335 | 8348 | 8452 | 1.25 | 9296 | 8243 | 8424 | 2.20 | 9409 | 8280 | 8504 | 2.70 | 9495 | 8310 | 8569 | 3.12 |
| 10211 | 9060 | 9222 | 1.79 | 10309 | 9083 | 9313 | 2.54 | 10361 | 9060 | 9339 | 3.08 | 10473 | 9098 | 9425 | 3.60 |
|
|
|||||||||||||||
| 45 Hz | 50 Hz | 55 Hz | 60 Hz | ||||||||||||
| Pmm | Ptm | Ptc | Err | Pmm | Ptm | Ptc | Err | Pmm | Ptm | Ptc | Err | Pmm | Ptm | Ptc | Err |
| 837 | 375 | 374 | 0.24 | 834 | 345 | 344 | 0.27 | 750 | 360 | 359 | 0.28 | 663 | 353 | 352 | 0.28 |
| 1235 | 773 | 769 | 0.49 | 1242 | 750 | 749 | 0.19 | 1150 | 750 | 756 | 0.74 | 1101 | 780 | 786 | 0.79 |
| 1988 | 1515 | 1511 | 0.23 | 2060 | 1553 | 1552 | 0.06 | 1924 | 1508 | 1515 | 0.53 | 1917 | 1575 | 1587 | 0.77 |
| 2708 | 2213 | 2214 | 0.08 | 2759 | 2228 | 2230 | 0.13 | 2698 | 2265 | 2268 | 0.11 | 2637 | 2273 | 2285 | 0.57 |
| 3548 | 3008 | 3027 | 0.65 | 3588 | 3030 | 3027 | 0.10 | 3514 | 3045 | 3051 | 0.19 | 3491 | 3090 | 3105 | 0.49 |
| 4345 | 3758 | 3791 | 0.89 | 4281 | 3698 | 3685 | 0.34 | 4307 | 3795 | 3803 | 0.22 | 4213 | 3765 | 3790 | 0.67 |
| 5211 | 4560 | 4614 | 1.17 | 5143 | 4500 | 4495 | 0.11 | 5089 | 4523 | 4537 | 0.32 | 5010 | 4515 | 4538 | 0.51 |
| 5946 | 5243 | 5304 | 1.18 | 5992 | 5288 | 5283 | 0.08 | 5896 | 5273 | 5286 | 0.25 | 5900 | 5340 | 5364 | 0.45 |
| 6821 | 6030 | 6121 | 1.50 | 6845 | 6068 | 6066 | 0.02 | 6764 | 6068 | 6083 | 0.25 | 6732 | 6090 | 6127 | 0.61 |
| 7600 | 6713 | 6840 | 1.90 | 7629 | 6788 | 6778 | 0.13 | 7518 | 6750 | 6768 | 0.27 | 7516 | 6788 | 6838 | 0.75 |
| 8551 | 7560 | 7711 | 1.99 | 8407 | 7478 | 7478 | 0.01 | 8513 | 7628 | 7661 | 0.44 | 8486 | 7643 | 7709 | 0.86 |
| 9367 | 8235 | 8450 | 2.62 | 9300 | 8258 | 8273 | 0.18 | 9251 | 8273 | 8317 | 0.54 | 9265 | 8318 | 8400 | 0.99 |
| 10251 | 9000 | 9245 | 2.72 | 10161 | 9000 | 9031 | 0.35 | 10144 | 9038 | 9102 | 0.72 | 10201 | 9105 | 9223 | 1.29 |
|
|
|||||||||||||||
| 25 Hz | 30 Hz | 35 Hz | 40 Hz | ||||||||||||
| Pmm | Ptm | Ptc | Err | Pmm | Ptm | Ptc | Err | Pmm | Ptm | Ptc | Err | Pmm | Ptm | Ptc | Err |
| 738 | 360 | 364 | 1.19 | 741 | 330 | 341 | 3.23 | 807 | 383 | 391 | 2.25 | 821 | 375 | 374 | 0.14 |
| 1129 | 750 | 755 | 0.70 | 1169 | 758 | 767 | 1.26 | 1189 | 765 | 772 | 0.89 | 1427 | 975 | 977 | 0.18 |
| 1518 | 1126 | 1142 | 1.44 | 1506 | 1088 | 1102 | 1.36 | 1940 | 1500 | 1516 | 1.08 | 2204 | 1725 | 1743 | 1.07 |
| 1931 | 1515 | 1553 | 2.52 | 1959 | 1523 | 1552 | 1.94 | 2688 | 2213 | 2254 | 1.87 | 2833 | 2325 | 2359 | 1.48 |
| 2356 | 1905 | 1976 | 3.71 | 2382 | 1920 | 1971 | 2.66 | 3131 | 2625 | 2688 | 2.40 | 3230 | 2700 | 2747 | 1.73 |
| 2827 | 2325 | 2443 | 5.05 | 2921 | 2415 | 2503 | 3.65 | 3646 | 3098 | 3191 | 3.03 | 3550 | 3000 | 3058 | 1.93 |
| 3163 | 2618 | 2775 | 6.01 | 3498 | 2933 | 3072 | 4.74 | 4019 | 3435 | 3555 | 3.50 | 3954 | 3375 | 3448 | 2.17 |
| 3831 | 3225 | 3398 | 5.38 | 4447 | 3818 | 3971 | 4.03 | 4442 | 3825 | 3919 | 2.46 | ||||
| 4265 | 3600 | 3823 | 6.20 | 4838 | 4852 | 4200 | 4313 | 2.70 | 6105 | 6325 | 3.60 | ||||
| 5295 | 4560 | 4792 | 5.08 | 5266 | 4575 | 4709 | 2.94 | ||||||||
| 6104 | 5325 | 5506 | 3.40 | ||||||||||||
| 20 Hz | 15 Hz | 10 Hz | 5 Hz | ||||||||||||
| 696 | 360 | 371 | 3.08 | 708 | 368 | 367 | −0.03 | 650 | 338 | 337 | −0.14 | 654 | 375 | 375 | 0.08 |
| 1011 | 662 | 695 | 4.87 | 1105 | 743 | 764 | 2.91 | 1089 | 750 | 772 | 2.96 | ||||
| 1409 | 1035 | 1104 | 6.64 | 1909 | 1493 | 1567 | 4.98 | ||||||||
| 1651 | 1253 | 1351 | 7.90 | ||||||||||||
| 1959 | 523 | 1667 | 9.49 | ||||||||||||
Academic Editor: ZW Zhong
Declaration of conflicting interests
The author(s) declared no potential conflicts of interest with respect to the research, authorship, and/or publication of this article.
Funding
The author(s) disclosed receipt of the following financial support for the research, authorship, and/or publication of this article: This work is funded by the National Natural Science Foundation of China (grant no. 51375513), the National Hi-Tech R&D Program (grant no. 2014AA041506), and the Special Research Foundation for the Doctoral Program of Higher Education of China (grant no. 20120191110001).