
Abstract
Optimization activities in manufacturing must be addressed in the multifaceted context that combines economic, social and environmental goals. Research activities of today not only strive to cope with the legislative pressure of the Directive of the European Parliament on Energy Using Products but also strive for economic advantages for the machine tool user by investigating and applying suitable procedures and methods that help to model, forecast and reduce overall energy consumption. A key issue is the reduction of the amount of resources consumed for the same output and the increased machine tool efficiency with the help of selective methods and a minimum investment. A bottom-up approach to identify potential initial points for optimization is given in the presented research work. This article introduces a methodology for detecting and evaluating reasonable investments for retrofit solutions with different approaches. A technical measurement and optimization approach, depending on the actual circumstances, and an economic approach, that is used to detect optimization potentials with the economic evaluation of selected solutions are proposed in this article.
Introduction
Manufacturing costs can be globally identified and assigned; moreover, resources for manufacturing on the shop-floor level, for example, energy, can be identified and directly assigned to their consumers. The combination of these two approaches has the ability to be used for the determination of potential fields of action for energy efficiency improvements. Aside from social factors, the knowledge of energy consumption is mandatory for optimization and is requested in research and in the industry for the development of future machine tool energy consumption models. With reference to the manifold assessment levels as introduced by Vijayaraghavan and Dornfeld, 1 this assessment and evaluation pertains to the subcomponents of a machine tool.
Multiple measurement initiatives, for example, as in the study by Duflou et al., 2 and own machine tool power measurements with subsequent power data analysis 3 can provide a clear picture of a machine tool’s energy and resource consumption behavior. Unfortunately, this ability is rather uncommon in the industrial environment and on the subcomponent level today. Based on evaluations that influence both energy consumption and investment, the ability to determine design features is an important aspect of competitiveness and improvement in the future and might also become mandatory due to EU legislation. 4
Manufacturing and machine tool operational information and interpretation of these data are mandatory for a reasonable prediction to be made regarding the energy consumed and eventual design changes. Vague information could lead to false or ineffective investment strategies. For instance, a machine tool that is used in a three-shift work pattern requires different optimization actions and retrofit solutions from machine tools for occasional use on the shop-floor level. One main reason for such differing optimization activities is key performance indicators, for example, the effectiveness and the value-add and nonvalue-add usage ratio of the machine tool components in various machining processes. This can be understood as an approach to an overall equipment effectiveness (OEE) at the machine tool component level. This article introduces an indication for potential retrofit activities on the basis of a mathematical analysis.
State of the art
In principle, sustainability can be addressed with two approaches: a top-down approach with an estimative, indicative and quantifying characteristic, which addresses the general assessment level throughout the entire product life, for example, parts of life cycle assessment (LCA) 5 and a bottom-up approach that addresses assessment levels focused on the use phase, such as energy assessment at the subcomponent and process levels 6 as well as parts of the LCA. 7 Immediate optimization activities can be directly identified and addressed at the subcomponent and process levels following a bottom-up assessment approach, which is more effective. This approach is introduced in this article.
Retrofit in combination with service and repair, longevity of the product and replacement is seen as a potential technical and economic field of action. An internal study among Swiss small- and medium-sized enterprises (SMEs) discloses an unknown and underestimated potential for retrofit solutions. Retrofit, which means the change or exchange of subcomponents, is recognized as a potential energy and waste-saving activity. 8 More than 20 companies in Japan, which specialize in retrofit, refurbishment and remanufacturing activities, for example, Okuma Corporation, endorse the environmental and economic potential for those activities in the industry. 9 Weule and Buchholz 10 and Weyland et al. 11 point out the ecologic and economic potential of the reuse of peripheral systems. Kirchner et al. 12 and own measurements 13 ascertain that machine tools are not often designed according to the energy consumption criteria, mainly due to the peripheral design and the interperipheral adjustment. In retrofitting, the challenge remains the selection of appropriate solutions, which are at the same time economic and ecological.
The focus within this research is to detect and evaluate potential retrofit activities, particularly in peripheral equipment, whereas the process zone and its needs remain unquestioned. This focus is preferred according to the studies by Duflou et al. 2 and Kircher et al. 12 and also because measurements show that there is less potential for the optimization of inner process–related components, for example, controls.
In most cases, the use phase of machine tools is expected to be more than 10 years, 14 thus retrofit and refurbishment must be considered not only for maintenance and service reasons but also for continuous improvement during machine tool usage as well. The goal, along with the herewith presented research work, is to propose a method to identify the most reasonable measures for the improvement of energy efficiency by retrofit and to evaluate its return on investment (ROI).
Methodology
Retrofit indication
This methodology is represented by four steps. Heuristically, process-supporting components should continuously adapt their power consumption to the intensity of the process, more precisely to the variation of process parameters. It is therefore assumed that the supporting function, for example, cooling, should fluctuate as well. This approach is based on two major technical aspects that are considered indications for the energy efficiency of a machine tool component.
Energy consumption of the machine tool component. Components with a high share of the overall energy consumption are assumed to have a high saving potential as well.
Mode of operation. Open-loop-controlled components are assumed to have a higher potential for efficiency improvement than closed-loop-controlled components. This assumption is based on observations made during measurements that revealed a high share of energy consumption in peripheral devices with poor control quality in comparison to other consumers on the same machine tool system.
The combination of these values represents an indicator for potential retrofit IR defined by

with AE (—) representing the power share of one component during operational state of the total and AO (—) representing a weighting factor that signifies the mode of operation of the component. AO≈ 1 denotes an ideal constant energetic behavior, while AO≈ 0 represents an alternating, variable energetic behavior. This approach was chosen on the basis of a broad measurement database in combination with the multichannel measurement used.
Methodological steps
Step 1: detailed machine tool measurement
A detailed effective power measurement and assessment is mandatory for this analysis, most suitably by a multichannel measurement system, to gain coherent data from all the active machine tool components. The machine tool measurement and assessment include several subtasks:
the definition of appropriate system boundaries that includes all the relevant peripherals and all the relevant energy forms such as inputs and outputs to and from the system boundaries simultaneously;
the definition of operation states and of shift regime, that is, the sequence of operating shifts, observation period and use scenario for the given machine tool environment;
the definition of a reference process for the operation state “machining” that exploits the capabilities of the machine tool and defines a basis for optimization and
the listing of all the relevant costs that are represented by fixed and variable costs within the total costs for relevant machine tool components.
As the energetic behavior of the components depends on environmental and infrastructural constraints, for example, thermal state or process duration and frequency, a simultaneous measurement is recommended. 13
Step 2: calculation of retrofit indicator IR
For each machine tool component, the retrofit indicator IR must be determined by individual measurements during the observation period, where the period is subdivided by sampling intervals of length tsample. In consideration of the avoidance of aliasing, a sampling rate of 5 Hz is applied for all the component measurements. As the measurement consists of discrete effective power values, the energy share of each component i, AE,i, is calculated in equation (2)
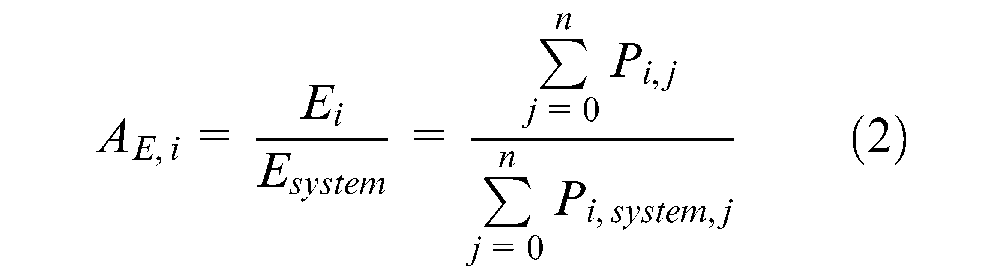
with

where Ei (kW h) is the energy supplied to the component i during the observation period, Esystem (kW h) is the energy supplied to the machine tool according to the system border definition, Pi,j (W) is the effective power of each component i at the sampling point, Pi,system,j (W) is the total effective power of machine tool according to the system border definition at the sampling point, n (—) is the number of samples within the observation period ttotal, ttotal (s) is the observation time variation of process parameters and tsample (s) is the length of sampling interval.
The operational mode of the component A0 is calculated by an occurrence frequency evaluation of the measured effective power values. A component is considered process-independent if it has all its sampling points on the same power level during various machine tool modes. Furthermore, it is assumed that components with a closed-loop-controlled energetic behavior are represented by different energy levels. Subsequently, a parameter that indicates the fluctuation of a component’s power supply has been defined as an indication for the component effectiveness. Due to high value fluctuation, the application of mathematical variance calculation is not sufficient for the evaluation of the mode of operation taken from an effective power measurement. Related methods, for example, rainflow or time at level counting, 15 have been investigated and reviewed for this application. Performed experiments have revealed that the rainflow methodology leads to false operation-mode interpretations due to erroneous peak interpretations, whereas time at level counting complicates the interpretation by class-width-dependent convergence behavior in the analyzed data. The occurrence frequency evaluation fulfills the analysis requirements to the furthest extent through a clear peak- and constant-value identification, interpretation and weighting. Furthermore, it provides an easy-to-read statement and acknowledges the performed experiments.
In this given approach, a definition of classes is not needed as a consequence of a direct value counting procedure, as it is mandatory within a time at level counting. The calculation of A0 can be described in four steps.
Value transformation
The measured discrete values Pi must be transformed with the lowest global value Pmin,global in order to provide Pi,trans≥ 0 values for further accumulation and comparability among the components. The transformation given by an origin of coordinates shifting is done by equation (4)

where Pi,trans (W) represents the transformed effective power of each component i, Pi (W) represents the time-discrete effective power of each component i during the observation period with above applied sampling rate and Pmin,global (W) represents the lowest global value within the observation period.
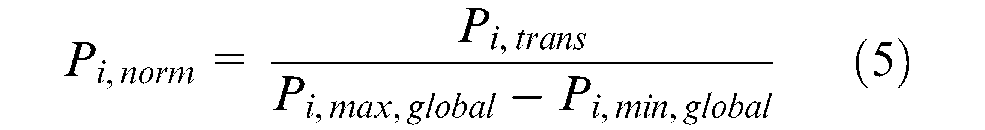
Normalized values
To provide a comparison among all the evaluated machine components, Pi,trans must be normalized with the global maxima according to equation (5). This calculation is done for each component
Sort values
As the measured values are transformed and standardized by the global limit values, the Pi,norm is sorted in descending order. The sorting can be performed either in descending or ascending order; for practical reasons descending order is chosen. It describes a cumulative frequency distribution. Figure 1 shows the standardized Pi,norm values, as demonstrated by the solid line. The resulting sorted values are represented by the dotted line.
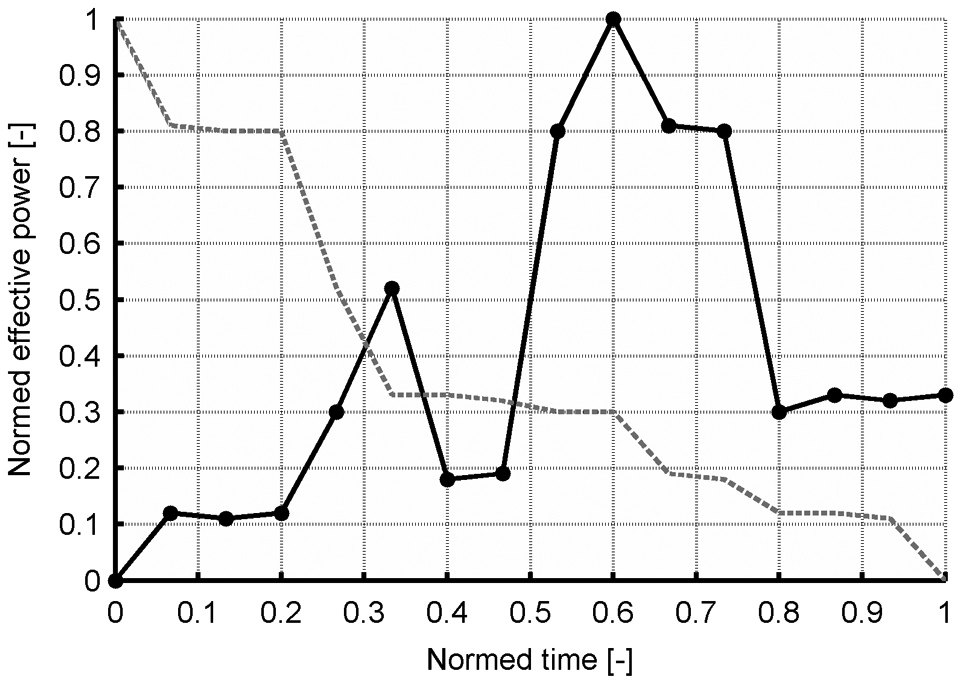
Normed Pi,norm with resulting sorted values over normed time.
Regression line
The resulting sorted values (Figure 1) describe the mode of operation of each analyzed component; however, the goal is to ensure a mathematical statement that describes this mode of operation. For this reason, a regression line is applied whose gradient represents a value and a mathematical statement for the mode of operation of each consumer (Figure 2). The weighting factor AO,i is calculated in accordance with
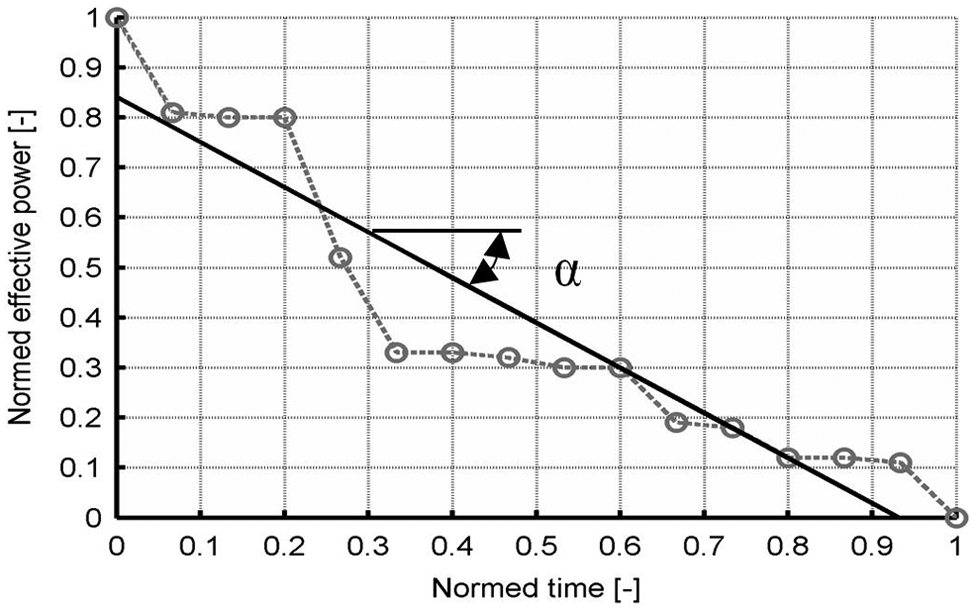
Sorted Pi,norm values with resulting regression.

where
Step 3: determination of retrofit activity
The evaluation of a retrofit indicator can now be applied to specify concrete fields of action for optimization. Herewith, a list from the calculated retrofit indication is given in descending order. Consumers with the highest retrofit indicator value should be considered and approved for potential retrofitting activities with priority. Retrofit and refurbishment activities are dependent on:
the impact on the process stability and quality as well as relevance;
the technical and operating expense for retrofit and
the economic considerations and payback.
The following retrofit measures can be considered, sorted by increasing complexity:
turn off component, if applicable;
apply adjusted control or reduced duty;
replace component with a more efficient one;
replace subsystem while providing same function and
combinations of 1 to 3.
The technical retrofit and refurbishment determination activities have to be considered under effectiveness and efficiency aspects. With reference to EN ISO 9000:2005, efficiency is defined as the relationship between the results achieved and resources used. While the energetic input is quantifiable, however the output is not, the produced part must remain constant in order for a comparison to be achieved. Thus, retrofit activities follow the minimization principle, and the efficiency of the machine tool should be considered for the determination of any optimization activities.
Step 4: evaluation of retrofit activity
Within this research, several influence factors within the cost evaluation in manufacturing have been assessed. It revealed that total cost of ownership (TCO) and life cycle cost (LCC) represent the most valuable approaches, whereas both approaches, also due to the current relatively low energy price, neglect energy consumption but are applicable on the component level.
The technically selected retrofit activity has to be evaluated pursuant to the economic goals of the user. More advanced industrial fields, for example, building technologies, apply several energy-related economic investment evaluation methods. 16 The following parameters can be pointed out as the most critical influences on the economic goals:
the usage of machine tool and its components and
the lifetime and maintenance of the machine tool and its components.
The presented method is built on four major evaluation steps as represented by the process chart in Figure 3. The objective in using the TCO calculation within this evaluation method is to assign all relevant costs for further calculations. These costs can be divided into fixed costs and variable costs. While the former covers aspects such as initial costs, rebuilding, refurbishment and recycling costs, the latter pertains to expenses such as costs for maintenance, costs of operation and energy costs. Equation (7) represents the calculation of the relevant costs within retrofitting
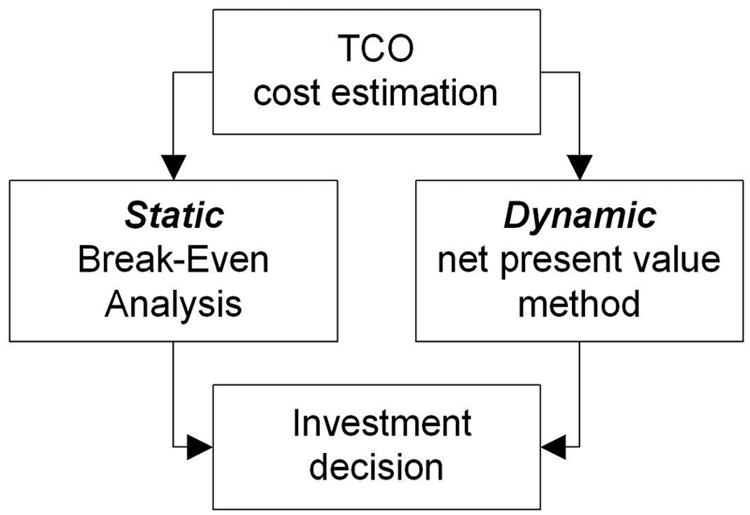
Process chart for economic evaluation.

where Co (t) (—) represents the linear cost function of the component, Fixi (CHF) represents the fixed costs of the component, Ce (CHF/kW h) represents the price per kilowatt hour, UE (kW h/t) represents the usage of machine tool component and CM (CHF/t) represents the maintenance costs per time.
On the basis of a TCO calculation and provided that the relevant costs are known and assigned, a static break-even analysis can be performed. This method compares the occurred costs for retrofitting to the existent cost of the component along the presumed and existent usage and energetic behavior within individual time frames. The machine tool usage (Figure 4) reveals the operating states of each component and its duration and type, for example, cycle time (tC) or machine setup time (tS).
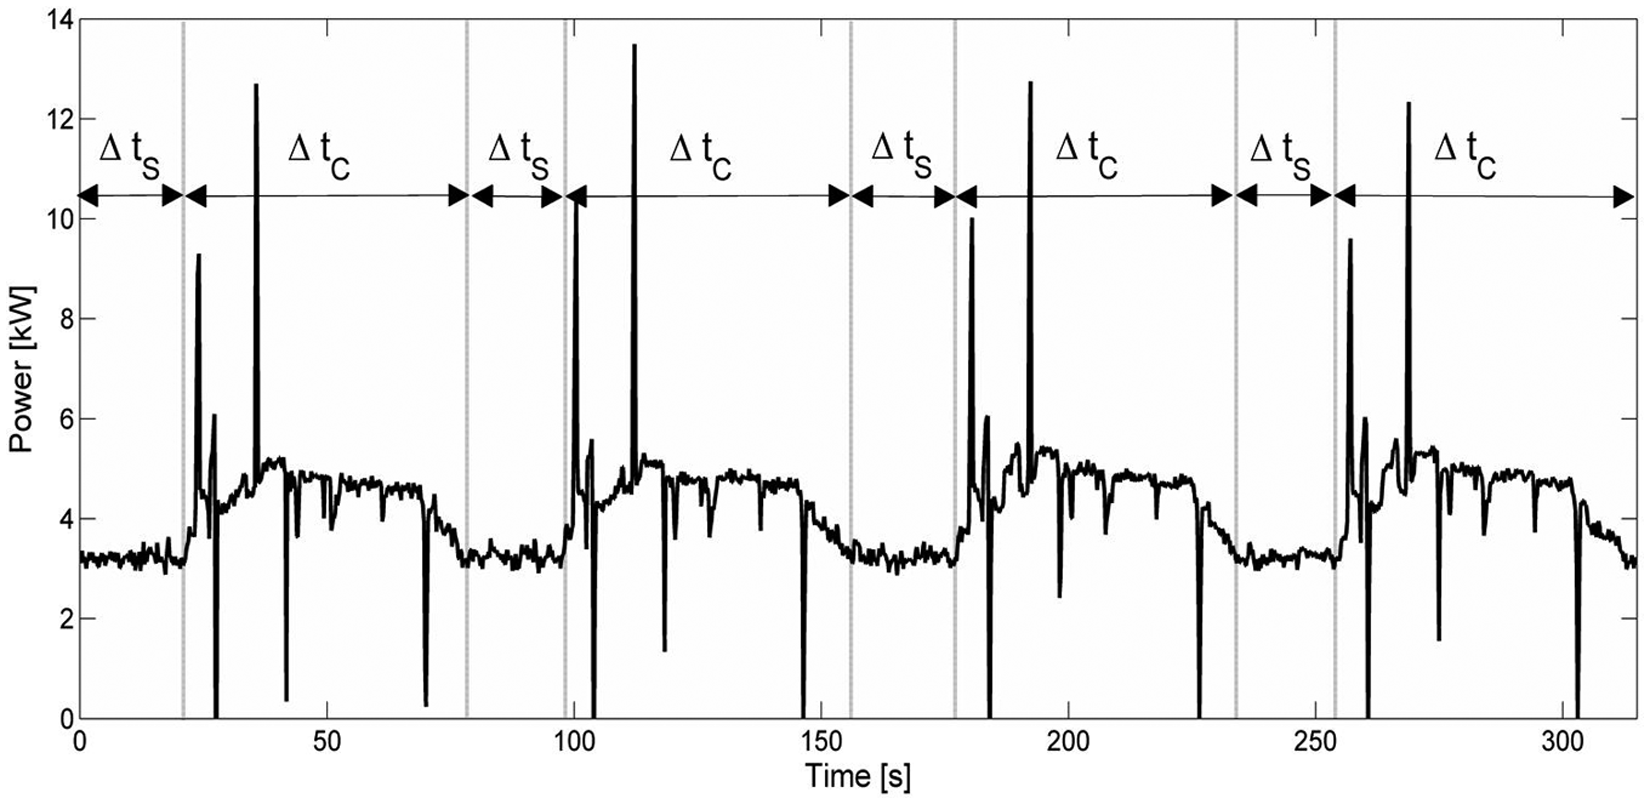
Measured usage of machine tool.
The applied method and equation (7) reveals the influence of the most critical parameters in the evaluation of the ROI that are represented by the (1) machine tool usage, (2) fixed costs of the component and (3) the price per kilowatt hour in descending order. Whereas (2) remains unchanged, (1) and (3) will change.
As tendencies of rising energy prices are quite likely, 17 the critical parameter of energy price will gain importance. Figure 5 shows the results of a static break-even analysis on the basis of a retrofitted hydraulic accumulator compared to a standard hydraulic pump system with the usage of a given machine tool use case, represented by Figure 4.
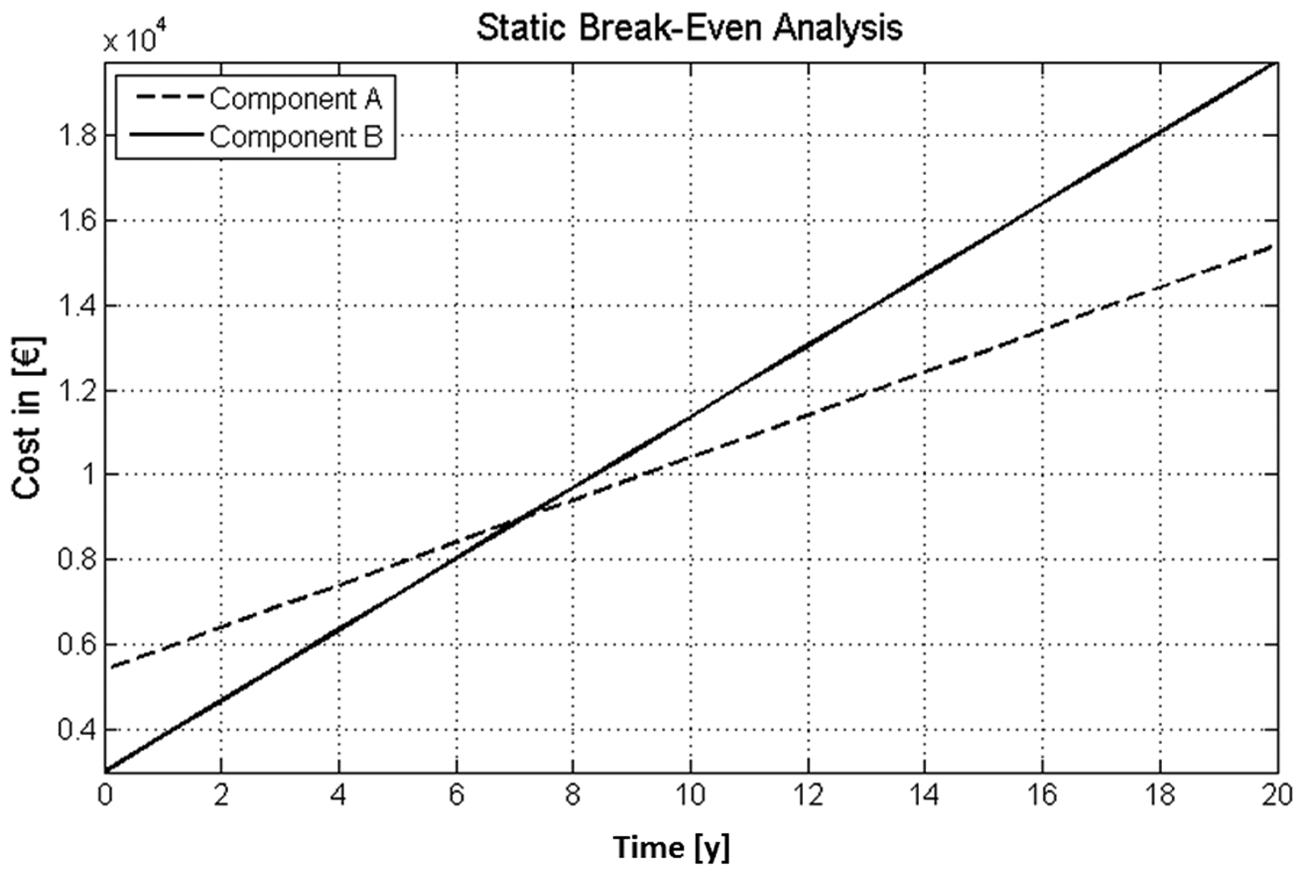
Static break-even analysis: (a) solution with hydraulic accumulator and (b) solution with standard hydraulic pump.
Conditioned by the fact that the present value of the monetary investment is neglected in this static evaluation, the net present value (NPV) is applied as additional criteria. According to Warnecke et al. 18 and Seiler, 19 it is only applicable for the comparison of projects with the same initial investment. Additionally, Seiler 19 points out that NPV can also be valid for projects with different initial investments if their difference is known and a negative or positive NPV can be calculated. According to the given evaluation requirements, this modification of the NPV is represented by
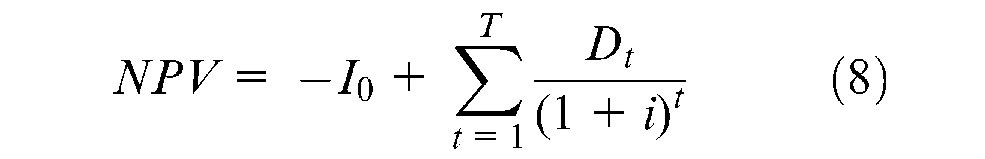
where I0 (CHF) represents the difference between evaluated investments; T (year) represents the expected remaining time of use; Dt (€) represents the difference of the variable costs; i (%) represents the required rate of return, here 8%; and Dt can be determined through the usage of the machine tool components by

where Ce (CHF/kWh) represents the price per kilowatt hour, UEA-B (kWh/ti) represents the usage of machine tool component A or B and CMA-B (CHF/t) represents the maintenance costs of component A or B.
The presented retrofit and refurbishment evaluation shows the combination of technical and economic approaches. The developed methodology has been applied to use cases of different machine tools, including a conventional lathe for verification.
Verification of methodological approach
Detailed machine tool measurement
Due to extended machine measurements and efficiency as well as effectiveness assessments, the following example can be illustrated to verify the retrofit indication with the developed calculation methodology. Table 1 shows a reference process that represents a typical application of the assessed machine tool as it is applied on a lathe with a two-axis tool positioning system, dry processing and compressed air process cooling.
Reference process.
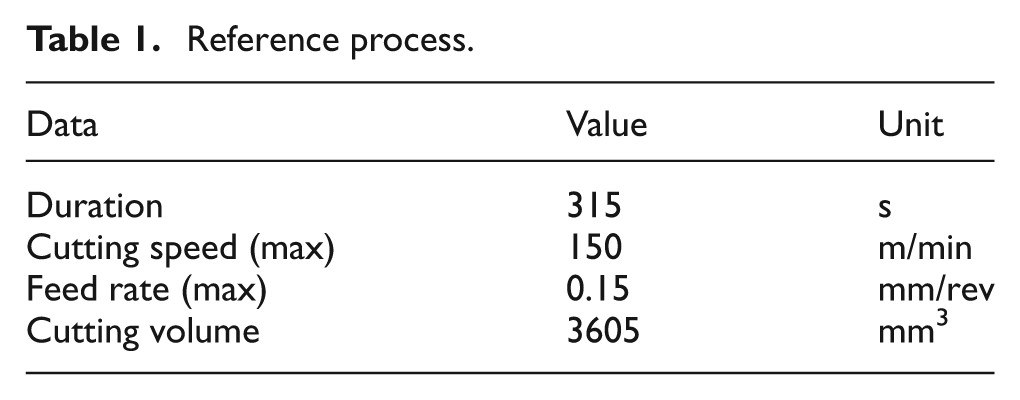
The reference process is defined as a typical machine tool process that represents a typical application of the designed machine tool. In the present example, a hard turning finishing process with low spindle forces is applied. The machine tool usage is represented by Figure 4. Additional measurements of operational modes can be performed according to assigned scenarios. The observation period for this example is defined by the four similar cycles including setup times and result in a total observation time of ttotal = 315 s.
Calculation of retrofit indicator IR
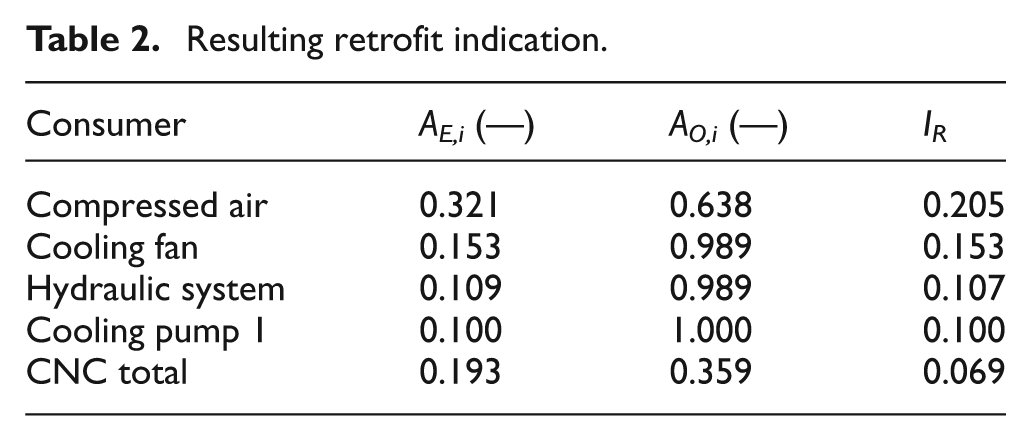
The total machine tool measurement has revealed the following top five retrofit indication information for each measured consumer before the retrofit optimization as shown in Table 2. The retrofit indicator represents a relative comparison of different components of a machine tool and an indication for potential retrofit components during a common observation period. It should not be considered as an absolute statement.
Resulting retrofit indication.
Determination of retrofit activity
The performed assessment has revealed that the compressed air system, which is responsible for both tool cooling and the hydraulic system, should be investigated in more detail for potential retrofit solutions. As the compressed air process cooling directly influences the machining process, and based on the minimum rule (same quality with less resources usage) that the output has to remain constant, the investigations are focused on an auxiliary system, the hydraulic system. In the given case, the hydraulic system is used to open and lock the chuck for the workpiece clamping.
According to the given retrofit definition and the possible retrofit activities, the further evaluation is based on the replacement of the current hydraulic system by a hydraulic pump combined with a hydraulic accumulator system. Figure 6 shows the effective power of the new hydraulic system after the selected retrofit action. It shows the results of effective power measurements according to the given reference process. In the following case, the application of a hydraulic pressure reservoir with a controlled pump reveals a total effective power savings of 96% on the hydraulic system and an overall power savings of 12% on the machine tool. Since the effective power output during evaluation is not known, the instructions and white sheets of manufacturers have to be considered.
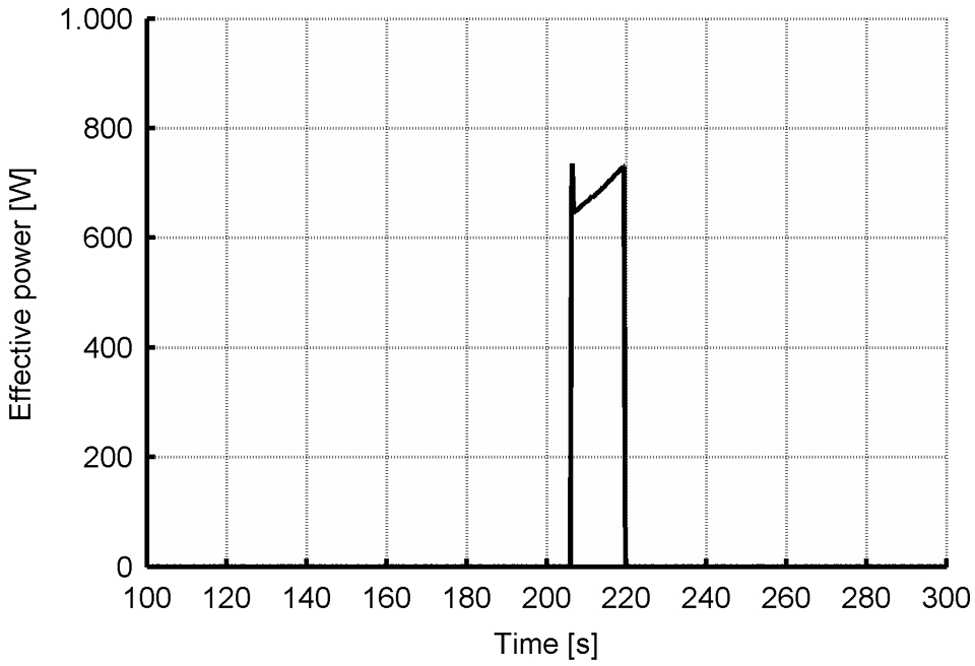
Effective power usage of new hydraulic system after retrofit activity.
Evaluation of retrofit activity
In the first step, a potential retrofit indication was established that represents the technical optimization viewpoint. As technical and economical viewpoints might differ, for example, misinvestments, an economical assessment must occur. Upon the establishment of a clear technical assessment that is represented by the retrofit indication, an economic assessment should be applied to determine retrofit expenses obverse to potential savings. For the economic evaluation of the selected retrofit activity, the cost structure as shown in Table 3 is taken into account.
Cost parameters of hydraulic accumulator.
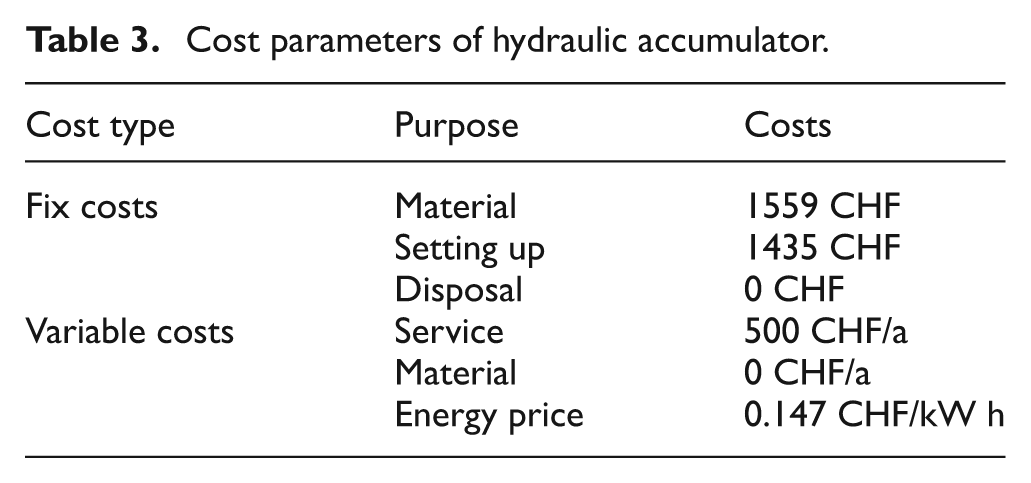
Due to the investment cost-to-energy price ratio, longer payback times should be considered in the application of retrofitting in manufacturing. In the example presented, the ROI is reached after 7 years (Figure 5). Under the presumption of a machine tool lifetime of 20 years and a required return rate of 8%, this example reveals a minimal positive NPV of 1848 CHF.
Conclusion
According to the given use case, as well as the machine tool system design, the retrofit indication is determined and ranked potential retrofit fields of action. It indicates technical weak points that can be directly evaluated with the given economic evaluation strategies.
The economic evaluation of the investment presented in this article shows that there is an economic benefit; however, due to the long payback time, it is unattractive for current investment strategies in new applications. Optionally, this indication could be applied to component end-of-lifetime scenarios with adequate machine tool longevity or as an input for future machine tool designs.
The research combines technical and economic approaches into one optimization strategy. Retrofit and refurbishment activities can be evaluated based on machine tool measurements, primarily addressed to the peripherals. In the case of the indication of potential fields of action, known economic evaluations can be applied in an effective way. The central point is the mode of operation of each component and joint costs for retrofit and refurbishment.
This method is considered a promising assessment with two combined approaches, technical and economic, to achieve goals in sustainability within manufacturing. It relies on a clear input, the effective power measurement, corresponding components, cost structure and investment structure. Furthermore, simulation activities and awareness for next-generation machine tools can be based on these findings. Due to possible EU regulation and a positive effect on the ecological footprint, 6 retrofit and refurbishment activities should be considered as potential fields of action for a holistic sustainable manufacturing approach.
Footnotes
Appendix
Acknowledgements
The authors sincerely thank MAG Switzerland and Hydac Engineering AG for their cooperation.
Funding
This study was funded by the CTI Switzerland.