
Abstract
Improving the energy efficiency of machine tools is the goal of sustainable development of the mechanical manufacturing industry. The key is to measure or calculate energy efficiency conveniently and accurately. This article proposes a method of calculating power by reading the computer numerical control system’s servo parameters from its current-loop and speed-loop, establishing the relationships between cutting power, total power, and servo parameters, and using these relationships for power prediction. Experiments were done on a computer numerical control lathe. The result shows that this method has high precision, does not need additional sensors, and is independent of cutting process parameters, workpiece material, heat treatment state, and tools. This method may be used for developing a cutting power management module integrated in the computer numerical control system with real-time monitoring power consumption because the computer numerical control system can read servo parameters real time.
Keywords
Introduction
With the crisis of global climate warming and the increasing of resource prices, the world community is facing the dual challenges of resource depletion and environmental pollution. Governments and industries are paying more and more attention to issues of sustainable development.1–4 The manufacturing industry is an important wealth creator. However, it is a major natural resource and energy consumer as well. Therefore, sustainable manufacturing has become an international focus.4–6 The energy efficiency problem of machine tools has become a major focal point of both manufacturer and customer, and also a hotspot of scientific researches.7,8
In metal removal machine tools, necessary energy is used for material removal, but additional energy loss exists due to machine auxiliary operations, transmission parts friction, electrical components’ resistance, electromagnetic leakage, and so on.9–11 For computer numerical control (CNC) lathes, milling machines, machining centers, and other machine tools, their spindles and feed-axes (servo) motion are usually driven by motors, and some of auxiliary operations are driven by the compressed air generated by an electric air compressor. However, usually the energy required for compressed air is a small part of the total electrical energy consumption12,13 Therefore, in this article, energy required to generate compressed air is not considered.
The total energy consumption of machine tool can be easily measured by a power meter, which meets the accuracy requirements for cutting parameters optimization.14–16 But, for machine tool improvement research, W Li et al. 15 and A Zein 16 propose that energy breakdown analysis should be done to measure the energy consumption for each component. It is necessary to monitor the energy consumption of machine components, especially the material removal power (cutting power) to properly perform machine tool energy efficiency research.17,18 In current machine tool’s energy consumption research, the input and output power of electrical components can be measured or calculated by the acquired signals with current, voltage, or power sensors, which can be integrated in CNC system.15,16 However, the measurement and calculation of cutting power is relatively complicated.
In current research, there are four typical methods for cutting power measurement and calculation, namely, (1) calculation by the classic theoretical cutting force formula and motor speed, (2) calculation by an improved formula through material removal rate (MRR) and specific energy consumption (SEC), (3) calculation by measuring cutting force and motor speed, and (4) calculation by measuring electrical input power and transmission mechanism efficiency.
In method (1), the cutting power can be calculated by multiplying cutting force and cutting speed. Several texts, including the studies of Rao 19 and Shaw, 20 provide a cutting force formula, which involves with the cutting process parameters (cut-depth, cutting speed, and feed rate), tool angle, workpiece material, and its heat treatment. B Wang et al. 21 propose energy optimization using cutting parameters and tool angle. If the process involves variable cutting speed, the speed should also be calculated or measured. This method has a relative large error and cannot perform energy monitoring online real time. In method (2), the cutting power can be calculated by multiplying SEC and MRR. A Zein 16 and Yoon et al. 22 research shows that the material SEC-MRR curve varies with different machine tools. To obtain this curve for a material in a certain machine tool, experiments must be done to reduce errors. Due to the different MRR-SEC curves of different machine tools, this method is not suitable for real-time cutting power monitoring unless the curve is obtained.
In method (3), the cutting power can be calculated by multiplying cutting force and cutting speed. The key is acquiring torque or force from a dynamometer 23 or strain gauge. 20 Similar to method (1), cutting speed acquisition method must also be considered. Because the strain gauge has a short lifetime and complicated wiring, and the dynamometer is expensive, this method is not suitable for integration in the CNC machine tool system. In method (4), the cutting power can be calculated by multiplying electrical input power and transmission mechanism efficiency. S Hu et al. 24 and F Liu et al. 25 proposed calculating or acquiring input power using current, voltage, or power sensors and also proposed calculating the transmission efficiency by analyzing the mechanism transmission chain. From these, the cutting power can be calculated. Principles of alternating current (AC) and direct current (DC) motors and the structure of transmission mechanism must be taken into account. The error is closely related to the computational model. This is also not the most suitable method for integration in the CNC system.
It is noteworthy that Kim GD and Chu CN, 26 X Li et al., 27 and S Aggarwal et al. 28 proposed indirect cutting force measurement by monitoring motor current. This method has good accuracy and can also be used for indirect energy measurement. With the development of technology for digital servo controllers, intelligent components integrated with internal and external sensors are widely adopted in CNC machine tools.28,29 The motor current signal and speed controlled by the digital servo can be read out and written by the CNC and PC real time. This is a novel indirect method to measuring and calculating information such as cutting power and input power.
The purpose of this article is to propose an indirect method of calculation cutting power and total power using servo parameters related with the motor current and motor rotation speed. This method is independent of external sensors, cut-depth, cutting speed and feed rate, tool, workpiece material, heat treatment state, and it can be easily integrated in the CNC system.
Energy flow of the CNC machine tool and servo control parameters
Energy flow of the CNC machine tool
The modern CNC machine tool commonly consists of CNC system, servo control system, feedback equipment, machine bed, lubricant, cooling system, and so on. Most machine tools are driven by electrical energy, where a part of the electrical energy is used to drive servo systems, and the remaining power is used drive lubricant, cool, display information, and other auxiliary functions. For most servo systems, the AC is first converted to DC through a power supply module (PSM), then PSM supplies energy to spindle amplifier module (SPM) or the feed-axis (servo) amplifier module (SVM), respectively, driving the spindle motor rotation and feed-axis motor rotation or stalling. Taking the CINCINNATI HTC-200M lathe center equipped with FANUC 16i as an example, its energy (power) flow is as shown in Figure 1, and the definition of each energy consumption components’ power is shown in Table 1.

Energy/power flow of CNC machine tool.
Definition of energy consumption components’ power.

CNC: computer numerical control; PSM: power supply module; SPM: spindle amplifier module; SVM: feed-axis (servo) amplifier module.
The relationship of each component power in Figure 1 is shown as equations (1)–(3). A Zein 16 and R Sudarsan et al. 17 and the experimental results in this article show that PCOOL, PSYS can be considered as constant values, and there is a strong correlation between PSM input power PiSPM and cutting power PSP. In CNC lathe, the main function of the servo axis is to drive the servo axis’ motion or stalling. There is relatively little power used when the servo axis is stalling or moving at a low feed rate. The experimental results in this article also prove that the servo axis energy power PSV is far less than the spindle power PSP in low feed rate cutting, when PiSVM << PiSPM; so, this article considers only the energy consumed by spindle PSP as the effective cutting power


Numerical servo system parameters
For the closed-loop or semi closed-loop control CNC system, the “three-loop” control method (the current-loop, speed-loop, and position-loop) is mostly adopted. A typical FANUC system “three-loop” is shown in Figure 2. 29 Current, speed, and other signals of servo motor are monitored by internal and external sensors as parameters stored in servo controller; by altering related parameters, the controller can also adjust to keep the motor’s speed and input current consistent with the set value. In a full digital servo system, the CNC system can bidirectionally communicate with the servo controller to read or write parameters to set value, and it can also communicate with a PC.

The three-loop control method of FANUC CNC system.
Taking the FANUC 16i system as an example, the CNC system monitors the motor current and speed in real time through a servo controller, internal, and external sensors and generates the command torque (TCMD) according to those data. The servo controller adjusts its output current based on the TCMD to maintain current-loop control. In a modern CNC system, a permanent magnet synchronous motor (PMSM) is generally used for the feed-axis motor and asynchronous induction for the spindle motor. The spindle motors adopt a constant torque and constant power control method. The feed-axis motors adopt a constant torque control method. Figure 3 shows the relationship between output power, torque, and rotation speed of FANUC αiI22/7000HV spindle motor. 30
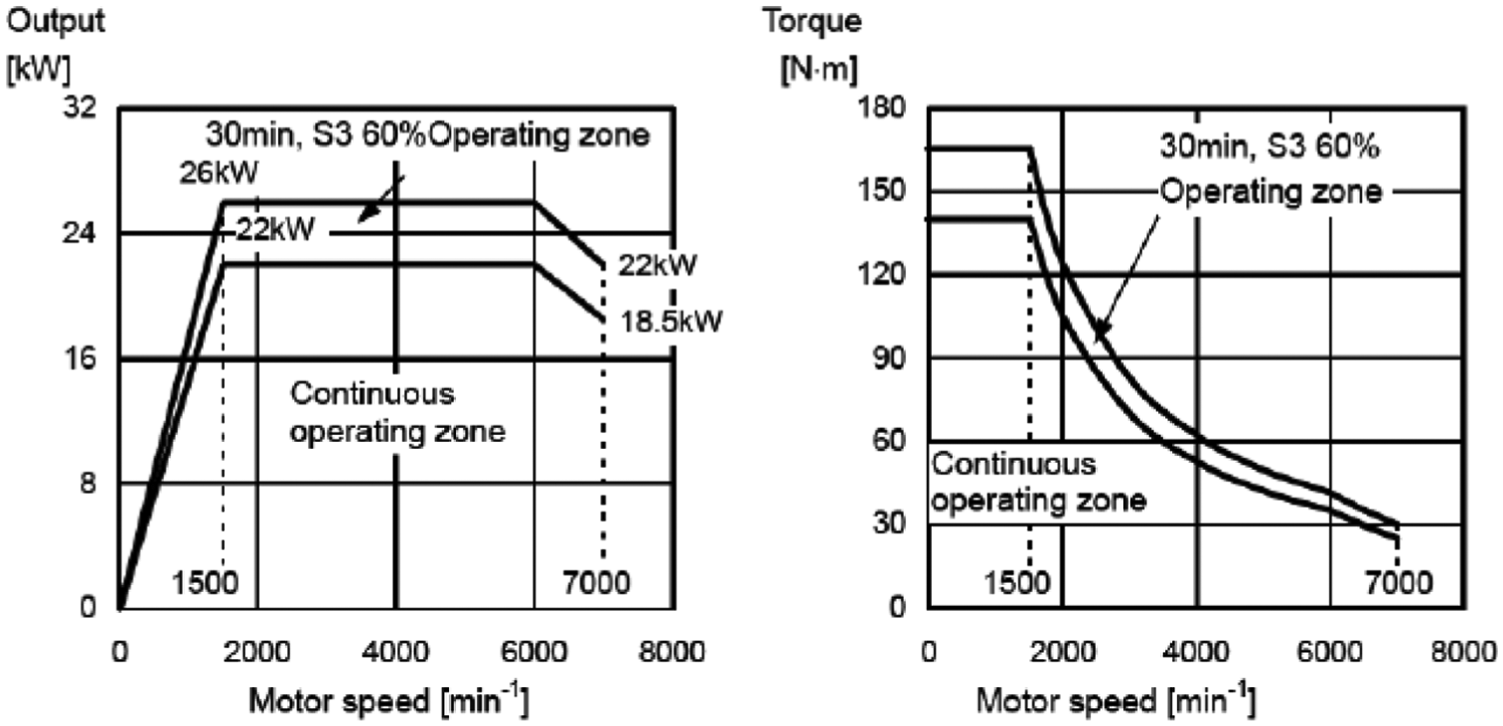
Relationship between output power, torque, and rotation speed of FANUC αiI22/7000HV motor. 30
Due to the electrical impedance, electromagnetic saturation, and other factors, the relationship between output torque and motor input current appears nonlinear when the current is close to the maximum or 0 values, while it appears linear when in the other ranges. In a FANUC system, the servo parameter SPEED is for the speed value of motor detected through the internal sensor, which is of high accuracy. The unit of SPEED is revolutions per minute (r/min). The servo parameter TCMD is the current regulation command for servo motor, which has an approximately linear relationship with the motor output torque Me. The value of TCMD can be the current value or the ratio of the current to the maximum current. In this article, the TCMD value is the ratio of the current to the maximum current; its unit is %.
Based on this, the nominal power of the motor PST is defined in this article, which is calculated by TCMD and SPEED. The spindle motor adopts constant torque and constant power control method as shown in Figure 3; when the motor speed SPEED ≤ 1500, PST is calculated with equation (4) and when SPEED > 1500, with equation (5)


where
Experimental research
Experimental equipment
The HTC-200M CINCINNATI CNC lathe with a FANUC 16i system with servo controllers is used in this experiment. The servo motors are shown in Table 2. This lathe’s spindle motor is connected to spindle through V-belt, and the transmission ratio (ratio of output speed to input speed) is 0.9. The hollow cylindrical workpiece material is ASTM 1045 (Hardness HBS: 205), with an outer diameter of 140 mm, an inner diameter of 90 mm, a length of 180 mm. The experimental scheme is shown in Figure 4, and the field wiring is shown in Figure 5.
HTC-200M CNC lathe servo controllers and servo motors.

CNC: computer numerical control.

Schematic diagram of the measurement system.

Measurement field: (a) Machine tool & instruments, (b) Part support, (c) Power measurement wiring, and (d) Power analyzer.
The TCMD and SPEED value of spindle servo controller are read through FANUC SERVO GUIDE software with a dedicated Personal Computer Memory Card International Association (PCMCIA) card; then, the nominal power PST is calculated according to equation (4) or (5). A Hioki 3390-10 power analyzer is used to measure the input power PiSPM and output power PoSPM of the SPM module and the input power PiSVM of SVM module. The CNC lathe input power Pi and PSM module input power PiPSM are measured using a power transmission sensor (model: CE-P31-84DS5-0.5; Shenzhen SSET Co., Ltd, Shenzhen, China) and acquired using data acquisition cards (model: USB2850; Beijing ART Technology Development Co., Ltd, Beijing, China). The cutting forces are measured using Kistler 9129A dynamometer, and the cutting power PSP is calculated with equation (6). MATLAB software is used to sample and analyze the experiment data

where FY (unit: N) is for the main cutting force and VC is the cutting speed (unit: m/min).
Experiment scheme
Cylindrical longitudinal turning experiment
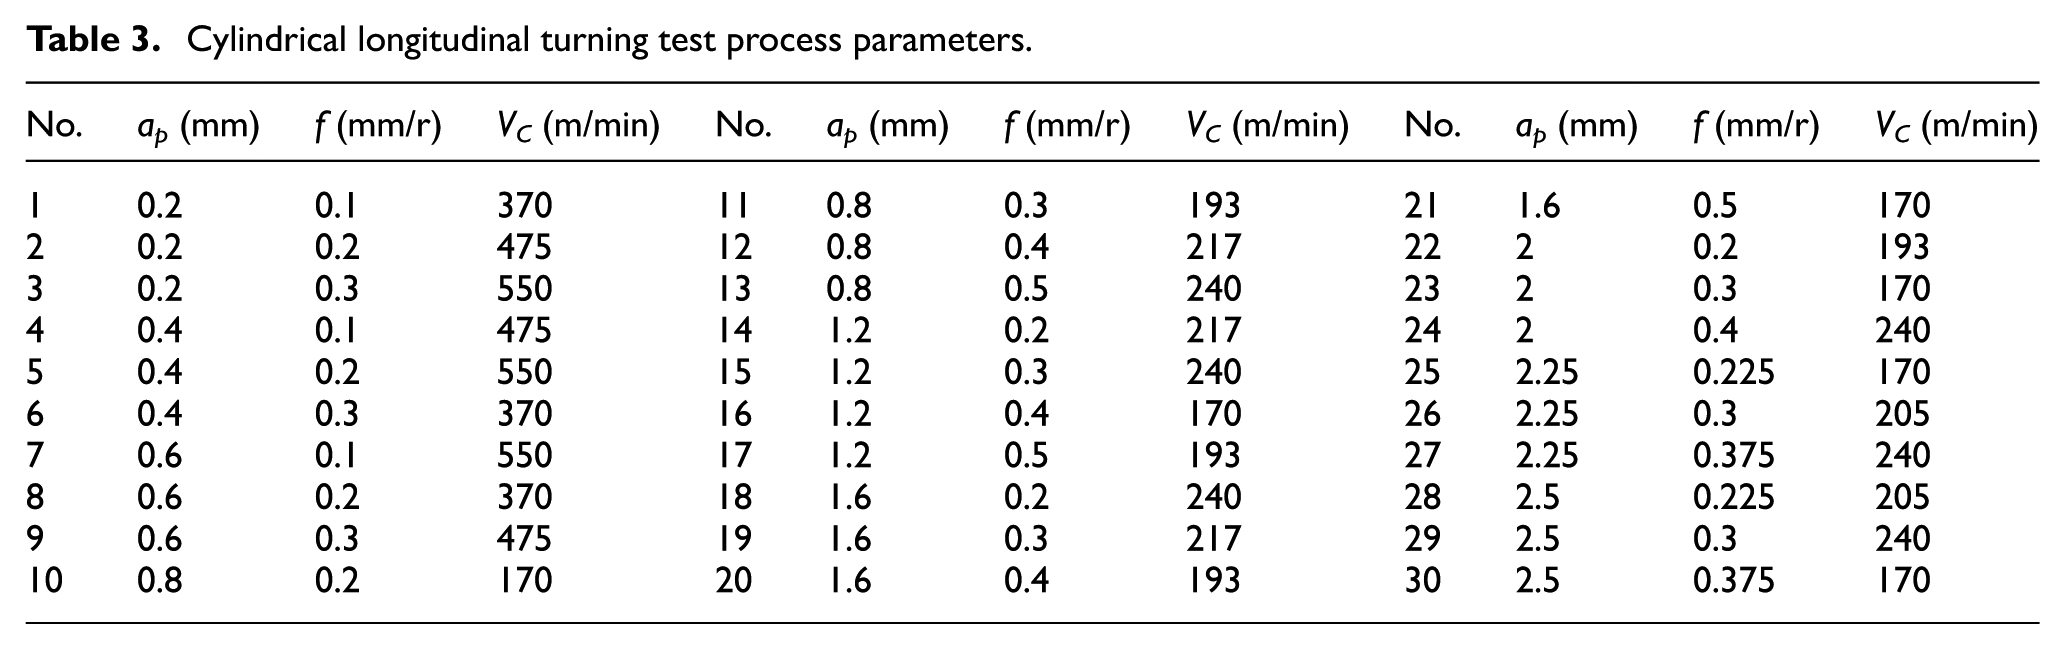
The hollow cylindrical workpiece is clamped with chuck and supported with a center as shown in Figure 5(b). Two kinds of tool inserts are used for the longitudinal turning experiment, where the SECO SMG4Ver1 insert is used for finish turning, and the SANDVIK CoroKey 4235 insert is used for semi-finish and rough cutting. These inserts are installed in the SANDVIK DCLNL2525M shank. In total, 30 sets of parameters are selected for this experiment, as shown in Table 3. No. 1–9 are finish turning parameters for a Taguchi L9 orthogonal table; No. 10–25 are semi-finish turning parameters for a Taguchi L16 orthogonal table; No. 26–30 are part of rough parameters as a Taguchi L9 orthogonal table. Those parameters with cut-depth ap: 0.2∼2.5 mm, feed rate f: 0.1–0.5 mm/r, and cut speed VC: 170–550 m/min record the values of Pi, PiPSM, PiSPM, PoSPM and calculate PST, PSP according to equations (4)–(6).
Cylindrical longitudinal turning test process parameters.
Variable cut-depth cutting experiment
On the same lathe, using the SECO SMG4Ver1 insert and the hollow cylinder workpiece, the taper and variable cut-depth turning are done, respectively, as shown in Figure 6. The cut-depth varies from 0.2 to 2.2 mm, and the other process parameters are show in Table 4.

Variable cut-depth cutting scheme: (a) taper turning and (b) variable cut-depth turning.
Variable cut-depth turning test process parameters.

Results and analysis
Correlation analysis of powers
According to the cylindrical longitudinal turning experiment scheme, each power under the cutting and unloaded states was recorded, as shown in Table 5. According to the data in Table 5, the relevance can be calculated as shown in Table 6, which shows a good correlation between these power values. Linear regression analysis with PST as the independent variable, and Pi, PiPSM, PiSPM, PoSPM, PSP as the dependent variables, the relational model is built in the form of f(PST) = p1 * PST + p2. The linear equation coefficients p1 and p2, fitting coefficient R 2 , fit correlation coefficient AdjR 2 , total deviation SSE and mean square deviation RMSE, which are calculated out through the regression, are shown in Table 7, and the fitting curves are shown in Figure 7. These results indicate that the fitting results have a good fitting degree.
Cylindrical longitudinal turning test data.

St. is the working status; St. A is under unloaded operation, the cutting force FY value measured by Kistler is 0, so the calculated cutting power PSP is 0 according to the formula (6); St. B is under loaded operation.
Power correlation analysis.

Linear regression results.
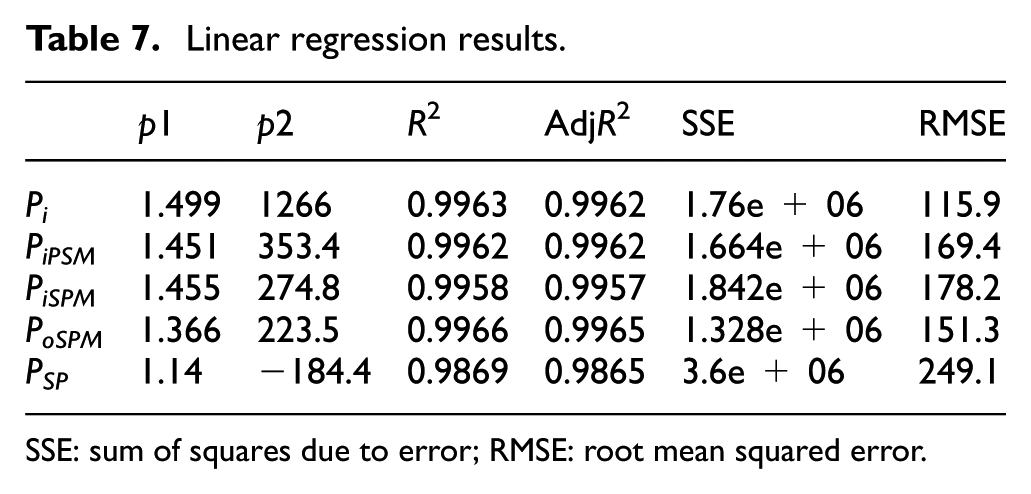
SSE: sum of squares due to error; RMSE: root mean squared error.
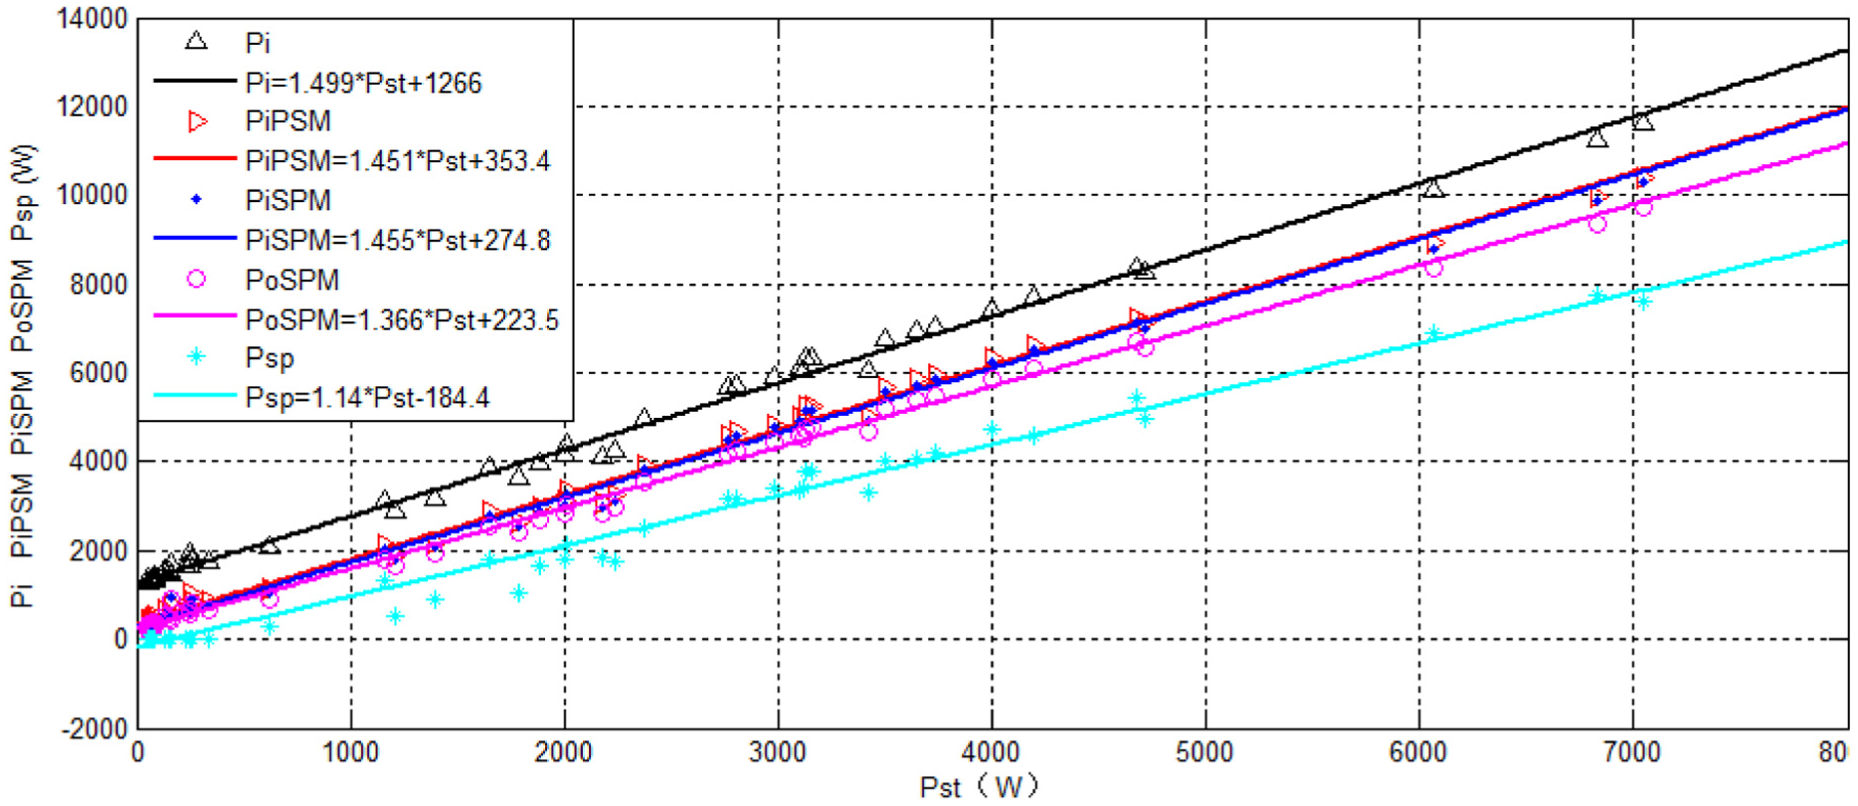
Relationship between PST and other power.
Prediction of cutting power and machine tool power
The regression equations with coefficients calculated in section “Correlation analysis of powers” are verified by applying the cutting parameters in section “Variable cut-depth cutting experiment.” Because of the continuous variation of cut-depth, the main cutting force and cutting power are continuously changing. The nominal power PST value is calculated using the SPEED and TCMD values monitored by the SERVO GUIDE software and used to predict the value of other power. Note these predicted values, respectively, Pi(P), PiPSM(P), PiSPM(P), PoSPM(P), PSP(P). The powers measured by monitoring instruments are, respectively, Pi(R), PiPSM(R), PiSPM(R), PoSPM(R), PSP(R). Figure 8(a) and (b), respectively, shows the comparison of predicted values and the actual measured values with the No. 31 and 38 set of parameters. According to the comparative analysis of the predicted values and the actual measured values, the relative errors of the predicted values calculated with equation (7) are shown in Table 8. The results show that with the increase in cutting power, the relative error between the predicted value and the actual value will increase


Comparative analysis of predicted and actual values: (a) No.31: ap = 2.2–0.2, VC = 370 m/min, f = 0.1 mm/r and (b) No.38: ap = 2.2~0.2, VC = 475 m/min, f = 0.3 mm/r.
Prediction error analysis.

where err is the relative error, P(P) is the power predicted value and P(R) is the measured power value.
Conclusion and discussion
The longitudinal turning experimental results show that the nominal power PST calculated through servo controller parameters has a good correlation with the cutting power PSP and the powers Pi, PiPSM, PiSPM measured in other locations. In the variable cut-depth cutting experiment, the equations are used for powers prediction, which shows the result has good accuracy with relative error within 8%.
The reason is that the spindle motor is a digitally controlled AC motor, so the value of TCMD parameter has an approximately proportional relationship to the motor output torque. The cutting force is relatively small, where there is no V-belt slipping phenomenon; so, the real speed of motor can be calculated accurately using SPEED parameter and mechanism transmission ratio. The nominal power PST is calculated through TCMD and SPEED, which leads to PST which has a good linear relationship with cutting power PSP. When the servo axis is working at low speed, the cutting force has little effect on the servo power. Therefore, PiSVM is much smaller than PiPSM and can be neglected. In summary, Pi, PiPSM, PiSPM have a good linear relationship with cutting power PSP.
The method to predict cutting power and machine tool power through servo parameters is independent of the workpiece, tool, and cutting process parameters. The CNC system can read the servo parameters in real time, which enables the integration of the energy consumption monitoring module in the CNC system, and this method will provide a reference for the machine tool or CNC system manufacturers to develop the energy consumption monitoring module.
The drawbacks of this method are as follows: (1) the relationship between TCMD and actual torque is obtained by the regression of experimental data, resulting in a relatively large error; (2) when the motor rotation speed is near the high-limit or low-limit speed, the relationship between TCMD and actual torque may be more complicated, where more detailed information is needed from CNC system, servo, and motor manufacturer; (3) for high-speed machining, the feed-axis power is relatively large and cannot be neglected.
Follow-up studies will focus on the relationship between the feed-axis motor power and servo parameters, especially under conventional cutting and high-speed cutting, and the establishment of a calculation algorithm for power, energy, and efficiency of conventional cutting and high-speed cutting. Further research on improving the algorithm will improve machining energy consumption prediction and energy efficiency–based machining process parameters optimization. Eventually, the algorithm will be integrated into the CNC system, and energy consumption on-machine monitoring and manufacturing system energy consumption management based on INTERNET platforms will be realized.
Footnotes
Academic Editor: Ismet Baran
Declaration of conflicting interests
The author(s) declared no potential conflicts of interest with respect to the research, authorship, and/or publication of this article.
Funding
The author(s) disclosed receipt of the following financial support for the research, authorship, and/or publication of this article: The project was supported by the National Science and Technology Major Project of the Ministry of Science and Technology of China (grant no. 2012ZX04005031).