
Abstract
To optimize the surface properties such as surface roughness, residual stress, and micro-hardness of Ti1023 titanium alloy, the effects of shot peening on Ti1023 alloy were investigated. Surface roughness, surface topography, residual stress, micro-hardness, and micro-structure were carried out at different shot-peening parameters. The results demonstrate that the increased peening intensity enhances the surface roughness, compressive residual stresses, and hardness in subsurface, which is mainly due to the plastic deformation in the near surface layer. Specimen 11 has a low surface roughness of Ra = 1.91 μm, well-developed dimple topography, higher compressive residual stress layer depth of 143 μm, and higher hardened layer depth of 200 μm. The ceramic shots with a diameter of 1.08 mm and peening intensity of 0.18 mm A are the optimal shot-peening conditions.
Keywords
Introduction
Ti1023 titanium alloy is a near-β-type titanium alloy, which has high strength, high toughness, and excellent thermal processing. In particular, Ti1023 has high strength, good fracture toughness, small anisotropy, good forging performance, and strong corrosion resistance. Ti1023 is widely used to manufacture aircraft fuselages, wings, and landing gear structures of titanium alloy forgings, including beams, frames, nacelle joints, flaps, and other rails. Surface layer properties of aviation component have received increased attention in recent years. Shot peening is widely used in aerospace industries to improve the fatigue life of metallic components.1,2 In the process of shot peening, a great amount of small shots with high kinetic energy impact on surfaces, which results in elastic–plastic deformation on the surface layer. In the meantime, high residual stresses and micro-structure refinements are generated. 3 The shot peening–induced surface roughness, notch effect, compressive residual stress (CRS), work hardening, and surface damages are all affect the fatigue applications. 4 The fatigue performance of the component is mainly evaluated based on the surface roughness. Hassani-Gangaraj et al. 5 reported that the shot peening–induced high surface roughness makes the fatigue crack initiation from the surface. Bagherifard and colleagues6,7 reported that repeening treatment was not able to reduce the surface roughness, but can induce a more regular surface topography, which is contributed to the fatigue strength improvement. Thus, the surface topography is a better indicator of fatigue performance than the roughness parameters. Influence of shot peening on tension–tension fatigue properties of two titanium alloys was investigated by Gao. 8 He found that shot peening treatment made the fatigue life of TC18 and TB6 alloys increased by 27% and 29%, respectively, at 107 cycles. While the fatigue life is sensitive to the roughness and residual stress, insufficient shot peening and over shot peening will not produce good fatigue performance. The effect of surface work hardening on wear behavior of Hadfield steel was investigated by Yan et al. 9 They found that after shot peening treatment, the grain sizes in top surface layer were decreased to about 11.1–17.4 nm, and the maximum hardened layer reached 100 µm. The effect of shot peening treatment on duplex stainless steel S32205 was studied by Feng et al. 10 They revealed that shot peening treatment–induced CRS layer in both ferrite and austenite of duplex stainless steel S32205 reached to 150 and 200 µm, respectively, and the domain sizes were refined. Inoue et al. 11 used glassy alloy, conventional high-speed steel, and cast steel shots as peening shots to bombardment carbon steel sheets. They found that glassy alloy shot peening induced much distinct crater-like pattern appear on target surface, and the maximum values of CRS and hardness increased. Zupanc and Grum 12 investigated the effect of shot peening–induced surface hardening on fatigue properties of 7075-T651 alloy. They found that CRSs and hardened surface layer induced by shot peening retarded the initiation of fatigue cracks. The fatigue lives of the shot peening–treated specimens increased to 218 MPa at 107 cycles. The shot peening–induced surface mechanical properties of Ti–6Al–4V alloy were investigated by Xie et al. 13 They revealed that surface micro-hardness of Ti-6Al-4V alloy can be increased more than 50% by shot peening. Surface integrity and fatigue behavior in shot peening 7055 alloy were investigated by Yao et al. 14 They indicated that shot peening induced significant improvement of CRS. Ruschau et al. 15 studied fatigue crack nucleation and growth rate behavior of laser shock–peened titanium, and they found that enhancing CRS can delay the crack initiation and reduce the crack propagation rate. When the fatigue cracks began to propagate, the presence of the CRS field makes the fatigue crack growth rate and stress intensity factor reduce. When the stress intensity factor is lower than the threshold value of the fatigue crack propagation, the fatigue crack propagation will even stop propagating. 16 Liu et al. 17 investigated the effect of shot peening on the high cycle fatigue properties of the Mg-10Gd-3Y alloy. They found that compared with unpeened specimen, crack nucleation region in the peened specimen was smaller, and shot peening–induced CRS have contributed to push the fatigue crack nucleation site from surface to subsurface regions.
Shot peening introduced surface state is very crucial, which plays a key role in the fatigue performances. In this article, The surface properties of Ti1023 titanium alloy shot peened by cast steel and ceramic shot were investigated. The effects of shot peening parameters on surface roughness, surface topography, residual stress, micro-hardness, and micro-structure were analyzed.
Experimental material and procedure
Workpiece material
Ti1023 alloy (Ti-10V-2Fe-3Al) was used in the experiments. Ti1023 alloy is a near-β-phase titanium alloy with high strength and high toughness. The chemical composition of Ti1023 is shown in Table 1. The mechanical properties in normal are shown in Table 2.
Chemical composition of TB6 (mass fraction, %).

Mechanical properties of TB6.

Experimental details
The specific experimental processes are shown in Figure 1. Milling, polishing, and shot peening processes were used to process the Ti1023 specimen. The specimens were polished using waterproof sandpaper to eliminate the milling mark. The shot peening treatment was performed using an MP4000 air blast shot peening machine (Wheelabrator). The cast steel shots with the diameter of 0.28 and 0.58 mm were used. The ceramic shot with the diameter of 0.53 and 1.08 mm were used. For cast steel shot peening, peening intensity of 0.10, 0.18, 0.25, and 0.31 mm A were used. For ceramic shot peening, peening intensity of 0.10 mm N, 0.20 mm N, 0.30 mm N, 0.10 mm A, 0.18 mm A and 0.25 mm A were used. The diameter of the peening nozzle was 10 mm, and the distance between the nozzle and sample was 50 mm. The incident angle was 45°, and the shot peening coverage was 100%. The specific shot peening parameters are shown in Table 3. The surface roughness, surface topography, residual stress, micro-hardness, and micro-structure were tested after the shot-peening experiments.
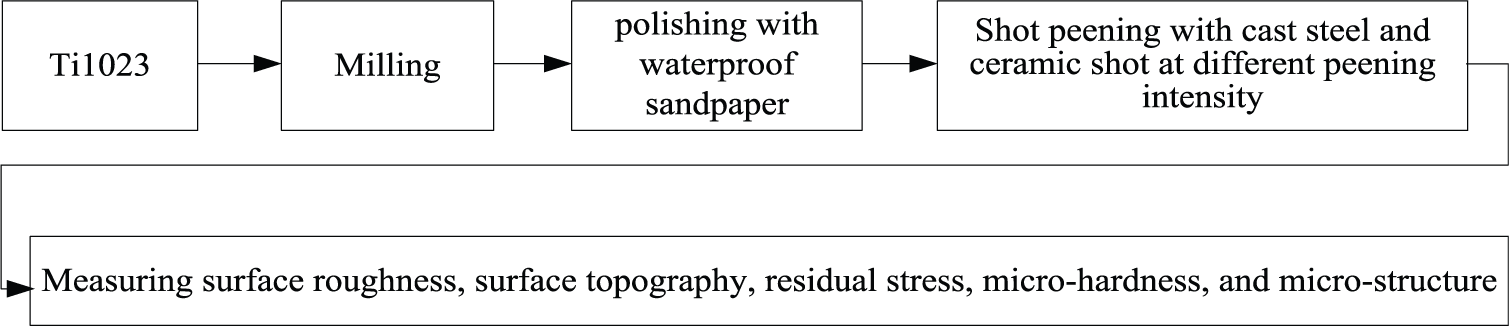
Specific experimental process.
Specific shot-peening parameters of all specimens.

Results
Surface roughness and topography
Surface roughness
Surface roughness was obtained using a stylus-type surface roughness measuring instrument TA620. The cut-off wavelength was 0.8 mm, and the evaluation length was 4 mm. For the sake of statistical significance of the repeatability, the measurements had been performed on five different locations of each specimen surface. The roughness measurement direction was perpendicular to the polishing direction. Average testing values of roughness parameters are reported in Table 4. Where Ra is the arithmetical mean deviation of the profile, Rq is the root mean square deviation of the profile, Rz is 10-point height of irregularities, Rt is the maximum height of the profile, S is the spacing of local peaks of the profile, and Sm is the mean spacing of the profile irregularities.
Average testing value of roughness parameters.

The effects of peening intensity on surface roughness are shown in Figure 2. As we can see, specimen 7 has the lowest Ra, Rq, Rz, Rt, S, and Sm of 0.43, 0.57, 2.32, 5.15, 62.14, and 81.5 μm, respectively. It is because specimen 7 was treated by ceramic shots (dshot = 0.53 mm) with fA = 0.1 mm N being used, which induced slight surface plastic deformation. The highest surface roughness is exhibited on specimen 6. The Ra, Rq, Rz, Rt, S, and Sm are 3.7, 4.44, 11.45, 20.36, 103.44, and 160.26 μm, respectively. It is because specimen 6 was treated by steel shots (dshot = 0.58 mm) at peening intensity of fA = 0.31 mm A. The high peening intensity makes the specimen surface suffer severe plastic deformation. For two kinds of shots employed, roughness height parameters (Ra, Rq, Rz, and Rt) and roughness spacing parameters (S, Sm) markedly increase with the increase in fA. This is attributed to the increased surface plastic deformation. However, when fA of ceramic shots (dshot = 1.08 mm) reaches 0.18 mm A, roughness spacing parameters (S, Sm) slightly decrease with further increase in the fA. Which is mainly because that the plastic deformation of material surface reaches the maximum extent. It can be seen from specimens 3 and 5, when shot diameter dshot increases from 0.28 to 0.58 mm, roughness height parameters (Ra, Rq, Rz, and Rt) decrease and roughness spacing parameters (S, Sm) increase.

Surface roughness: (a) cast steel shot, dshot = 0.28 mm; (b) cast steel shot, dshot = 0.58 mm; (c) ceramic shot, dshot = 0.53 mm; and (d) ceramic shot, dshot = 1.08 mm.
Surface topography and surface profile
The surface topographies were obtained using a measuring microscope IFM-G4 (Alicona, Austria). The measuring region size for each sample were 1.0826 × 1.4271 mm2. Surface topographies and profiles induced by steel shots are shown in Figure 3. It can be observed that evenly distributed dimples remain on all surfaces. Burr-like features are observed between the dimple boundaries. The highest point of the burrs and the lowest point of the dimples become the peak and valley of the surface profile. As seen from Figure 3(a), the specimen surface is characterized by the quite small and dense craters. And the corresponding surface profile is flat. It is because that the peening intensity of fA = 0.10 mm A was used. As fA increases to 0.25 mm A, the treated surface becomes fluctuating and the dent diameter increases. The corresponding surface profile becomes undulating (Figure 3(b)). As we all know, the higher the peening intensity, the more serious the plastic deformation. In Figure 3(c)–(e), the steel shots with dshot = 0.58 mm was used. As fA increases from 0.18 to 0.31 mm A, the diameter of dimples increases and the surface profile peaks and valleys increase. As shown in Figure 3(b) and (d), the peening intensity of fA = 0.25 mm A was used, as dshot increases from 0.28 to 0.58 mm, the diameter of dimples increases.

Surface topographies and profiles induced by cast steel shot peening: (a) for specimen 1 (Ra = 1.16 μm), (b) for specimen 3 (Ra = 3.19 μm), (c) for specimen 4 (Ra = 2.05 μm), (d) for specimen 5 (Ra = 2.93 μm), and (e) for specimen 6 (Ra = 3.7 μm).
Surface topographies and profiles induced by ceramic shots are shown in Figure 4. In Figure 4(a), small-size dimples and polishing marks are observed on the surface. The corresponding surface profile is flat. It is because that the peening intensity of fA = 0.1 mm N was used. As fA increases to 0.2 mm N, the diameter of dimples increases, and the polishing marks still appear on the surface (Figure 4(b)). As fA increases to 0.3 mm N, well-developed dimples are observed on the surface (Figure 4(c)). In Figure 4(d), the target surface is almost untreated. More homogeneous and regular topography can be observed with further increase in the fA (Figure 4(e) and (f)).

Surface topographies and profiles induced by ceramic shot peening: (a) for specimen 7 (Ra = 0.43 μm), (b) for specimen 8 (Ra = 0.69 μm), (c) for specimen 9 (Ra = 1.23 μm), (d) for specimen 10 (Ra = 0.63 μm), (e) for specimen 11 (Ra = 1.91 μm), and (f) for specimen 12 (Ra = 2.03 μm).
Residual stress
The residual stresses and the width of the diffraction peak in half of its height FWHM were measured using an LXRD MG2000 test system (PROTO, Canada) with Cu-K-Alpha radiation and a Bragg angle of 142° in the {hkl-213} plane. Irradiated area was 0.5 mm2, and the sin2ψ method was used. The exposure time was 2 s, and the number of exposures was 10. The voltage was 25 kV, and the current was 30 mA. Measurements were carried out at 11 diffraction angles. The residual stresses both in the longitudinal and transverse directions were measured. To obtain the depth distribution of the residual stress, the specimen surface was electropolished with a saturated solution of CH3OH:C6H14O2:HClO4 = 59:35:6 to expose deeper layers. The thickness removed was checked with a micrometer.
To describe the compressive residual stress field (CRSF), five characteristic parameters are named in Figure 5. The five characteristic parameters are as follows: surface residual stress σrsur, subsurface compressive peak stress σrmax, near-zero residual stress σr0, distance of subsurface compressive peak stress from surface hrm, and depth of CRSF hr. These characteristic parameters reveal three key points ((0,σrsur), (hrm, σrmax), (hr,σr0)) in CRS distribution. In Figure 5, A represents the values of σrsur, B represents the values of σrmax, and C represents the values of σr0.

Residual stress characteristic parameters.
Residual stress distributions of shot-peened specimens are shown in Figures 6 and 7. In Figures 6 and 7, A1–A12 are the values of σrsur of different specimens. The B1–B12 are the values of σrmax of different specimens. The C1–C12 are the values of σr0 of different specimens. The hrm1–hrm12 are the values of hrm of different specimens. The hr1–hr12 are the values of hr of different specimens.

Residual stress distributions induced by cast steel shot peening: (a) residual stress in x-direction, dshot = 0.28 mm; (b) residual stress in y-direction, dshot = 0.28 mm; (c) residual stress in x-direction, dshot = 0.58 mm; and (d) residual stress in y-direction, dshot = 0.58 mm.
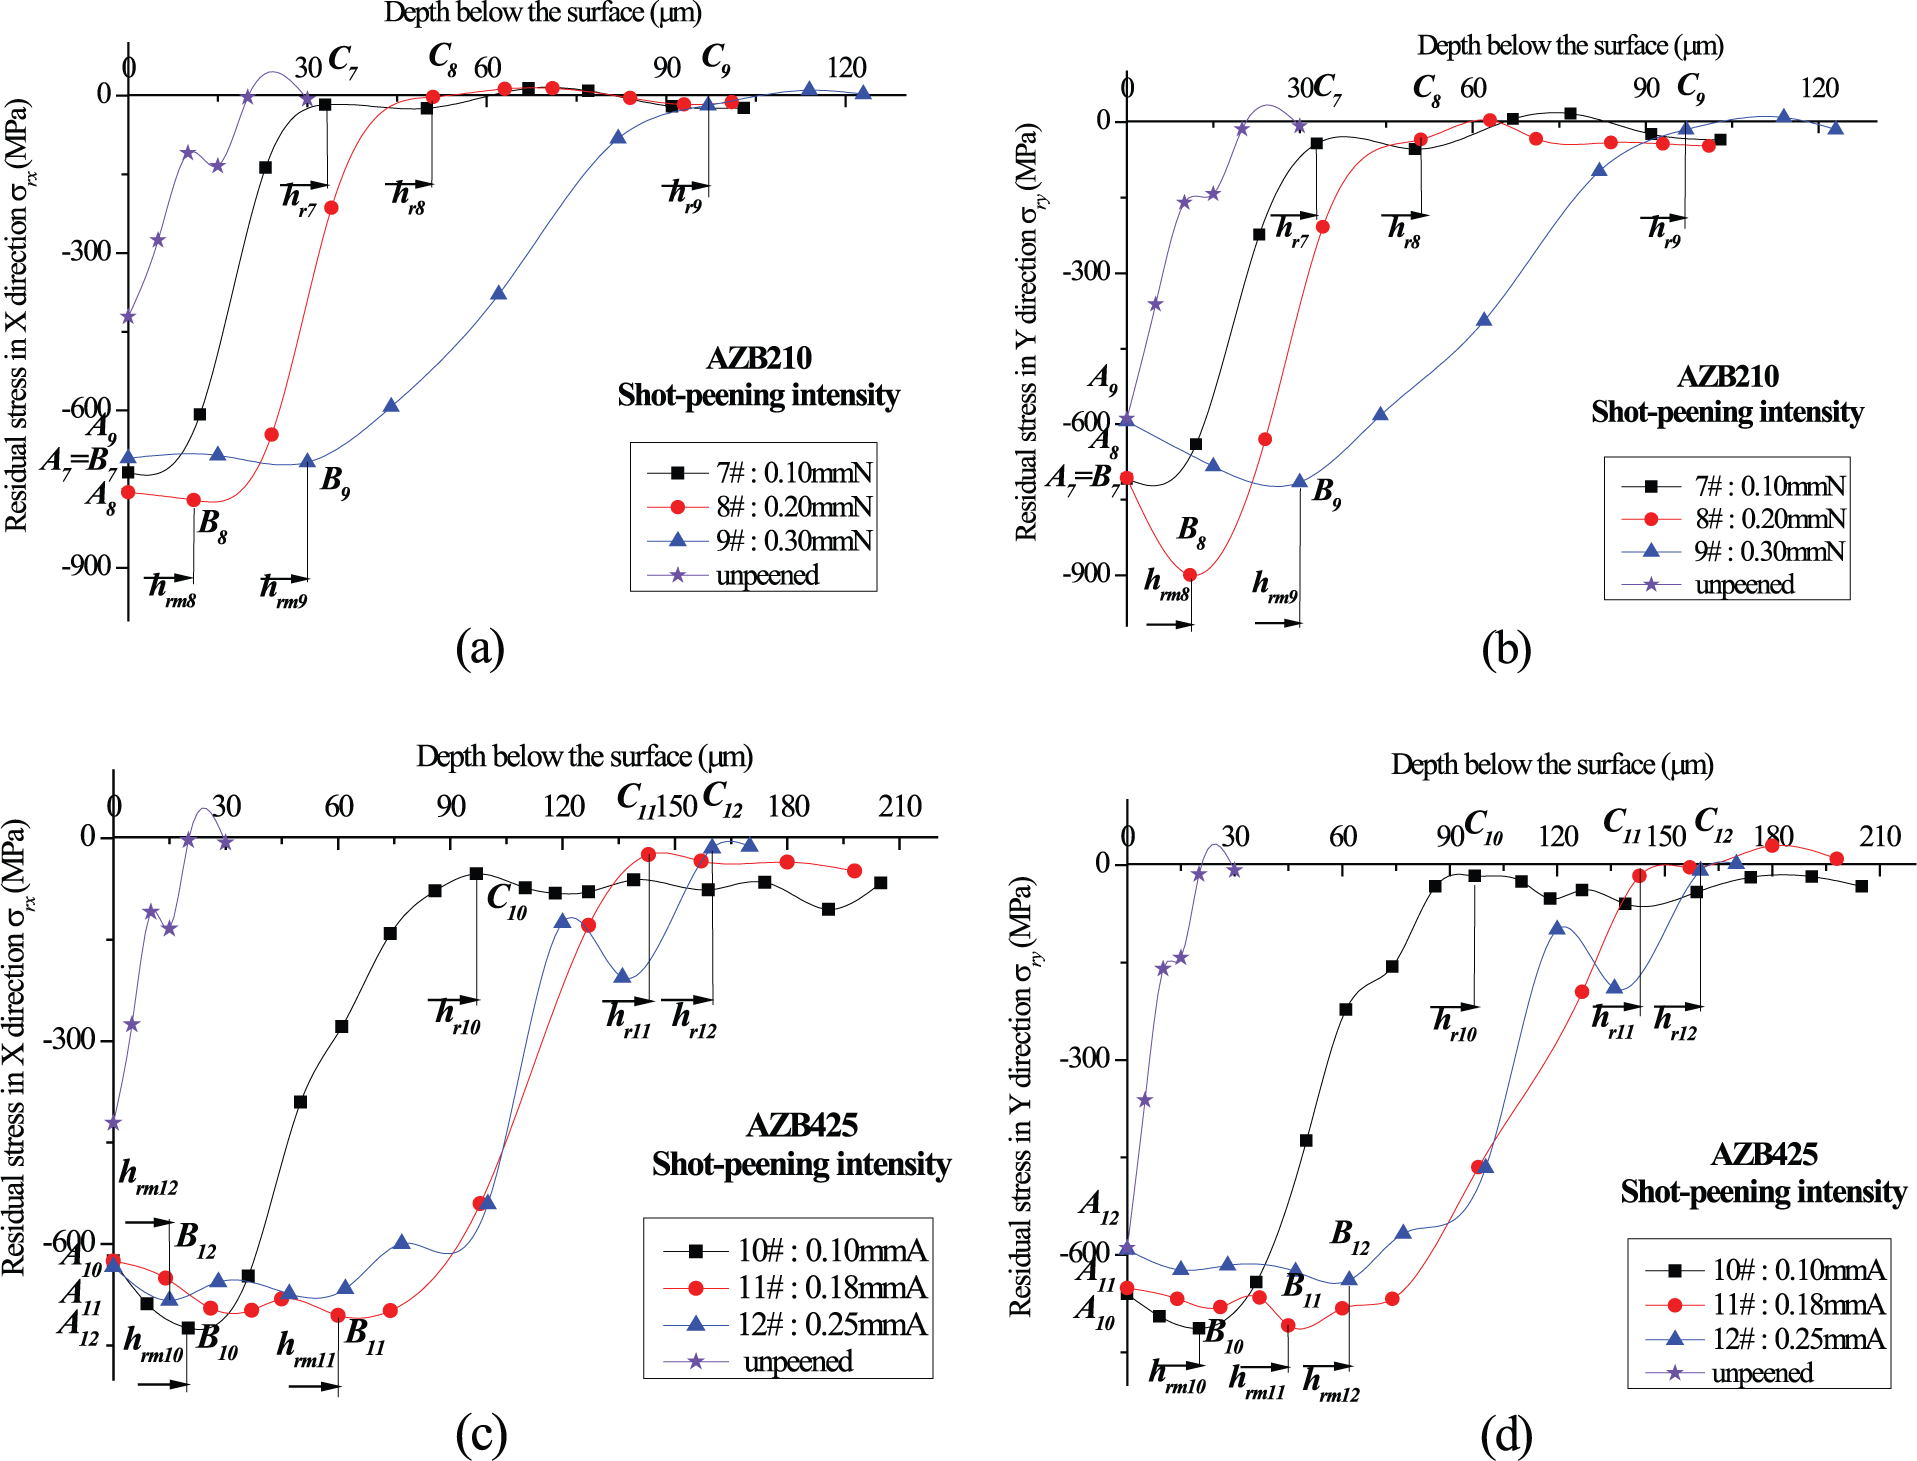
Residual stress distributions induced by ceramic shot peening: (a) residual stress in x-direction, dshot = 0.53 mm; (b) residual stress in y-direction, dshot = 0.53 mm; (c) residual stress in x-direction, dshot = 1.08 mm; and (d) residual stress in y-direction, dshot = 1.08 mm.
In Figures 6 and 7, investigation of shot peening residual stress and affect depth reveals significant increases in untreated samples. The CRSs on the surface are extremely high; the residual stresses rapidly increase with the depth to the compressive peak stresses and then stabilize at a near-zero value. Residual stress distributions induced by cast steel shot peening are shown in Figure 6. In Figure 6(a) and (b), when fA = 0.1 mm A, the CRS is confined to a shallow surface layer, within 108 μm in depth. σrsur in x-direction is 635.65 MPa, and σrsur in y-direction is much higher (752.87 MPa). The σrmax in x- and y-directions are around 746.06 and 756.68 MPa, respectively, located 50 and 15 μm below the surface. As fA increases to 0.25 mm A, the obtained CRS increased evidently. In Figure 6(c) and (d), when fA = 0.18 mm A, σrsur in x-direction is 560.44 MPa, and it is higher (678.54 MPa) in y-direction. The σrmax in x-direction is around 741.64 MPa, situated 30 μm below the surface. The σrmax in y-direction is 749.88 MPa, located 44 μm from the surface. The CRSs in x- and y-directions are stabilized at a depth of 153 μm, while the similar CRSF can be obtained from specimens 5 and 6.
In Figure 7(a) and (b), when fA = 0.1 mm N, the σrmax in x- and y-directions appears on the surface, they are 718.5 and 708.48 MPa, respectively. The residual stresses in x- and y-directions are stabilized at a depth of 33 μm. As fA increases to 0.3 mm N, the σrmax in x- and y-directions is pushed to the subsurface, and the obtained CRSF becomes much broaden. In Figure 7(c) and (d), when fA = 0.1 mm A, σrsur in x- and y-directions is 624.44 and 659.84 MPa, respectively. The σrmax changed little in x- and y-directions, around 723.96 and 713.08 MPa, respectively. They reach within 20 μm from the surface. The residual stresses in x- and y-directions are stabilized at a depth of 97 μm, while the similar CRSF can be obtained from specimens 11 and 12.
The variation ranges of residual stress distributions are shown in Figure 8. In Figure 8, the changes in peening parameters mainly affect the value of hrm and hr. Compared with cast steel shot peening, residual stress distributions induced by ceramic shot can be obtained in wider variation range.

Variation ranges of residual stress distributions: (a) cast steel shot peening and (b) ceramic shot peening.
Micro-hardness
The micro-hardness was measured using a semi-automatic digital micro-hardness testing system FEM-8000 (FUTURE-TECH, Japan) with a test load of 25 g and a dwell time of 10 s. To obtain the depth distribution of the micro-hardness, the specimen was mounted in an embedded machine and experienced coarse grinding, precise grinding, and polishing. The micro-hardness in the subsurface was measured by moving 10–20 μm under the surface until it approached the hardness of the body material. The micro-hardness distributions induced by cast steel and ceramic shot peening are shown in Figures 9 and 10. After shot peening, micro-hardness measurements indicate significant work hardening appears on the surface layer. And the depths of the hardened layer are 100–200 μm. The micro-hardness gradually decreases with the depth and then stabilizes at the hardness of untreated materials.

Micro-hardness distributions induced by cast steel shot peening: (a) dshot = 0.28 mm and (b) dshot = 0.58 mm.
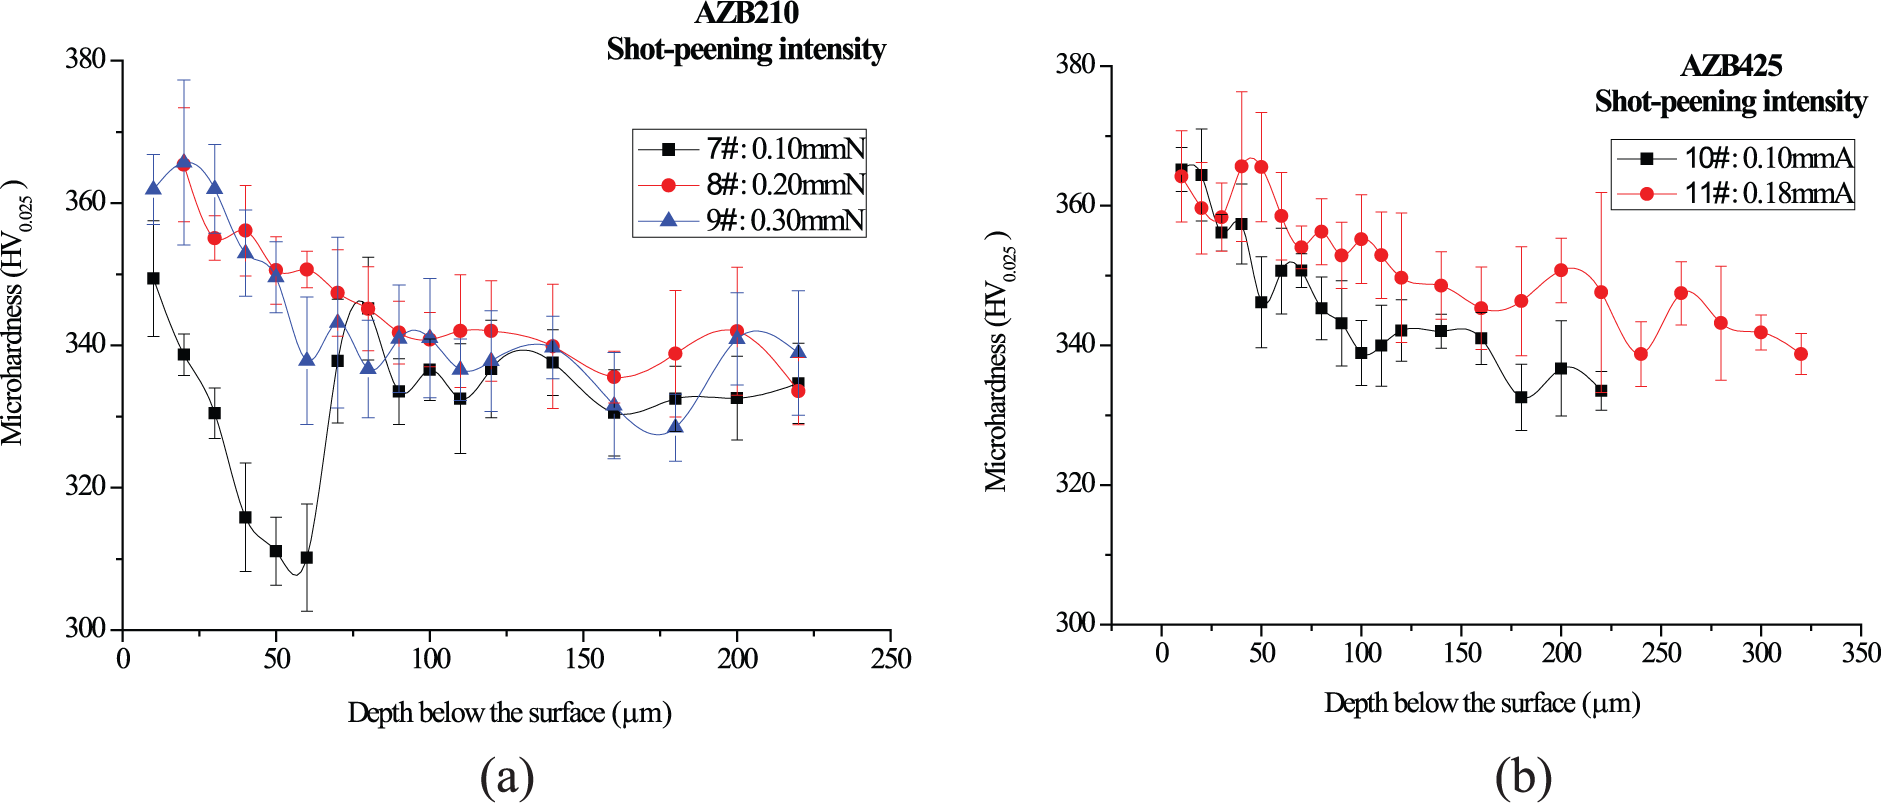
Micro-hardness distributions induced by ceramic shot peening: (a) dshot = 0.53 mm and (b) dshot = 1.08 mm.
The width of the diffraction peak in half of its height (FWHM) distributions is presented in Figure 11. Since the FWHM value obtained directly from the LXRD MG2000 test system has a certain degree of deviation, this paper only studies the variation trend of FWHM. In Figure 11, the maximum values of FWHM are presented at the top surface and then reduced gradually with the increment of depth.
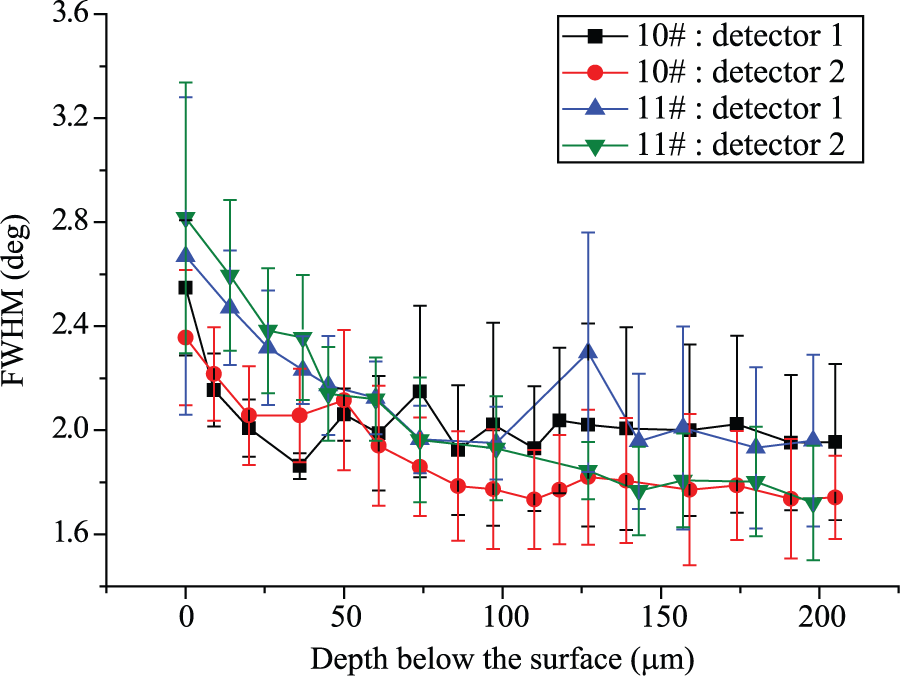
The FWHM distributions.
Micro-structure
Cross sections of all specimens were observed using an JSM-6360 scanning electron microscopy. The micro-structures induced by cast steel and ceramic shot peening are shown in Figures 12 and 13, respectively. It clearly shows the micro-structure with an even distribution of α structures within the larger β grains. In all the shot-peened specimens, new phases are not formed. A plastically deformed region is observed in the top surface for all the samples. The plastically deformed region is characterized by the grains that are elongated and rotated along the shot peening direction, and the plastic flow becomes severe with decreasing depth.

Micro-structure induced by cast steel shot peening: (a) for specimen 1 (fA = 0.1 mm A, dshot = 0.28 mm), (b) for specimen 2 (fA = 0.18 mm A, dshot = 0.28 mm), (c) for specimen 3 (fA = 0.25 mm A, dshot = 0.28 mm), (d) for specimen 4 (fA = 0.18 mm A, dshot = 0.58 mm), (e) for specimen 5 (fA = 0.25 mm A, dshot = 0.58 mm), and (f) for specimen 6 (fA = 0.31 mm A, dshot = 0.58 mm).

Micro-structure induced by ceramic shot peening: (a) for specimen 7 (fA = 0.1 mm N, dshot = 0.53 mm), (b) for specimen 8 (fA = 0.20 mm N, dshot = 0.53 mm), (c) for specimen 9 (fA = 0.3 mm N, dshot = 0.53 mm), (d) for specimen 10 (fA = 0.1 mm A, dshot = 1.08 mm), and (e) for specimen 11 (fA = 0.18 mm A, dshot = 1.08 mm).
In Figure 12(a), the plastically deformed layer depth hM is about 25 μm. When fA = 0.18 mm A, hM increases to 35 μm (Figure 12(b)), and the deformed layer depth hM increases to about 50 μm with fA increases to 0.25 mm A (Figure 12(c)). In Figure 12(d)–(f), hM increases from 20 to 55 μm with fA increases from 0.18 to 0.31 mm A. In Figure 12(b) and (d), hM decreases from 35 to 20 μm with dshot increases from 0.28 to 0.58 mm. As can be seen in Figure 12(c) and (e), hM decreases from 50 to 40 μm with dshot increases from 0.28 to 0.58 mm. Figure 12 indicated that the hM increases with the increase in fA when dshot is a certain value. And the hM decreases with the increased dshot when fA is a certain value. As illustrated in Figure 12(b) and (c), very dense structures are represented on the top surface, which exhibited significant severe plastic deformation. The elongated grains are almost parallel to the shot-peened surface. The depths of grain refinement layers reach 10 μm. The micro-structure induced by ceramic shot peening without significant plastic deformation occurs (Figure 13).
The FWHM is related both to residual micro-strain (ε) and to domain size (D) in the material. According to Scherrer equation, the D and the ε of the (2 1 3) peak can be calculated directly using equations (1) and (2).

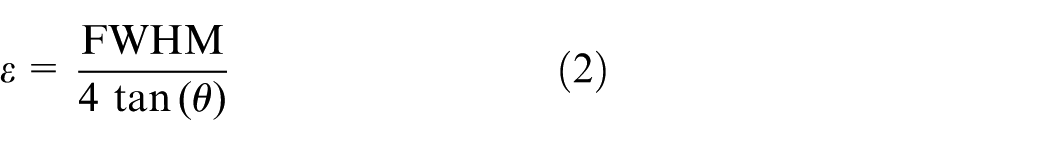
where λ is the wavelength of X radiation (nm), FWHM is the width of the diffraction peak in half of its height (rad), and θ is Bragg angle (°). In the calculation of domain size and micro-strain, due to ignore the instrumental broaden, making the calculation results have a certain error, where we only study the distribution trend of domain size and micro-strain. It can be seen in Figure 14, the maximum value of ε is present at the top surface and then reduces gradually with the increment in depth. The variations in D are contrary with those of ε.
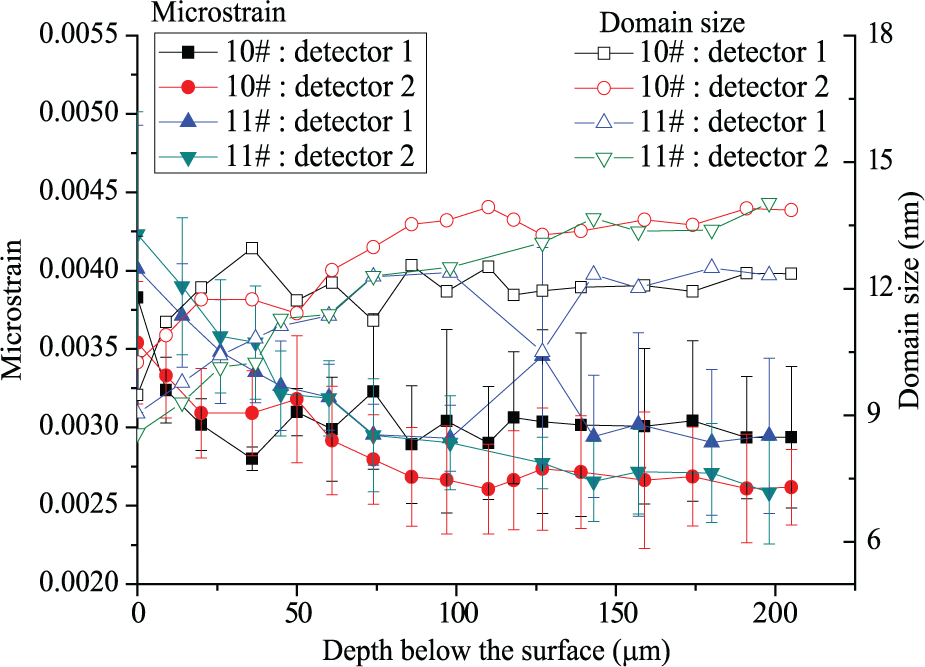
The distributions of the domain sizes and the micro-strain.
Discussion
Surface roughness is one of the important properties for the aerospace structural parts. Roughness height parameters and roughness spacing parameters all increase with the increasing of fA. Literatures3,16–18 also found that the surface roughness increases with an increased Almen intensity. With the increase in dshot, roughness height parameters decrease and spacing parameters increase. Similar findings were found in Ahmed et al. 19 It is indicated that surface roughness induced by shot peening is sensitive to the peening intensity and dshot. Machining marks are still present in a part of the ceramic shot-peening surface, and absence in cast steel shot peening. Cast steel shot peening can completely cover the machining marks, but also produces large impact craters. Nam et al. 20 reported that under the best shot-peening conditions, well-developed dimples can be observed with clear boundaries and uniform curved shapes. However, over-peening leads to sharp burr-like features between the dimple boundaries, as well as more micro-cracks.
The characteristic value of residual stress is shown in Figure 15. In Figure 15(a), with the increase in fA, the σrsur in x- and y-directions has a generally declining trend. The σrsur induced by cast steel shot peening is slightly less than that of ceramic shot. In Figure 15(b), the σrmax is not sensitive to the change in dshot and fA. It is mainly because that the σrmax is affected mainly by the target metal itself. Because σrmax is introduced by plastic deformation, it can be expressed by ultimate tensile strength (σb) of the metals. A linear relationship between σrmax and σb was indicated by Brodrick. 21 In Figure 15(c) and (d), the affect depths hrm and hr increase significantly with increment in fA when other parameters are fixed. Since fA is directly related to the impact velocity of shots, the increased fA produces more impact kinetic energy and induces a greater degree of plastic deformation. 16 Gao 8 reported that with peening intensity increasing from 0.15 to 0.35 mm A, the affect depths hrm of TC18 increases from 70 to 80 μm, and the hr increases from 170 to 220 μm. However, the affect depths hrm and hr of Ti1023 alloy almost unchanged when steel shots (dshot = 0.58 mm) with fA = 0.25 and 0.31 mm A was used. It is because that when fA reached a certain threshold value, the plastic deformation of specimen was limited and CRS could not continue to increase. 16 For cast steel shot peening, the affect depths hrm and hr slightly increase with the increment in dshot when fA is fixed. Robertson 22 found that with increasing shot size, maximum compressive stress was located at the further subsurface and stress cure increased wider. It can be seen that the hrm and hr which induced by cast steel shot peening are higher than those of ceramic shot. The reason of the larger depth is attributed to high hardness and density of cast steel shots and the correspondingly high kinetic energy that the shots transmit to the treated surface. Gao and Wu 23 demonstrated that fatigue life extension by shot peening can be attributed to beneficial CRSs in the surface layer.

The characteristic value of residual stress: (a) surface residual stress: σrsur, (b) subsurface compressive peak stress: σrmax, (c) the distance of subsurface compressive peak stress from surface: hrm, and (d) the depth of compressive residual stress field: hr.
Micro-hardness investigations reveal that micro-hardness increases with increasing shot peening intensity. Wang et al. 24 reported that shot peening as a work-hardening process induced the refined grain and improved dislocation density that contributes to enhance the micro-hardness. Scanning electron microscope (SEM) observations indicate that the depth of deformation layer increases with increase in the fA and decrease in dshot. It is clear that the plastic deformation layer depths induced by cast steel shot peening are much deeper than those of ceramic shots. Which is attributed to different shot hardness, density, and correspondingly the kinetic energy that the shots transmit to the treated surface. Liu et al. 25 found that ultrafine grain depth of TC17 is about 14.8 μm at the air pressure of 0.35 MPa and processing duration of 15 min. The smaller the grain size, the more the grain boundaries, which induced more obstacles and produced more hinders during the shot crack propagation. Thus, a small grain size can enhance the fatigue crack initiation threshold and decrease the crack growth rate. 26
Conclusion
The fatigue performance of shot peening–treated specimen depends on the combined effects of surface roughness, work hardening, and CRS. A very appropriate shot-peening parameter should be chosen in order to obtain the optimal surface properties. In this investigation, the effects of shot-peening parameters on the surface properties have been studied in detail.
With the increase in fA, surface roughness parameters Ra, Rq, Rz, Rt, S, and Sm increase. While the increased shot diameter dshot results in decreased Ra, Rq, Rz, Rt and increased S and Sm, specimen 7 have the lowest Ra, Rq, Rz, and Rt of 0.43, 0.57, 2.32, and 5.15 μm, respectively. Machining marks are still present on the ceramics shot-peening surface, and cast steel shot-peening surface is completely covered with dents. All the surface topographies induced by cast steel shot peening are much rougher than those of ceramic shots.
The CRSs obtained by shot peening are much larger than those of unpeened specimen. Only the σrmax of specimen 7 occurs on the surface of specimen, which is attributed to the small peening intensity of 0.1 mm N used. After shot peening, σrmax is not sensitive to the change in fA and dshot, which is affected mainly by the metal itself. With the increase in fA and dshot, the affect depths hr of all specimens increase. Similar results were presented in Gao 8 and Robertson. 22
In surface layer, the micro-hardness measurements indicate significant work hardening. As the shot peening intensity increase, the depth of work hardening layer increase.
From SEM observation, the depth of deformation layer increases with increase in fA and decrease in dshot. The plastic deformation layer depths induced by cast steel shot peening are much deeper than those of ceramic shots. The plastic deformation layer is characterized by the grains that are elongated and rotated along the shot-peening direction.
The improved CRSF and hardness contributed to the fatigue strength enhancement. 27 However, the enhanced surface roughness always caused many micro-cracks and sharp burr-like features, which can serve as crack initiators. 20 Specimen 11 has a low surface roughness of Ra = 1.91 μm, well-developed dimples topography, higher CRS layer depth of 143 μm, and higher hardened layer depth of 200 μm. In this work, the ceramic shot with a diameter of 1.08 mm and peening intensity of 0.18 mm A is the optimal shot-peening condition.
Footnotes
Academic Editor: Francesco Massi
Declaration of conflicting interests
The author(s) declared no potential conflicts of interest with respect to the research, authorship, and/or publication of this article.
Funding
The author(s) disclosed receipt of the following financial support for the research, authorship, and/or publication of this article: This study was supported by the National Natural Science Foundation of China (Grant No. 51375393) and Aeronautical Science Foundation of China (Grant No. 2013ZE53060).