
Abstract
Orthogonal experiments were conducted to investigate the effects of parameters on surface integrity in milling 7055 aluminum alloy. In order to correlate metamorphic layer with thermal and mechanical phenomena developed during milling, milling force and temperature fields of machined surface were obtained with finite element method, while milling speed and feed per tooth were paid particular attention to study formation of metamorphic layer. Experiment results show that when milling speed, feed per tooth, milling depth, and milling width are 1100 m/min, 0.02 mm/z, 0.7 mm, and 6 mm, respectively, obtained surface roughness, surface residual stress in X direction, surface residual stress in Y direction, and surface micro-hardness are Ra 0.258 µm, −123 MPa, −137 MPa, and 193.76 HV0.025, respectively. From precision machining to rough machining, depth of compressive residual stress layer increases from 35 to 45 µm, and the depth of plastic deformation layer increases from 5 to 20 µm. Finally, the formation of metamorphic layer can be explained by thermo-mechanical coupling effects.
Keywords
Introduction
High-strength aluminum alloy is widely used in aerospace because of its low density, high strength, and good machinability. 7055 is a new type of aluminum alloys, which is obtained by increase in impurity of Zn and Cu and decrease in impurity of Fe and Si on 7050 aluminum alloys. The results show that 7055 has higher strength and fracture toughness than 7050 aluminum alloy. To improve processing efficiency and surface integrity of aluminum alloy, high-speed milling technology is widely applied in aluminum alloy process. Surface integrity is an important indicator to evaluate surface quality of the part, which has a certain influence on wear resistance, fatigue resistance, and corrosion resistance of parts. We must focus on the control of surface integrity in machining of high-strength alloy materials.
Many scholars from various countries conducted positive researches on surface integrity of high-speed milled aluminum alloy. De Lacalle et al. 1 studied the cutting conditions and tool optimization in high-speed milling of aluminum alloys. Asad et al. 2 investigated the effects of cutting speed and depth of cut on chip morphology and surface finish for down-cut milling case. Sriyotha et al. 3 studied geometrical modeling of a ball-end finish milling process for a surface finish. They focused on the modeling method and theory adopted in the simulation system, and the method to improve the calculation accuracy was discussed in detail. Niknam and Songmene 4 found that the effects of cutting tool, feed per tooth, and depth of cut on slot milling burrs are significant. Yang et al. 5 reported that the obtained surface roughness <0.4 µm when milling depth, feed per tooth, and milling speed are 0.3 mm, 0.05 mm/z, and 7500 m/min respectively. Bi et al. 6 investigated the distribution of temperature area in high speed of 7050 aluminum alloy. Rao and Shin 7 reported that a high cutting speed leads to a high chip flow angle, very low thrust forces, and a high shear angle, while producing a thinner chip in high-speed milling of 7075. Ng et al. 8 investigated that cutting edge radius has a more substantial effect on the resultant cutting forces than the radial rake angle. With smaller cutting edge radius, the un-deformed chip thickness magnitude at which ploughing will occur is reduced. Muñoz-Escalona and Maropoulos 9 studied the artificial neural networks for surface roughness prediction when face milling 7075-T7351 aluminum and found the cutting speed is the most important cutting parameter affecting the machined surface integrity from Pearson’s correlation analysis. Sivasakthivel and Sudhakaran 10 reported that the optimal combination of machining parameters for minimum temperature of 0.173 °C was found to be 42°, 2,870 r/min, 0.03 mm/rev, 1.7 mm, and 3.4 mm for helix angle, spindle speed, feed rate, axial, and radial depth of cut, respectively. Liu and Barash 11 studied the micro-hardness distribution on surface and subsurface in low cutting speed of specimens using the finite element method. Denkena et al. 12 found that an increase in the feed per tooth, a decrease in the width of cut, or the application of higher radii at the secondary cutting edge lead to more pronounced compressive residual stresses at higher workpiece depths. Tang et al. 13 reported that thermal load plays a significant role in the superficial residual stresses in high-speed milling aluminum alloy. Raju et al. 14 reported that the feed rate is a dominant parameter and surface roughness increases rapidly with the increase in feed rate and decreases with increase in spindle speed, whereas the effect of depth of cut is not regular. Mc Clung 15 provided a broad and extensive literature survey addressing the stability of surface and near-surface residual stress fields during fatigue, including redistribution and relaxation due to static mechanical load, repeated cyclic loads, thermal exposure, and crack extension. Starke and Staley 16 cover the performance and property requirements for airframe components in current aircraft and describe aluminum alloys and product forms that meet these requirements. They also discuss the structure/property relationships of aluminum aircraft alloys and describe the background and drivers for the development of modern aluminum alloys to improve performance. Suresh Kumar Reddy et al. 17 reported that the presence of the reinforcement enhances the machinability in terms of both surface roughness and lower tendency to clog the cutting tool, when compared to a non-reinforced Al alloy. Ryu et al. 18 reported that surface roughness in the middle area where center of the tool bottom passes is worse than that in the side area by about 7 µm in Rmax and 1.5 µm in Ra under general finishing conditions. Chern 19 found that the machining guideline in face milling is to choose a large in-plane exit angle at about 150° and set the depth of cut at a larger value than the corresponding critical depth of cut, so as to reduce burr size effectively through the formation of secondary burr. Chen et al. 20 reported that there exists a critical cutting speed in the high-speed milling of aluminum alloy. The value of this critical peed is different for different cutting conditions. The heat flux flowing into the workpiece increases when the spindle speed increases. When the cutting speed exceeds the critical speed, the increase in heat flux flowing into the workpiece will decrease. Jayakumar et al. 21 found that increase in volume % of SiCp reinforcement over the matrix results in higher tool–work interface temperature and needs higher cutting force during machining process. El-Axir 22 found that residual stress plays an important role for controlling the behavior of fatigue in ball burnishing of aluminum alloy 6061-T6. Akhavan Farid et al. 23 reported that drilling parameters have significant effects on the surface quality and integrity of the drilled hole during high-speed drilling of Al–Si using a high-speed steel drill. Zhang et al. 24 found that both block thickness and quench media had critical influences on residual stresses.
Although a lot of researches in high-speed milling of aluminum alloys have been done, the current research often focuses on 7050 and 7075 to study surface roughness and residual stresses. Moreover, formation of metamorphic layers is not well correlated to important experimental physical phenomena such as dynamic milling force and milling temperature. The objective of this article is to investigate the effects of milling parameters on surface integrity in high-speed milling of 7055. To be able to correlate metamorphic layer with the thermal and mechanical phenomena developed during milling, milling force and milling temperature fields were obtained with finite element method. Finally, the formation of metamorphic layer can be explained by thermo-mechanical coupling effects.
Experimental conditions and procedure
Workpiece material and preparation of samples
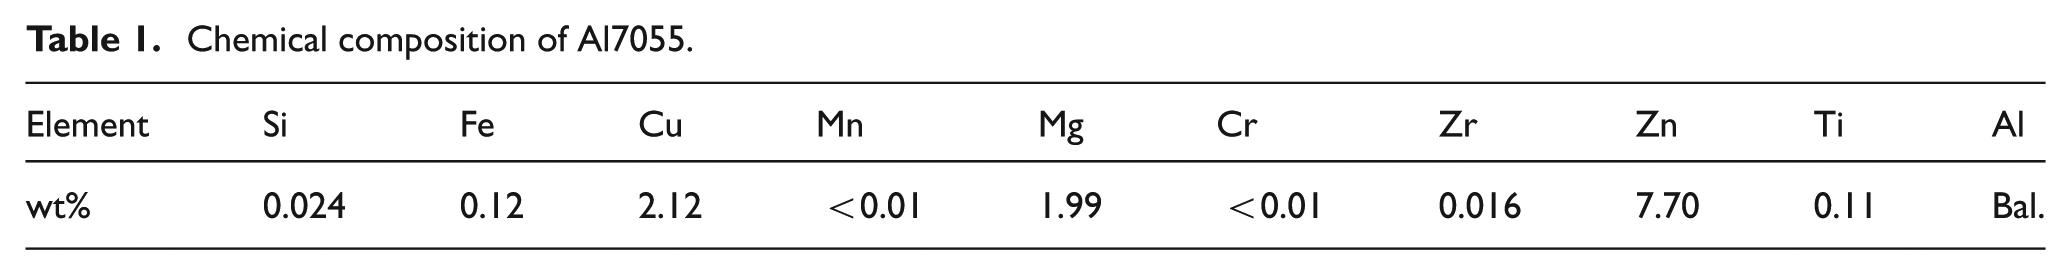
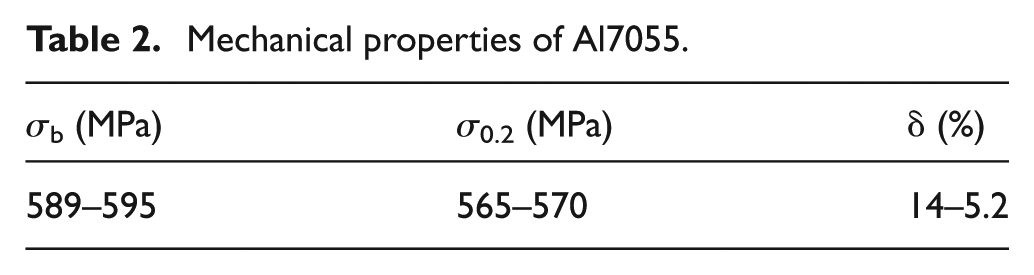
Workpiece material used in all experiments is aluminum alloy 7055. Chemical compositions of the alloy are given in Table 1, and mechanical properties of the alloy are shown in Table 2.
Chemical composition of Al7055.
Mechanical properties of Al7055.
Experimental scheme
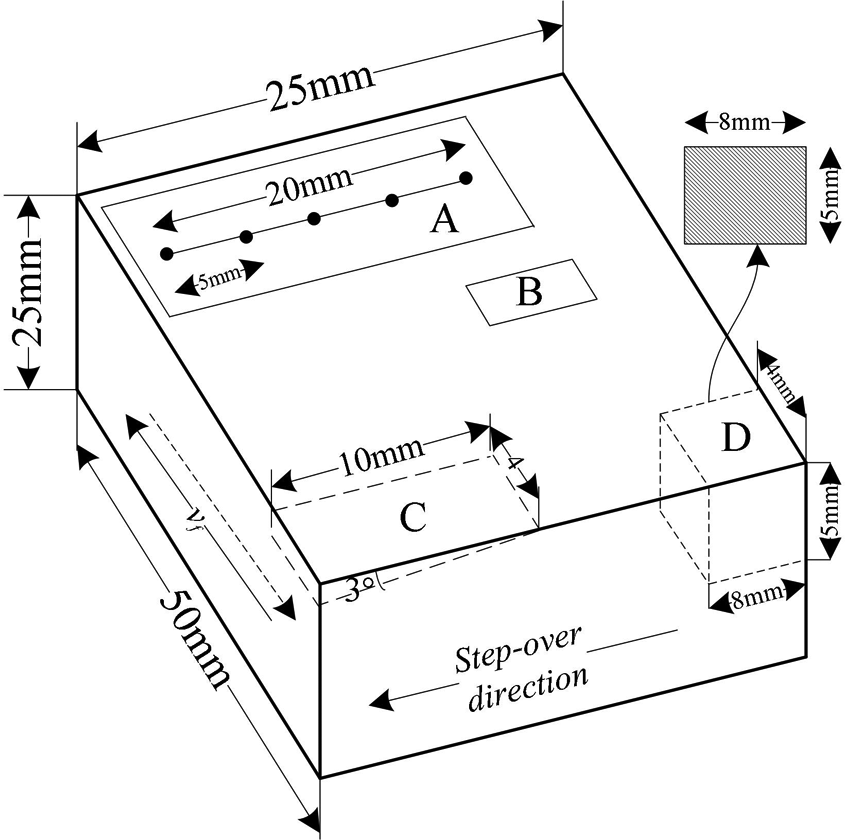
The experiments were conducted on a Mikron HSM 800 with emulsified liquid. Machine spindle is capable of running up to 36,000 r/min with Heidenhain iTNC 530 CNC system. End-milling and down-milling were used. The three-flute uncoated cemented carbide end-milling cutter was used, and its diameter is 12 mm. The dimension of the specimen is 50 mm × 25 mm × 25 mm, as shown in Figure 1. High-speed milling procedure is shown in Figure 2.
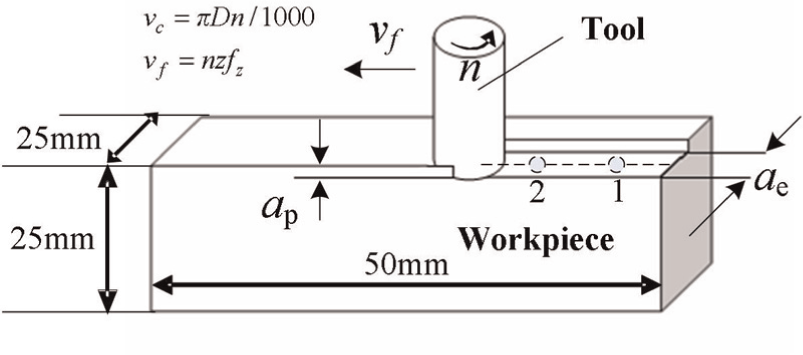
End-milling diagram.
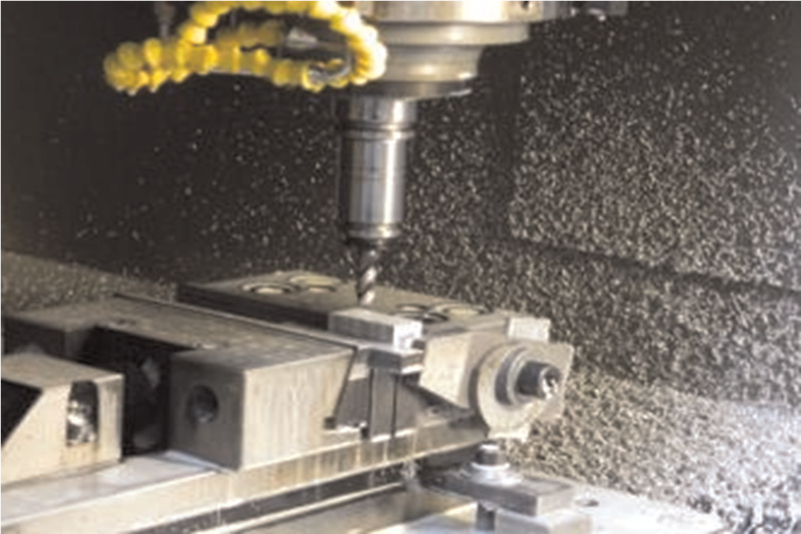
High-speed milling procedure.
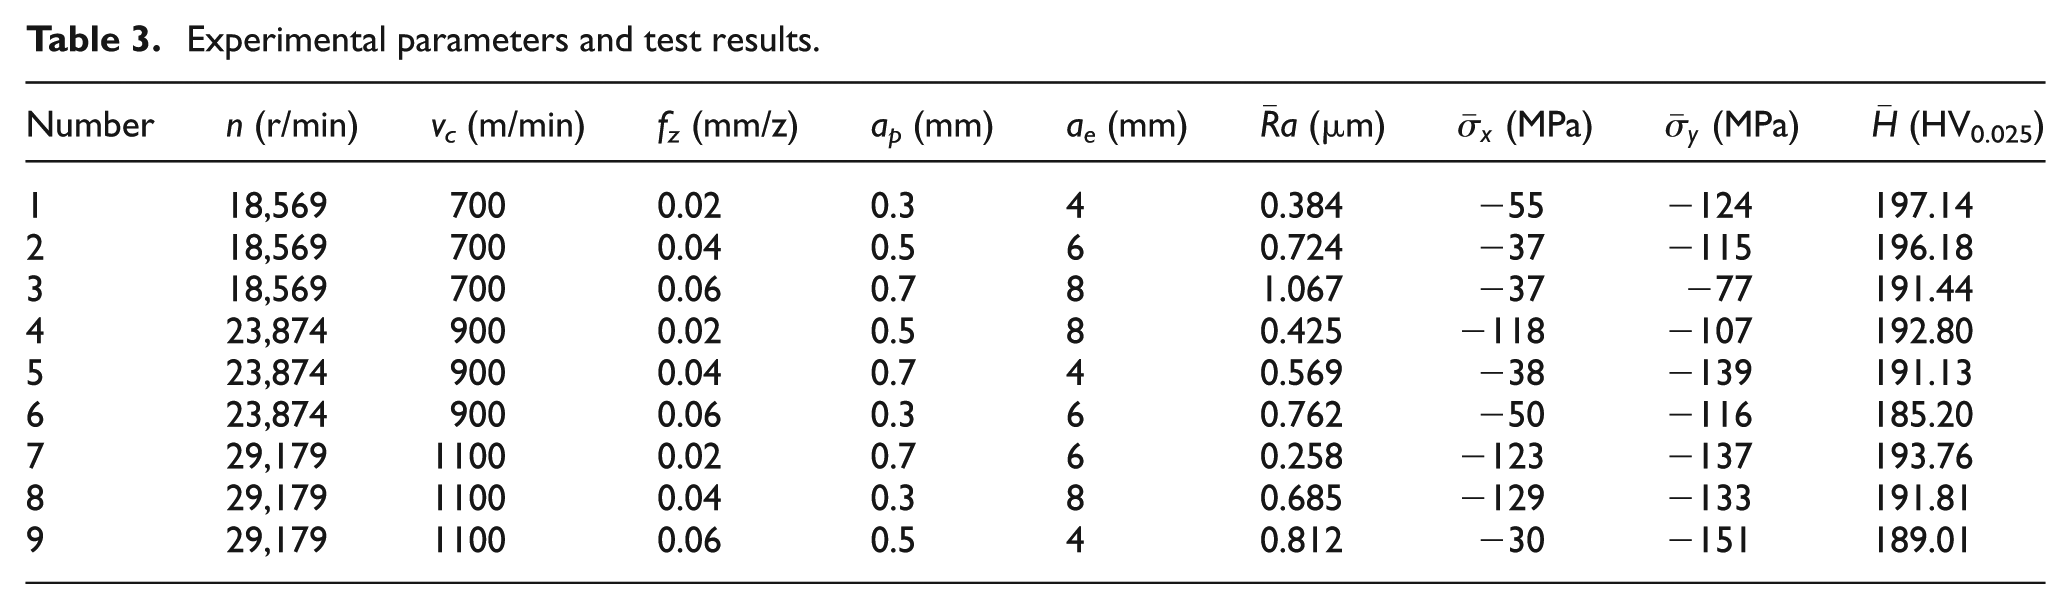
In order to study the effects of end-milling parameters on surface integrity, orthogonal experiments of four factors and three levels were conducted. Every specimen was machined using a new cutter. The experiment parameters and test results are shown in Table 3.
Experimental parameters and test results.
Surface integrity testing
Testing method for surface integrity is very important. Surface integrity testing regions for milled surface are shown in Figure 3. For the sake of statistical significance of the repeatability, multiple measurements were made for the same physical and the average testing values computed are shown in Table 3.
Surface integrity testing regions for milled surface.
Surface roughness and topography
The three-dimensional (3D) optical surface topography tester Veeco NT1100 was applied to measure surface roughness and surface topography. The magnification was 10 times. The measuring resolution was 736 × 480, and the measuring region size of each sample was 830.22 × 830.22 nm2. Measurement precision can reach 0.01 nm. Choosing five points along the milling direction in region A on the machined surface, the surface roughness and surface topography of each sample are shown in Figure 3.
Residual stress
The residual stress on workpiece was tested by Proto LXRD MG2000 residual stress test analysis system. Using aluminum alloy, block calibrates the instrument before measurement; measured residual stress for zero-stress aluminum of 99.5% is close to 0. When CoKαavg = 1.790 Å, 2θ = 148.9°, and
Micro-hardness
Micro-hardness was tested using FEM-8000 semi-automatic digital micro-hardness testing system. Test force was set as 25 g, and the time of keeping load was set as 10 s in the testing process. Measurement precision can reach 0.01 MPa. The selecting three equidistant points, perpendicular to the feed direction in region C on the machined surface shown in Figure 3, were set to test the micro-hardness. The average micro-hardness testing results are shown in Table 3. In order to obtain the micro-hardness distribution in the depth direction, the specimen was mounted in embedded machine, and then coarse grinding, precise grinding, and polishing were done to measure the material micro-hardness. Micro-hardness was measured one time by moving 10 µm under the surface until close to the body material’s hardness.
Microstructure
The metallographic test sample was made through cutting machined sample along the milling direction and is shown as region D in Figure 3. Then, the cutted section was corroded after abrading and polishing. The corrodent was matched as HNO3:HF:H2O = 1:1:10. The microstructure of the cutted section was observed with DMI 5000 M.
Experiment results and analysis
Surface integrity control law
Surface roughness and topography
Mathematical model for surface roughness
Surface roughness mathematical model was built up by multiple linear regression analysis based on the data in Table 3
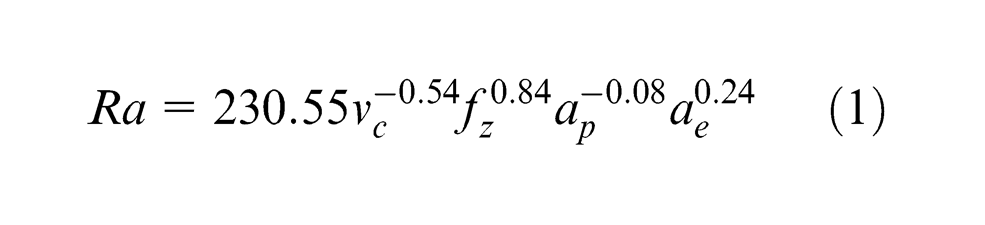
The average error and significance of the model are 8.1% and 0.013, respectively. From the model, surface roughness is most sensitive to fz, secondarily sensitive to vc and ae, and least sensitive to ap. Surface roughness increases with the increase in fz and ae and gradually decreases with the increase in vc and ap.
Calculation of extremum difference
Extremum difference analysis was used to study the effects of milling parameters on surface roughness. On the basis of the data in Table 3, range analysis table for
Range analysis table for
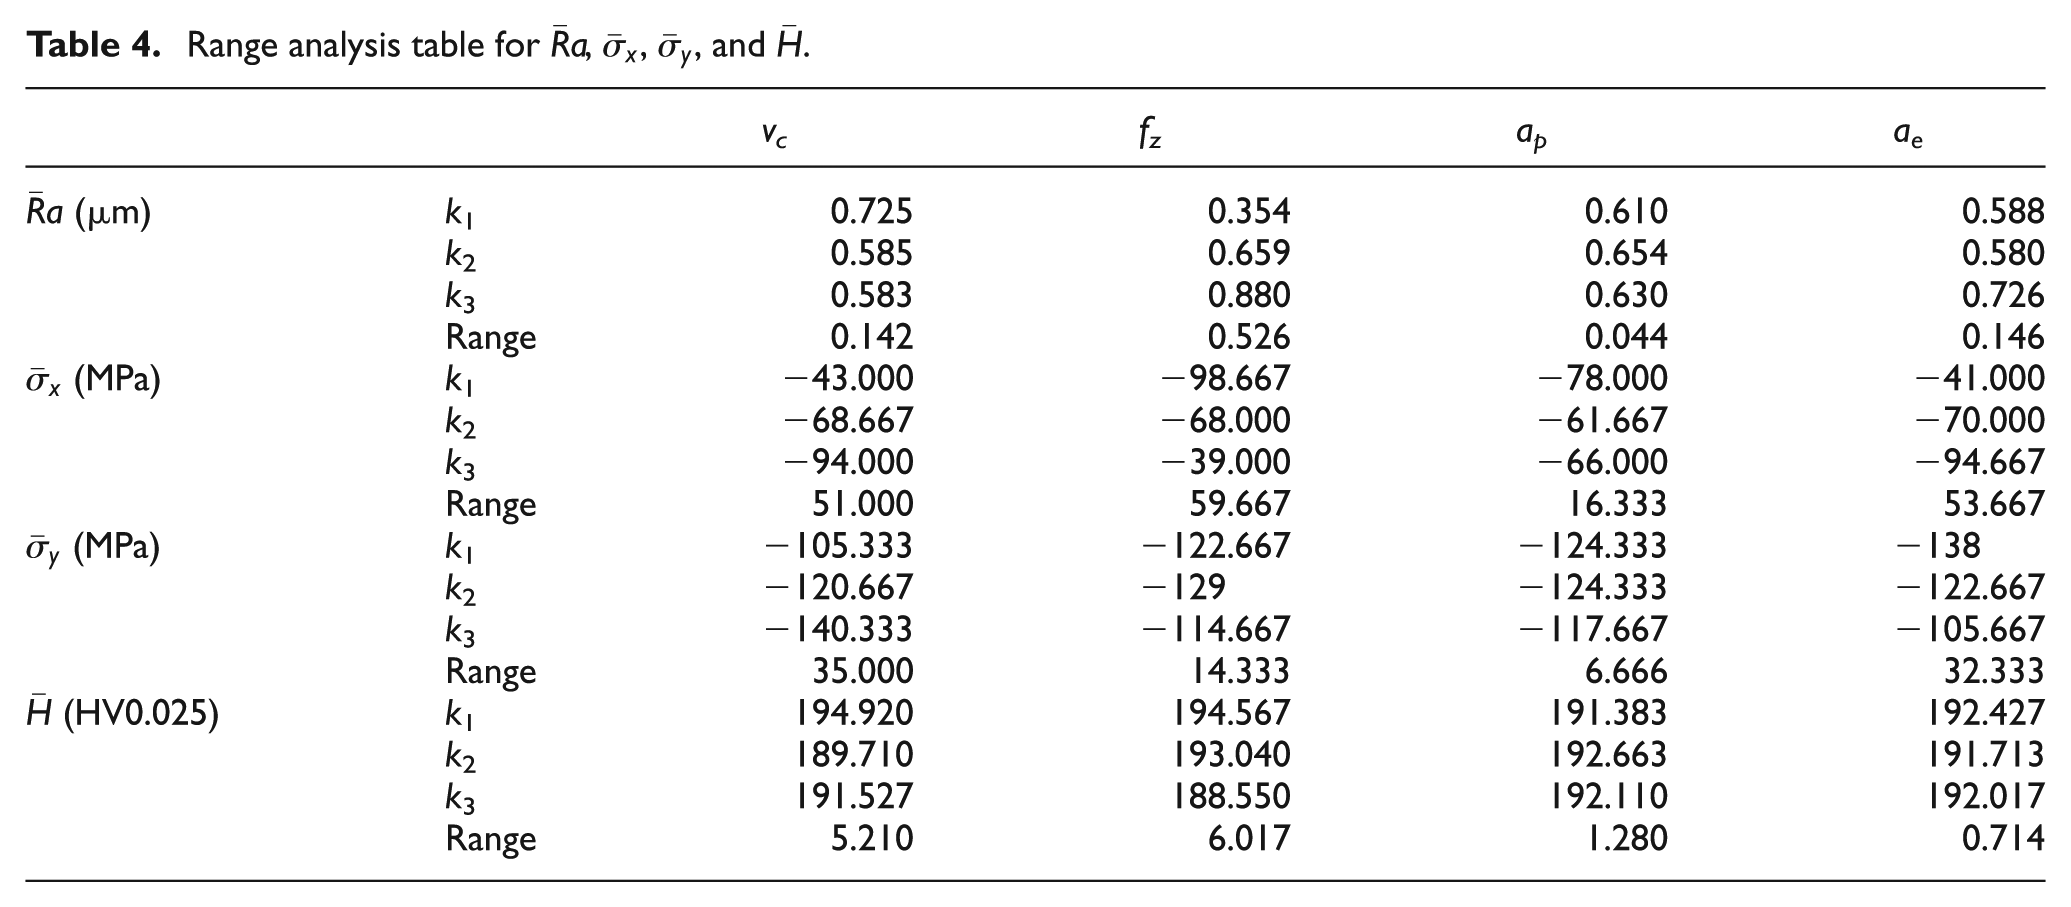
In Table 4, for surface roughness, surface residual stress, and surface micro-hardness, k1, k2, and k3 are the average values when the factor takes value at the corresponding level, respectively, and range is the extremum difference of the maximum and the minimum. 25
From Table 4, the ranges of surface roughness for vc, fz, ap, and ae are 0.142, 0.526, 0.044, and 0.146 µm, respectively. So, surface roughness is most sensitive to fz, secondarily sensitive to ae and vc, and least sensitive to ap, same as the result of the mathematical model (equation (1)).
Effects of milling parameters on surface roughness
The effect of milling parameters on surface roughness is obtained by extremum difference analysis, as shown in Figure 4. The effect of vc on surface roughness is given in Figure 4(a). When vc increases from 700 to 1100 m/min, surface roughness gets better and decreases from Ra 0.725 to 0.585 µm. This may be due to the induced softening material by the raise of cutting temperature when vc increases.
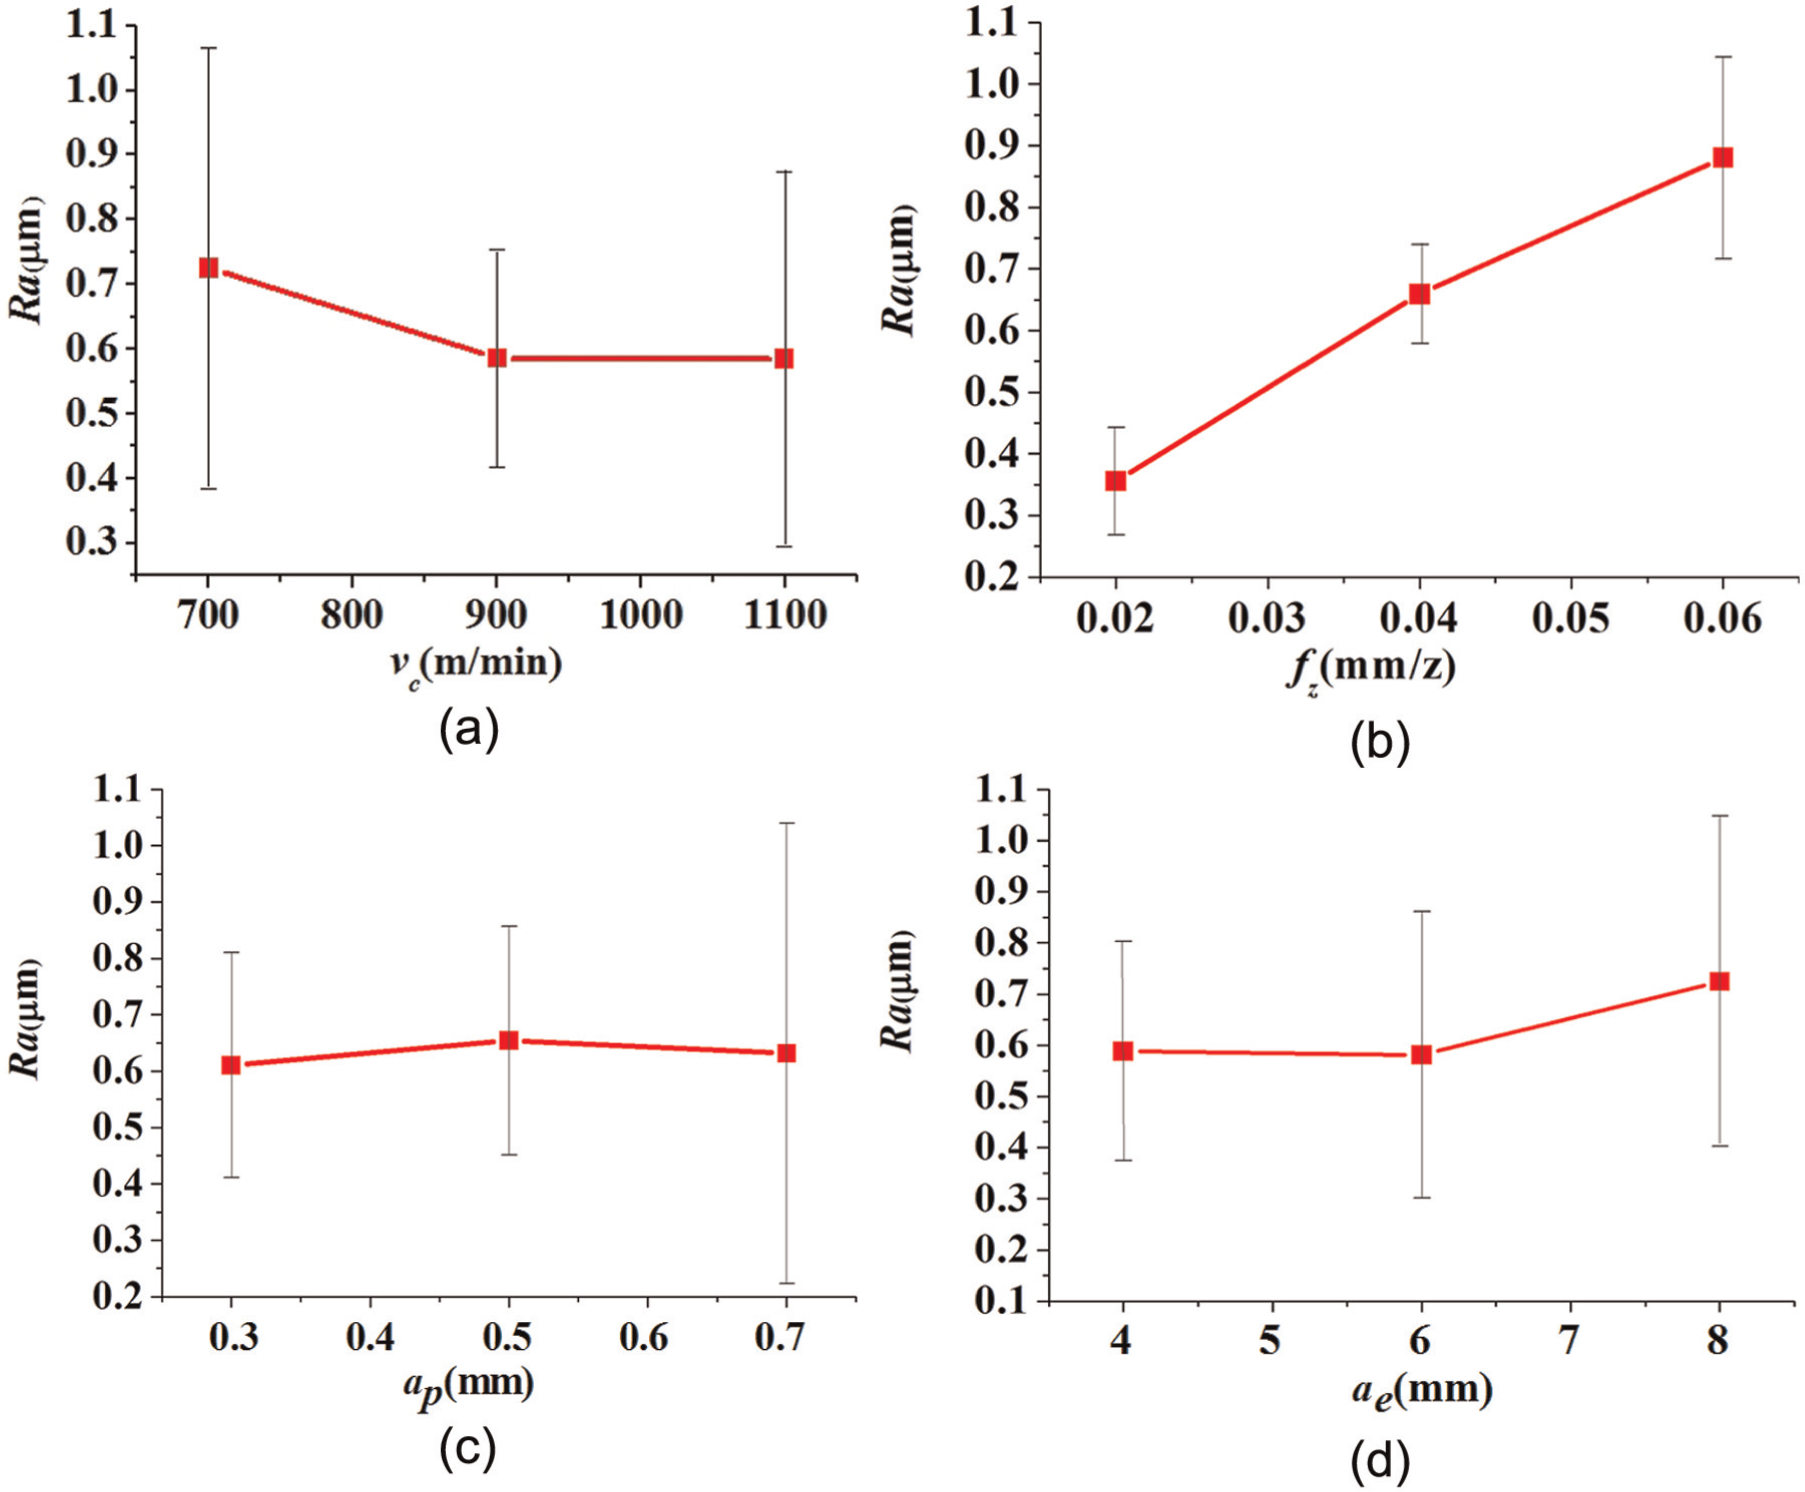
Effect of milling parameters on surface roughness: (a) effect of vc on surface roughness, (b) effect of fz on surface roughness, (c) effect of ap on surface roughness, and (d) effect of ae on surface roughness.
The effect of fz on the surface roughness is given in Figure 4(b). From geometrical factors, reducing feed rate can reduce the height of residual area. Thereby reducing the feed rate can reduce surface roughness. As fz increases from 0.02 to 0.06 mm/z, surface roughness increases linearly in the range 0.356–0.880 µm.
The effect of ap on surface roughness is given in Figure 4(c). Milling depth has little effect on surface roughness. As ap increases from 0.3 to 0.7 mm, surface roughness increases from Ra 0.610 to 0.654 µm. This is due to the milling force fluctuations caused by the change in cutting depth. With the increase in milling force, when ap increases, the effect of milling force fluctuations on surface roughness also increases.
The effect of ae on surface roughness is given in Figure 4(d). As ae increases from 4 to 6 mm, surface roughness decreases slowly from Ra 0.588 to 0.584 µm. When ae ranges from 6 to 8 mm, surface roughness increases drastically from Ra 0.581 to 0.726 µm.
Interaction effects of milling parameters on surface roughness
For the selection of milling parameters, the interaction effect of milling parameters on surface roughness should also be considered. The effect of milling parameters interaction on surface roughness is shown in Figure 5.
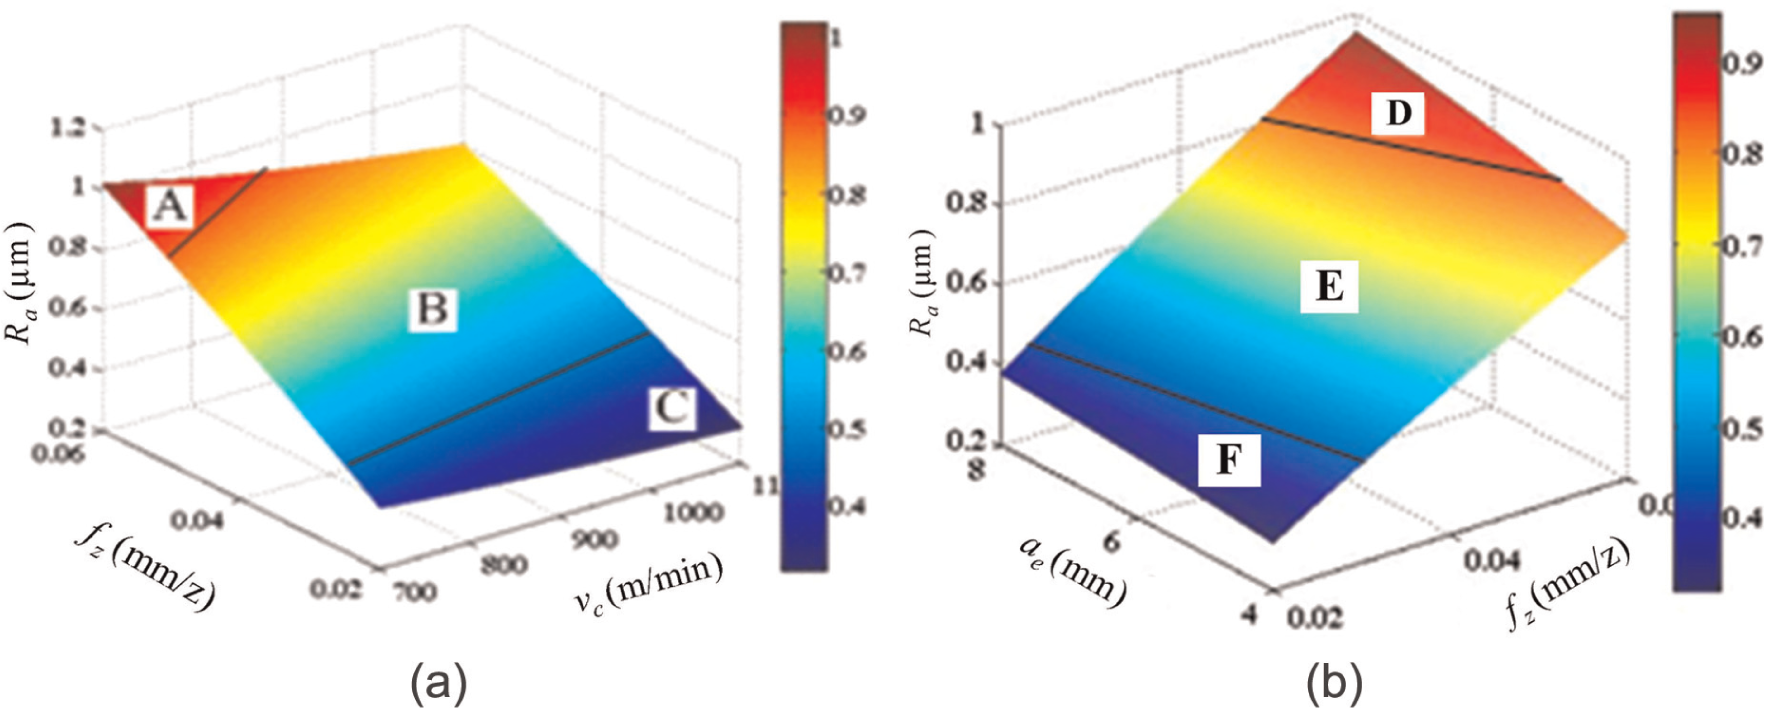
Interaction effect of milling parameters on surface roughness: (a) interaction effect of vc and fz on Ra and (b) interaction effect of fz and ae on Ra.
Figure 5(a) shows that the worse surface roughness appears in region A: low vc and high fz, and surface roughness is larger than Ra 0.9 µm. The better surface roughness appears in region C: high vc and low fz, and surface roughness is less than Ra 0.6 µm. Surface roughness in region B is between regions A and C and is from Ra 0.5 to 0.9 µm.
Figure 5(b) shows that worse surface roughness appears in region D: high ae and high fz, and surface roughness is larger than Ra 0.8 µm. The better surface roughness appears in region F: low ae and low fz, and surface roughness is less than Ra 0.5 µm. Region E was the transition region of regions F and D, and surface roughness ranges from Ra 0.5 to 0.8 µm.
Effect of milling parameters on surface topography
The machined surface topography is a comprehensive action of extrusion and tearing, elastic deformation and plastic deformation, and thermal–mechanical coupling. Figure 6 shows the typical 3D surface topography in high-speed milling of 7055 aluminum alloy. The peaks have more opportunity to contact with the cutter edge, and chip formation can be obtained. The valleys are driven up by the slip deformation due to ploughing action. The final surface profile after continuous cutting is determined by the cutting and ploughing actions. The machined surface topography has the regularity, which consists of high and low regions generated by cutter edge.
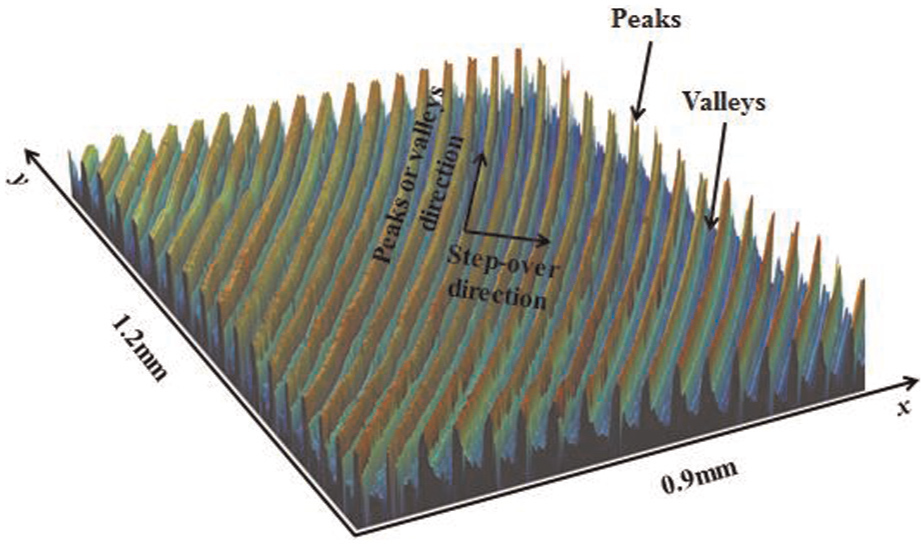
3D surface topography of milled 7055 alloy.
From surface topography of specimens 1–9 shown in Figure 7, surface topography can be affected by different proportions of vc and fz. In Figure 7(a), (d), and (g), with the increase in vc, better surface can be obtained. For fz = 0.02 mm/z, the distance between two corresponding peaks is equal no matter what vc is. In Figure 7(g), (h), and (i), narrow groove and firm texture are obtained when fz = 0.02 mm/z. However, wide groove and sparse texture can be obtained when fz = 0.04 or 0.06 mm/z. With the increase in fz, the peak-to-valley height in the surface topography gets higher, and the distance between two corresponding peaks gets larger.
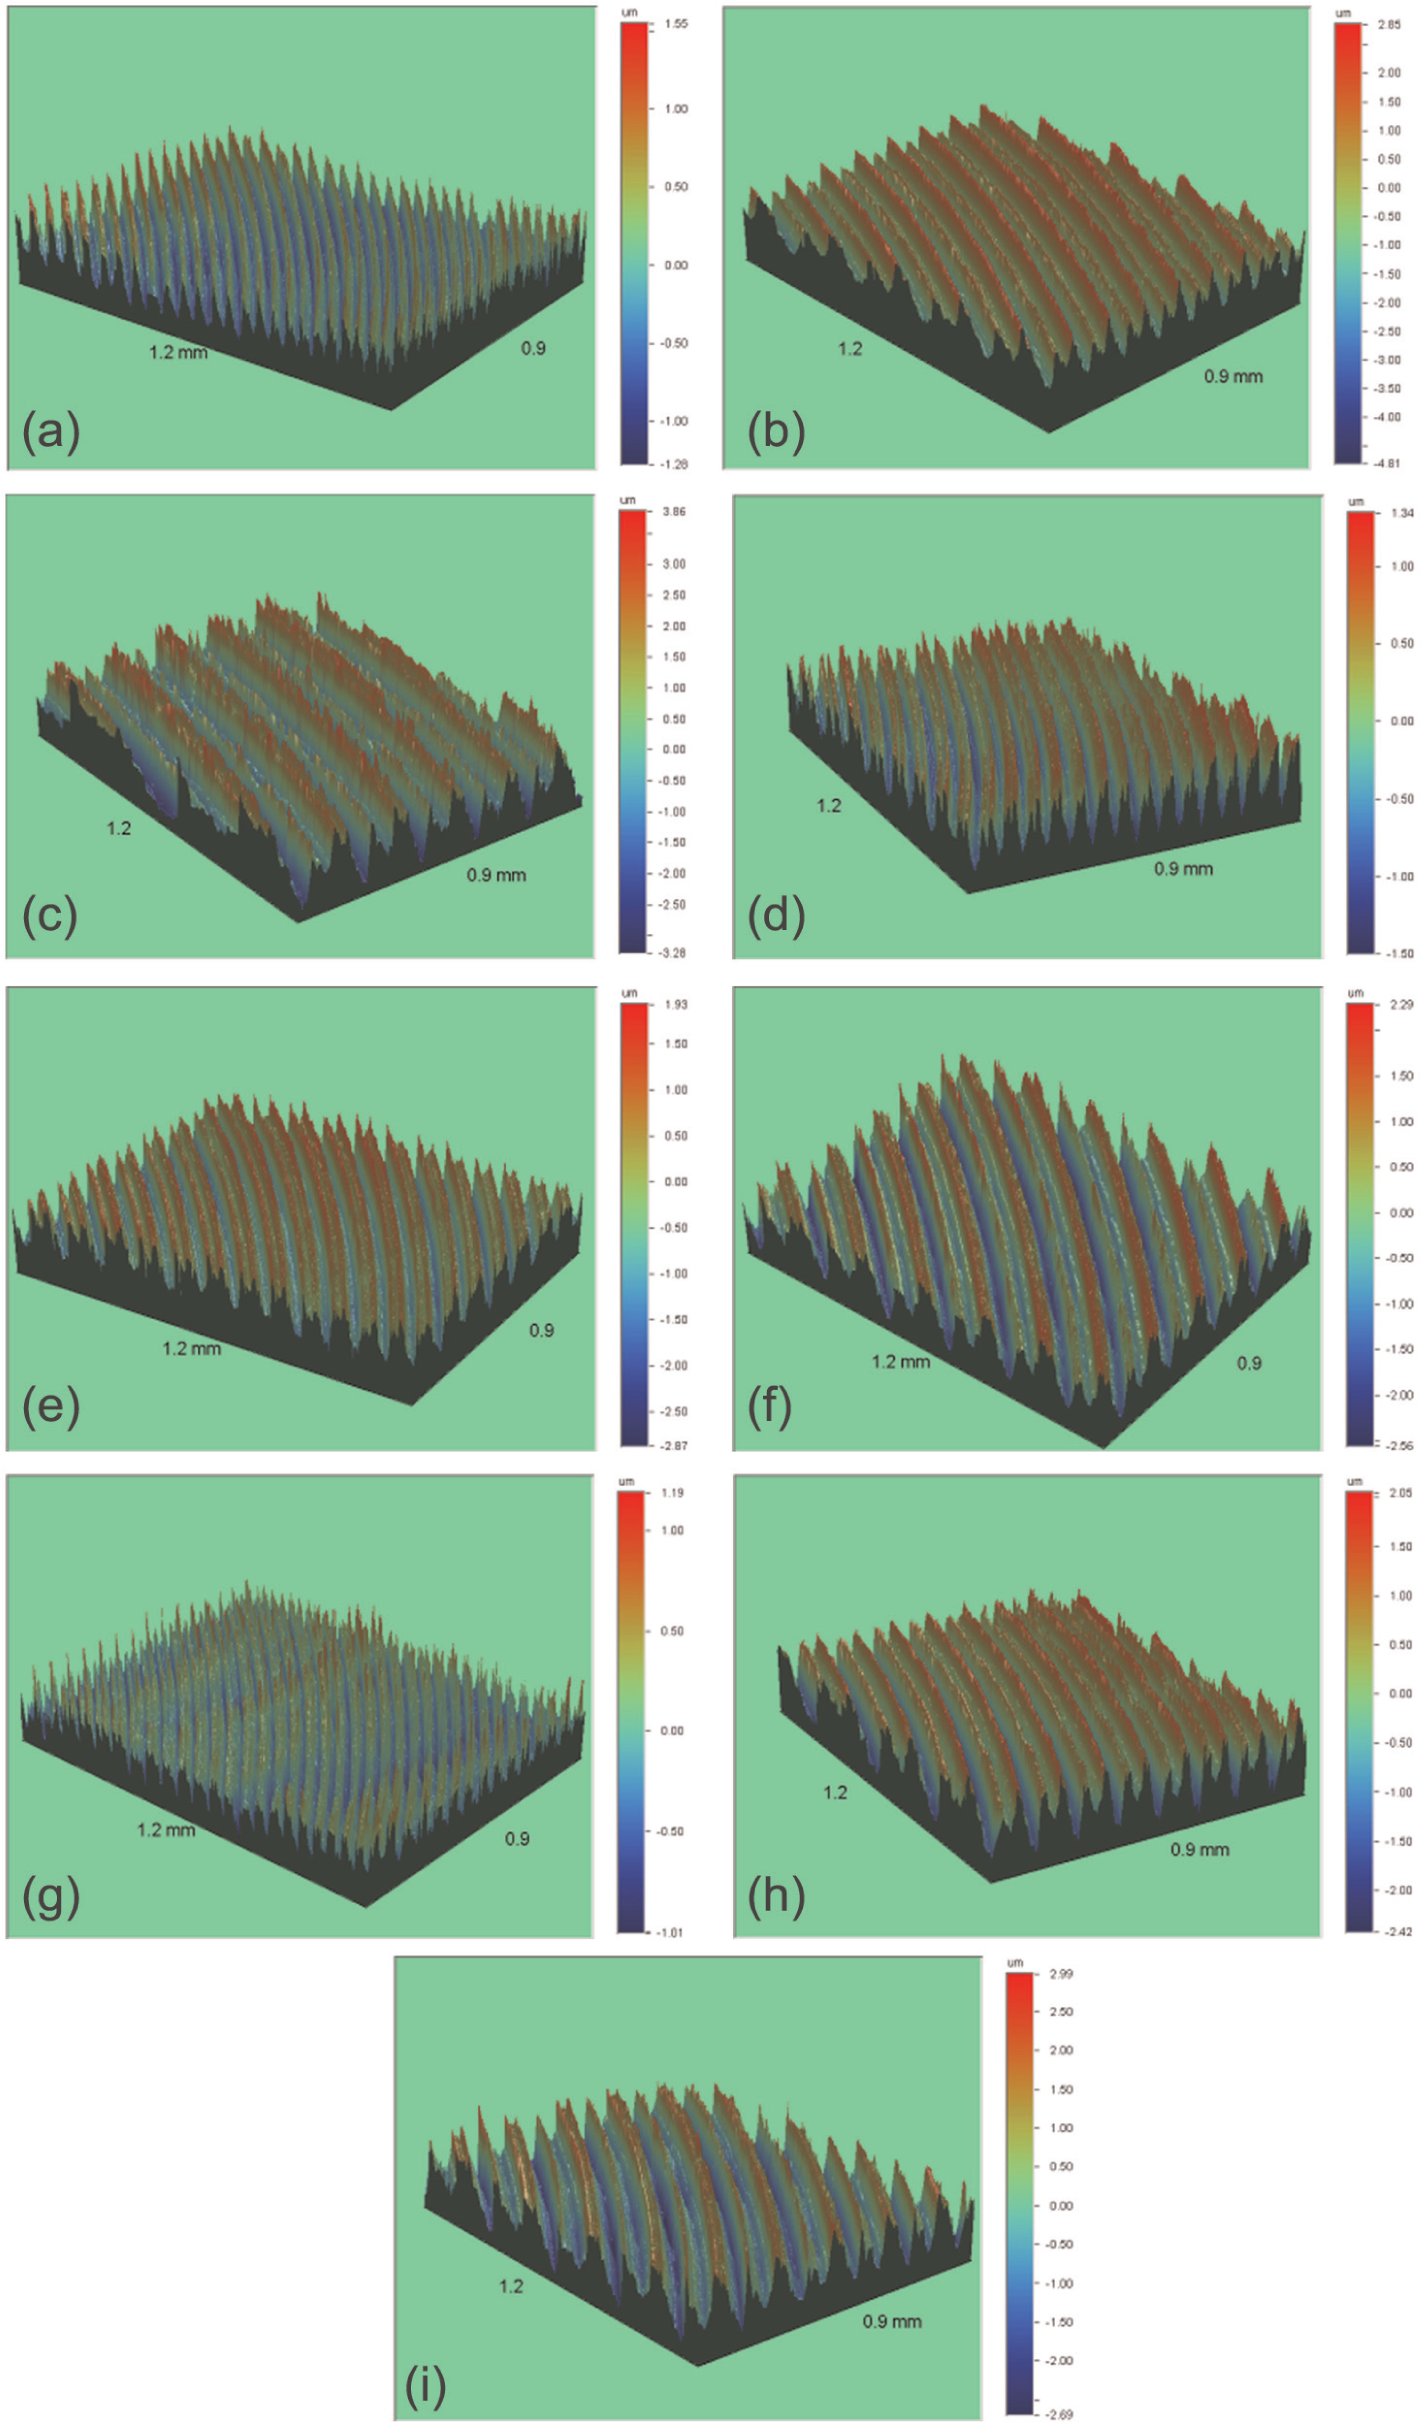
Measured 3D topographies in different milling parameters: (a) specimen 1, Ra 0.384 µm; (b) specimen 2, Ra 0. 724 µm; (c) specimen 3, Ra 1.067 µm; (d) specimen 4, Ra 0.425 µm; (e) specimen 5, Ra 0.569 µm; (f) specimen 6, Ra 0.762 µm; (g) specimen 7, Ra 0.258 µm; (h) specimen 8, Ra 0.685 µm; and (i) specimen 9, Ra 0.812 µm.
In Figure 7(a), (d), and (g), fz = 0.02 mm/z, and surface roughness is below Ra 0.5 µm. In Figure 7(b), (e), and (h), fz = 0.04 mm/z, and surface roughness is above Ra 0.5 µm. In Figure 7(c), (f), and (i), fz = 0.06 mm/z, and surface roughness is above Ra 0.7 µm. It can be seen that fz has greater effect on surface topography than vc in the range of selected process parameters.
Surface residual stress
Mathematical model for surface residual stress
Mathematical model of residual stress is built using multiple linear regression analysis based on the data in Table 3
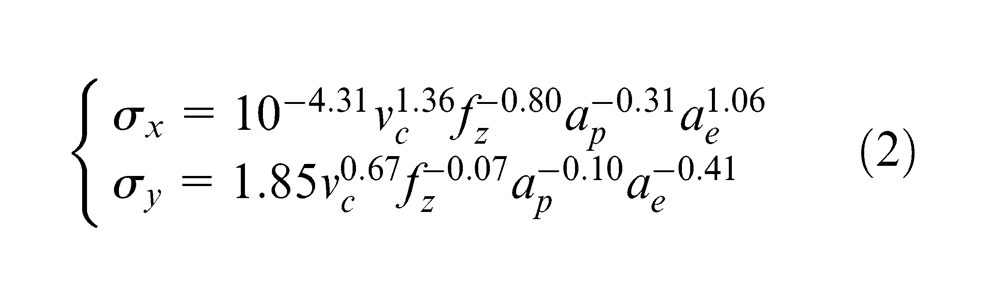
where σx means residual stress along feed direction and σy means the residual stress along the step-over direction. The average error and significance for the model of σx are 8.9% and 0.002, respectively, while the average error and significance for the model of σy are 4.8% and 0.035, respectively.
From formula (2), σx is most sensitive to vc, secondarily sensitive to ae and fz, and least sensitive to ap. The σx increases with the increase in vc and ae and decreases gradually with the increase in fz and ap. σy is most sensitive to vc, secondarily sensitive to ae and ap, and least sensitive to fz. σy increases with the increase in vc and decreases gradually with the increase in fz and ap.
Calculation of extremum difference
From Table 4, the ranges of σx for vc, fz, ap, and ae are 51, 59.667, 16.333, and 53.667 MPa, respectively. So, σx was most sensitive to fz, secondarily sensitive to ae and vc, and least sensitive to ap. The ranges of σy for vc, fz, ap, and ae are 35, 14.333, 6.666, and 32.333 MPa, respectively. So, σy is most sensitive to vc, secondarily sensitive to ae and fz, and least sensitive to ap, same as the result of the mathematical model (equation (2)).
Effects of milling parameters on residual stress
The effects of vc, fz, ap, and ae on surface residual stress are shown in Figure 8 obtained by extremum difference analysis. Compressive residual stresses are observed on all machined surfaces. From Figure 8(a), as vc increases from 700 to 900 m/min, σx increases from −42 to −64 MPa, and σy increases from −105 to −121 MPa. When vc increases from 900 to 1100 m/min, σx increases from −69 to −94 MPa, and σy increases from −121 to −140 MPa. From Figure 8(b), as fz increases from 0.02 to 0.04 mm/z, σx decreases from −99 to −68 MPa, and σy increases from −123 to −129 MPa. When fz increases from 0.04 to 0.06 mm/z, σx decreases from −68 to −39 MPa, and σy decreases from −129 to −115 MPa. From Figure 8(c), as ap increases from 0.3 to 0.5 mm, σx decreases from −78 to −62 MPa, and σy is −124 MPa. When ap increases from 0.5 to 0.7 mm, σx increases from −62 to −66 MPa, and σy decreases from −124 to −118 MPa. From Figure 8(d), as ae increases from 4 to 6 mm, σx increases from −41 to −70 MPa, and σy decreases from −138 to −123 MPa; as ap increases from 6 to 8 mm, σx increases from −70 to −95 MPa, and σy decreases from −113 to −106 MPa.
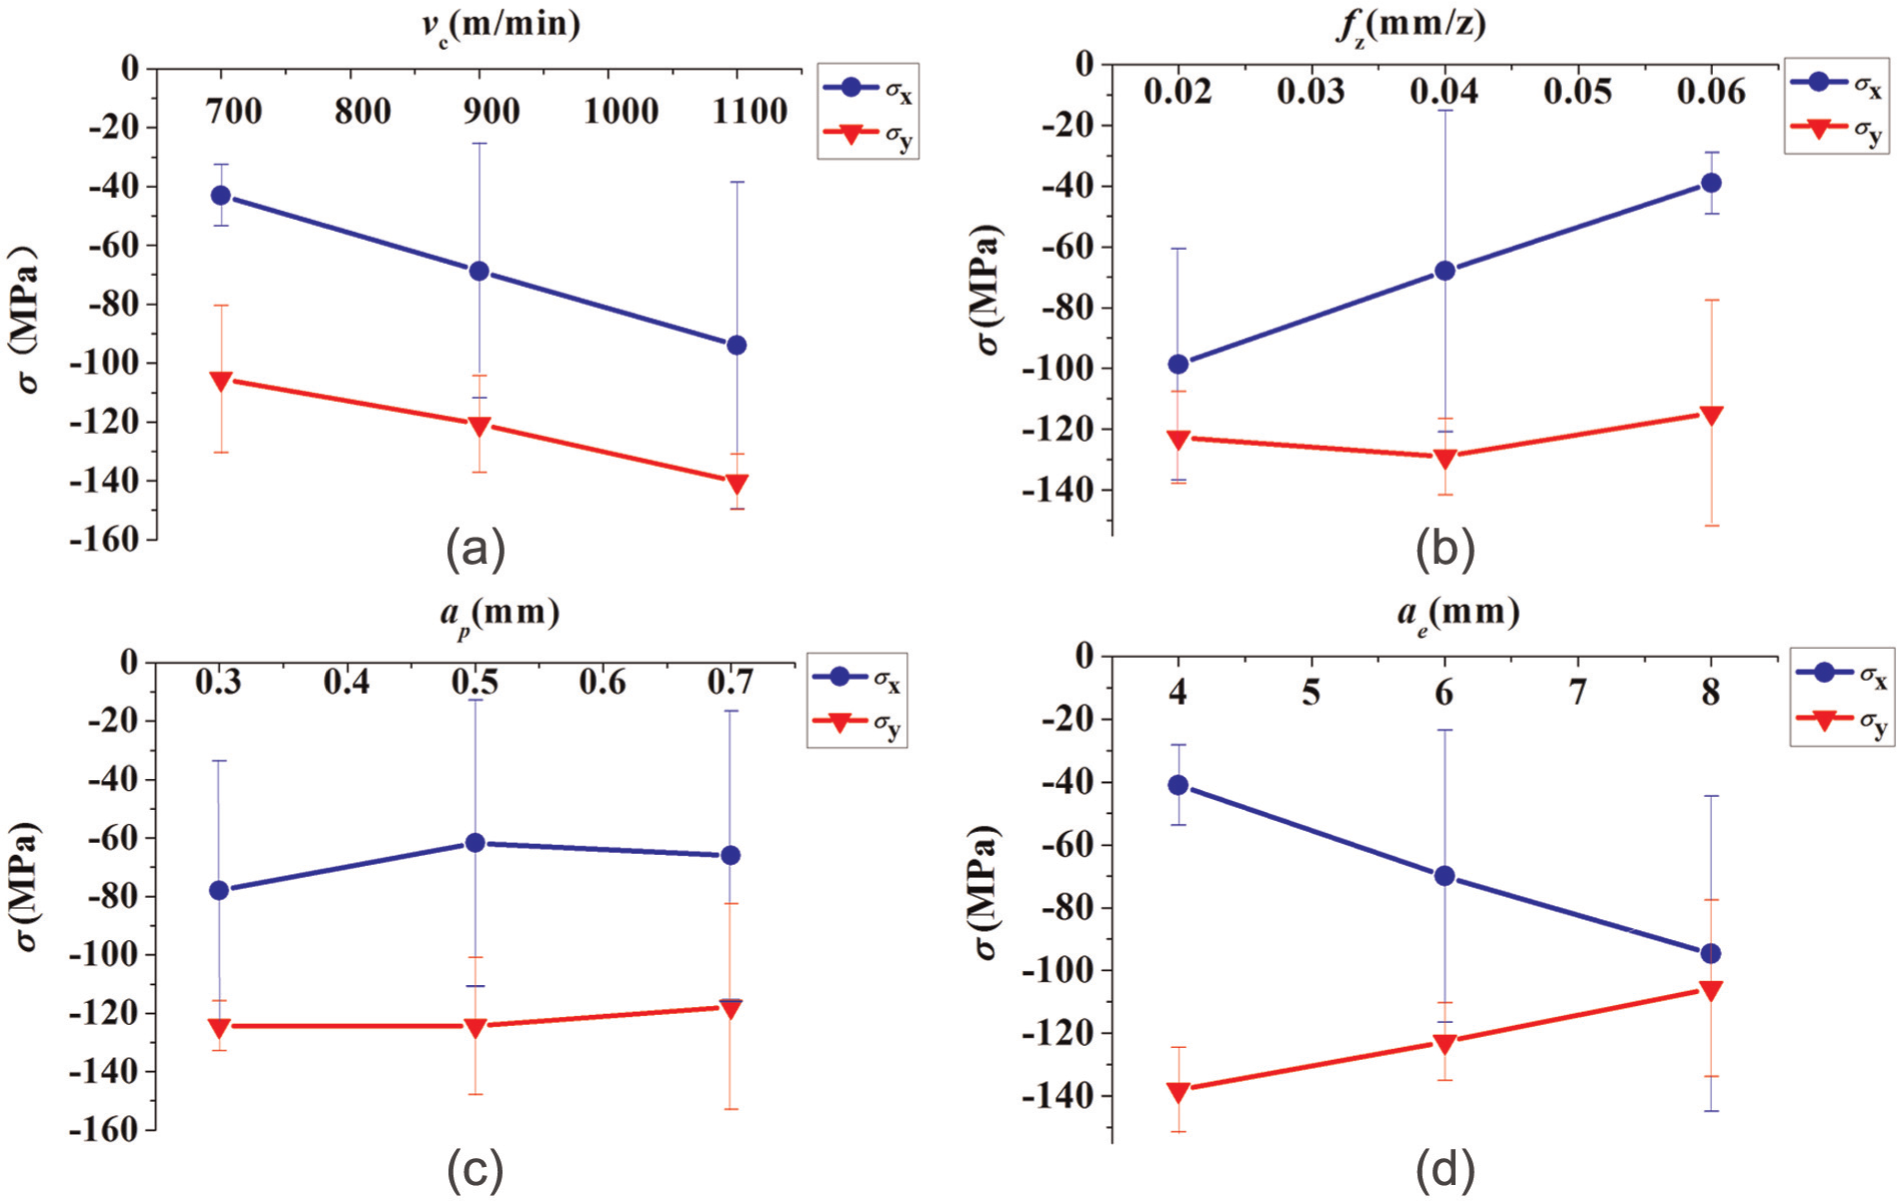
Effects of milling parameters on surface residual stress: (a) effect of vc on residual stress, (b) effect of fz on residual stress, (c) effect of ap on residual stress, and (d) effect of ae on residual stress.
Interaction effects of milling parameters on surface residual stress
The interaction effect of milling parameters on surface residual stress should also be considered for selecting milling parameters. The effect of ae and vc interaction on residual stress is shown in Figure 9.
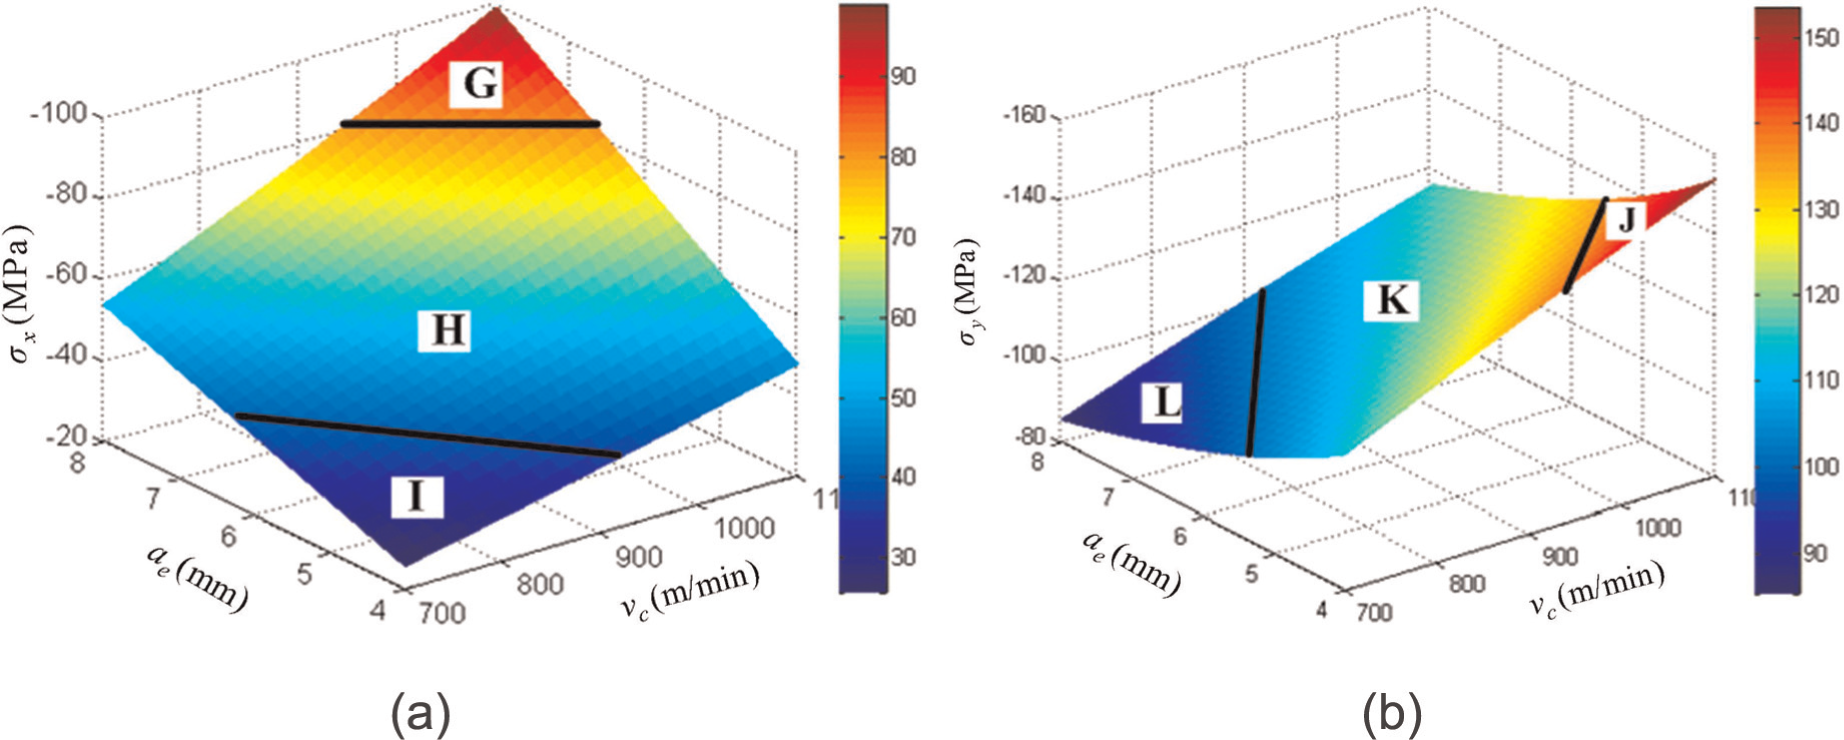
(a) Interaction effect of vc and ae on σx and (b) interaction effect of vc and ae on σy.
Figure 9(a) shows that the higher σx appears in region G: high vc and high ae, and σx is higher than −80 MPa. The lower σx appears in region H: low vc and low ae, and σx is less than −40 MPa. σx in region I ranges from −40 to −80 MPa.
Figure 9(b) shows that the higher σy appears in region J: high vc and low ae, and σy is about −140 MPa. The lower σy appears in region K: low vc and high ae, and σy is about −100 MPa. The σy in region L ranges from −100 to −140 MPa.
Surface micro-hardness
Mathematical model for surface micro-hardness
Mathematical model of micro-hardness is built using multiple linear regression analysis based on the data in Table 3
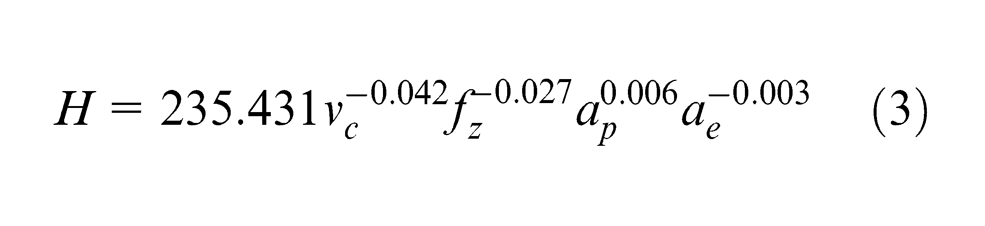
The average error and significance of the model are 0.8% and 0.254, respectively. From formula (3), surface micro-hardness is most sensitive to vc, secondarily sensitive to fz and ap, and least sensitive to ae. Surface micro-hardness increases with the increase in ap and decreases gradually with the increase in vc, fz, and ae.
Calculation of extremum difference
From Table 4, the ranges of micro-hardness for vc, fz, ap, and ae are 5.210, 6.017, 1.280, and 0.714 HV0.025, respectively. So, micro-hardness is most sensitive to fz, secondarily sensitive to vc and ap, and least sensitive to ae, same as the result of the mathematical model (equation (3)).
Effects of milling parameters on micro-hardness
In Table 3, micro-hardness has a small variation range of 185.20–197.14 HV0.025. The effects of milling parameters on micro-hardness are investigated using extremum difference analysis, as shown in Figure 10. Milling parameters have little impact on micro-hardness in high-speed milling of aluminum alloy 7055. So, the interaction effects of milling parameters on micro-hardness were no further studied.
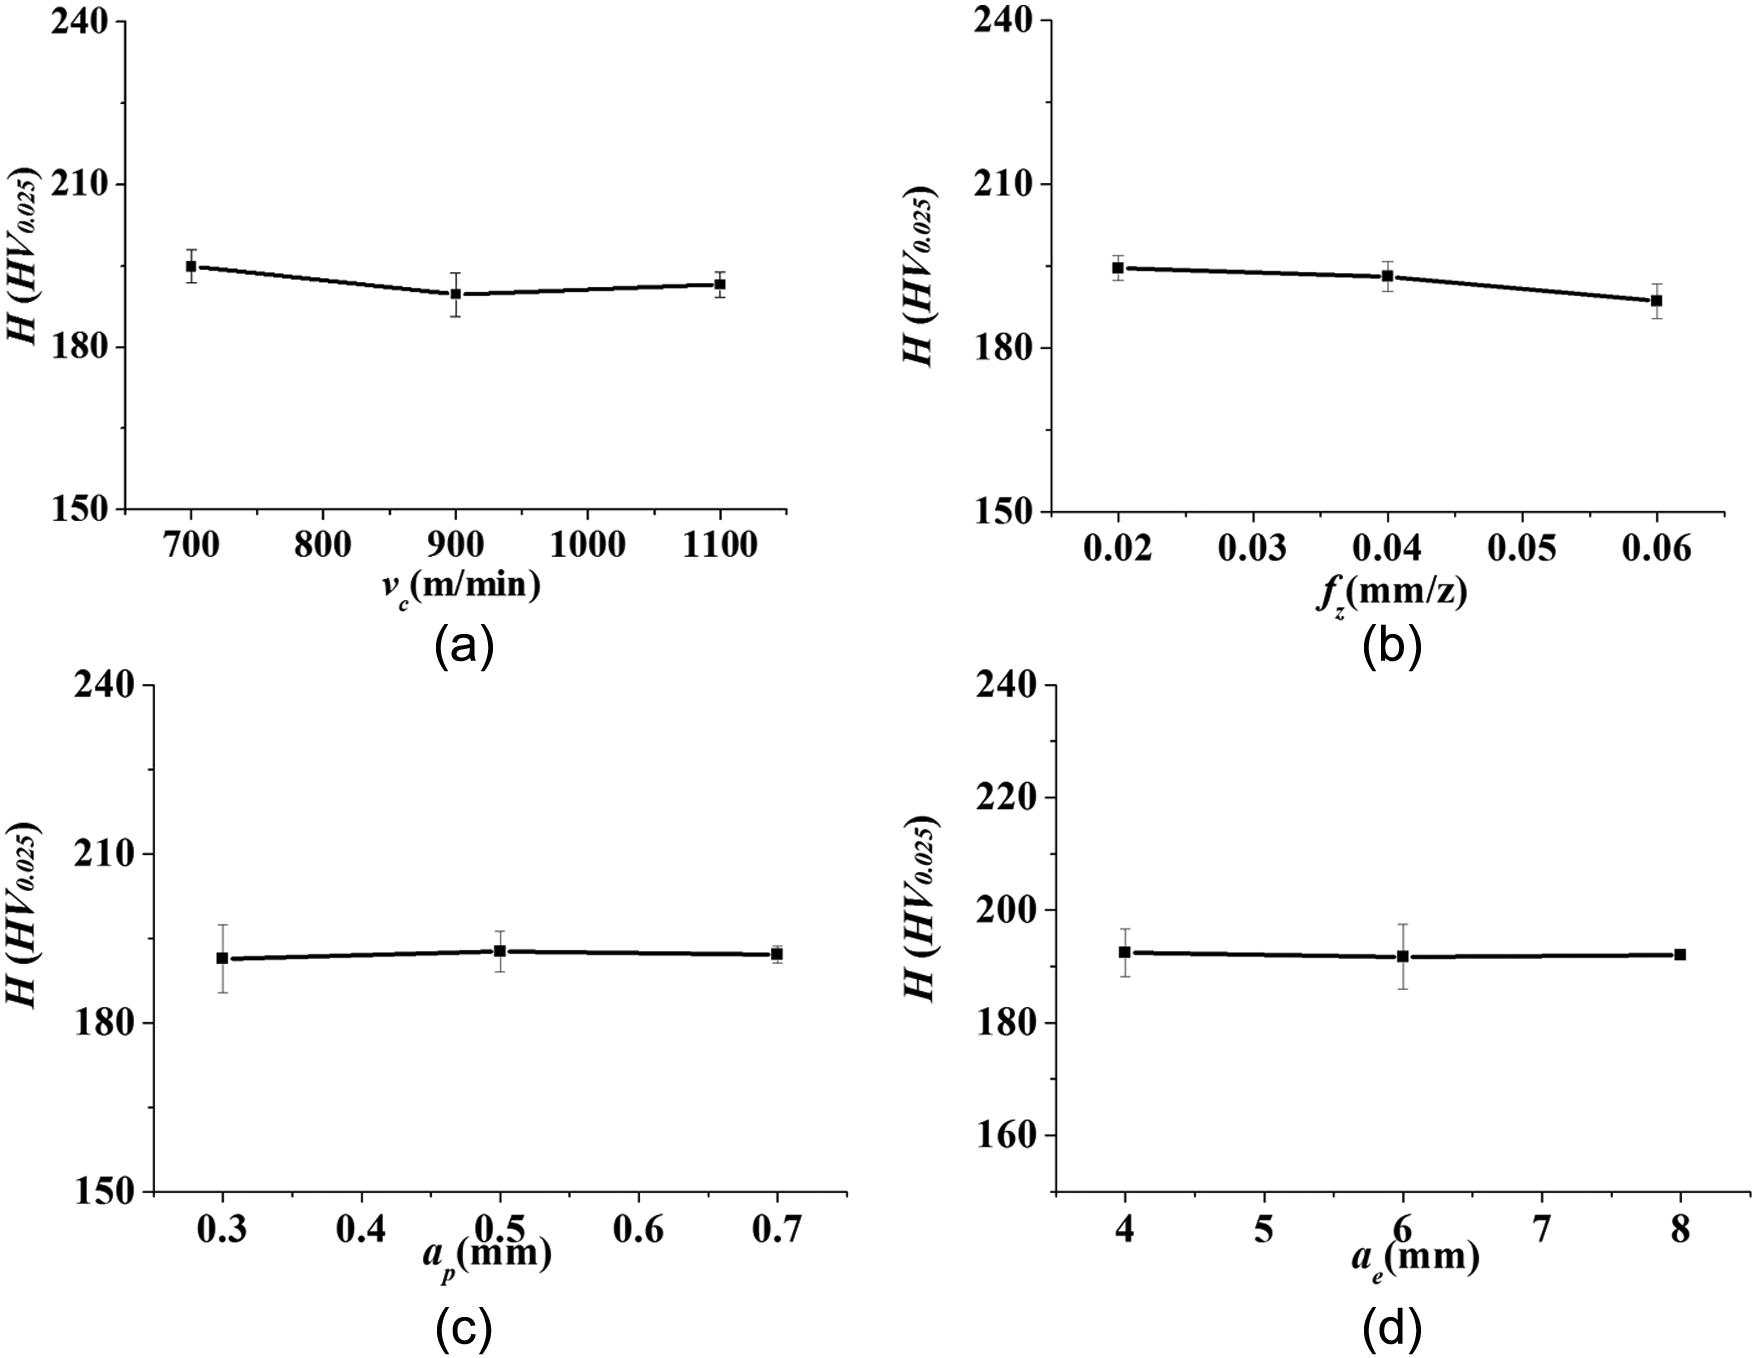
Effects of milling parameters on surface micro-hardness: (a) effect of vc on H, (b) effect of fz on H, (c) effect of ap on H, and (d) effect of ae on H.
According to the above analysis, good surface integrity can be obtained with vc = 1100 m/min, fz = 0.02 mm/z, ap = 0.7 mm, and ae = 6 mm in milling of 7055 alloy, while
Metamorphic layer analysis
Measurement and simulation for milling force and temperature in milling of 7055
Acquisition of force and temperature in high-speed machining is still a difficult problem. Milling speed in the study is about 1000 m/min. Response frequency for acquisition system of force and temperature cannot meet the requirement. Milling experiments and simulation of 7055 alloy in low-speed milling were carried out.
Measurement for milling force and temperature
Yao et al. 26 measured the milling temperature using a semi-artificial thermocouple composed by TB6 and constantan and reported the effect of thermal–mechanical coupling on residual stress in milling of TB6. A semi-artificial thermocouple composed by 7055 alloy and constantan (Φ 0.3 mm) was used to measure milling temperature in this article. The fabricating procedure of a 7055-constantan thermocouple, as shown in Figure 11(a), can be briefly described as follows: machine two pieces of 7055 specimen, carve a groove with both the width and depth close to 0.3 mm (the diameter of constantan wire) on one surface of one specimen, squeeze the constantan wire with insulation paint layer about 0.01 mm into the groove, coat a layer of glue on one surface for another specimen, bind two specimens together to make the constantan wire be clamped by two workpieces, stay this sample being clamped by vise moderately for 8–12 h in room temperature, get off the sample from vise, and check the insulativity of constantan wire and un-carved 7055 workpiece. This 7055-constantan thermocouple is fixed on a CNC machine worktable with vise to measure the cutting temperature.
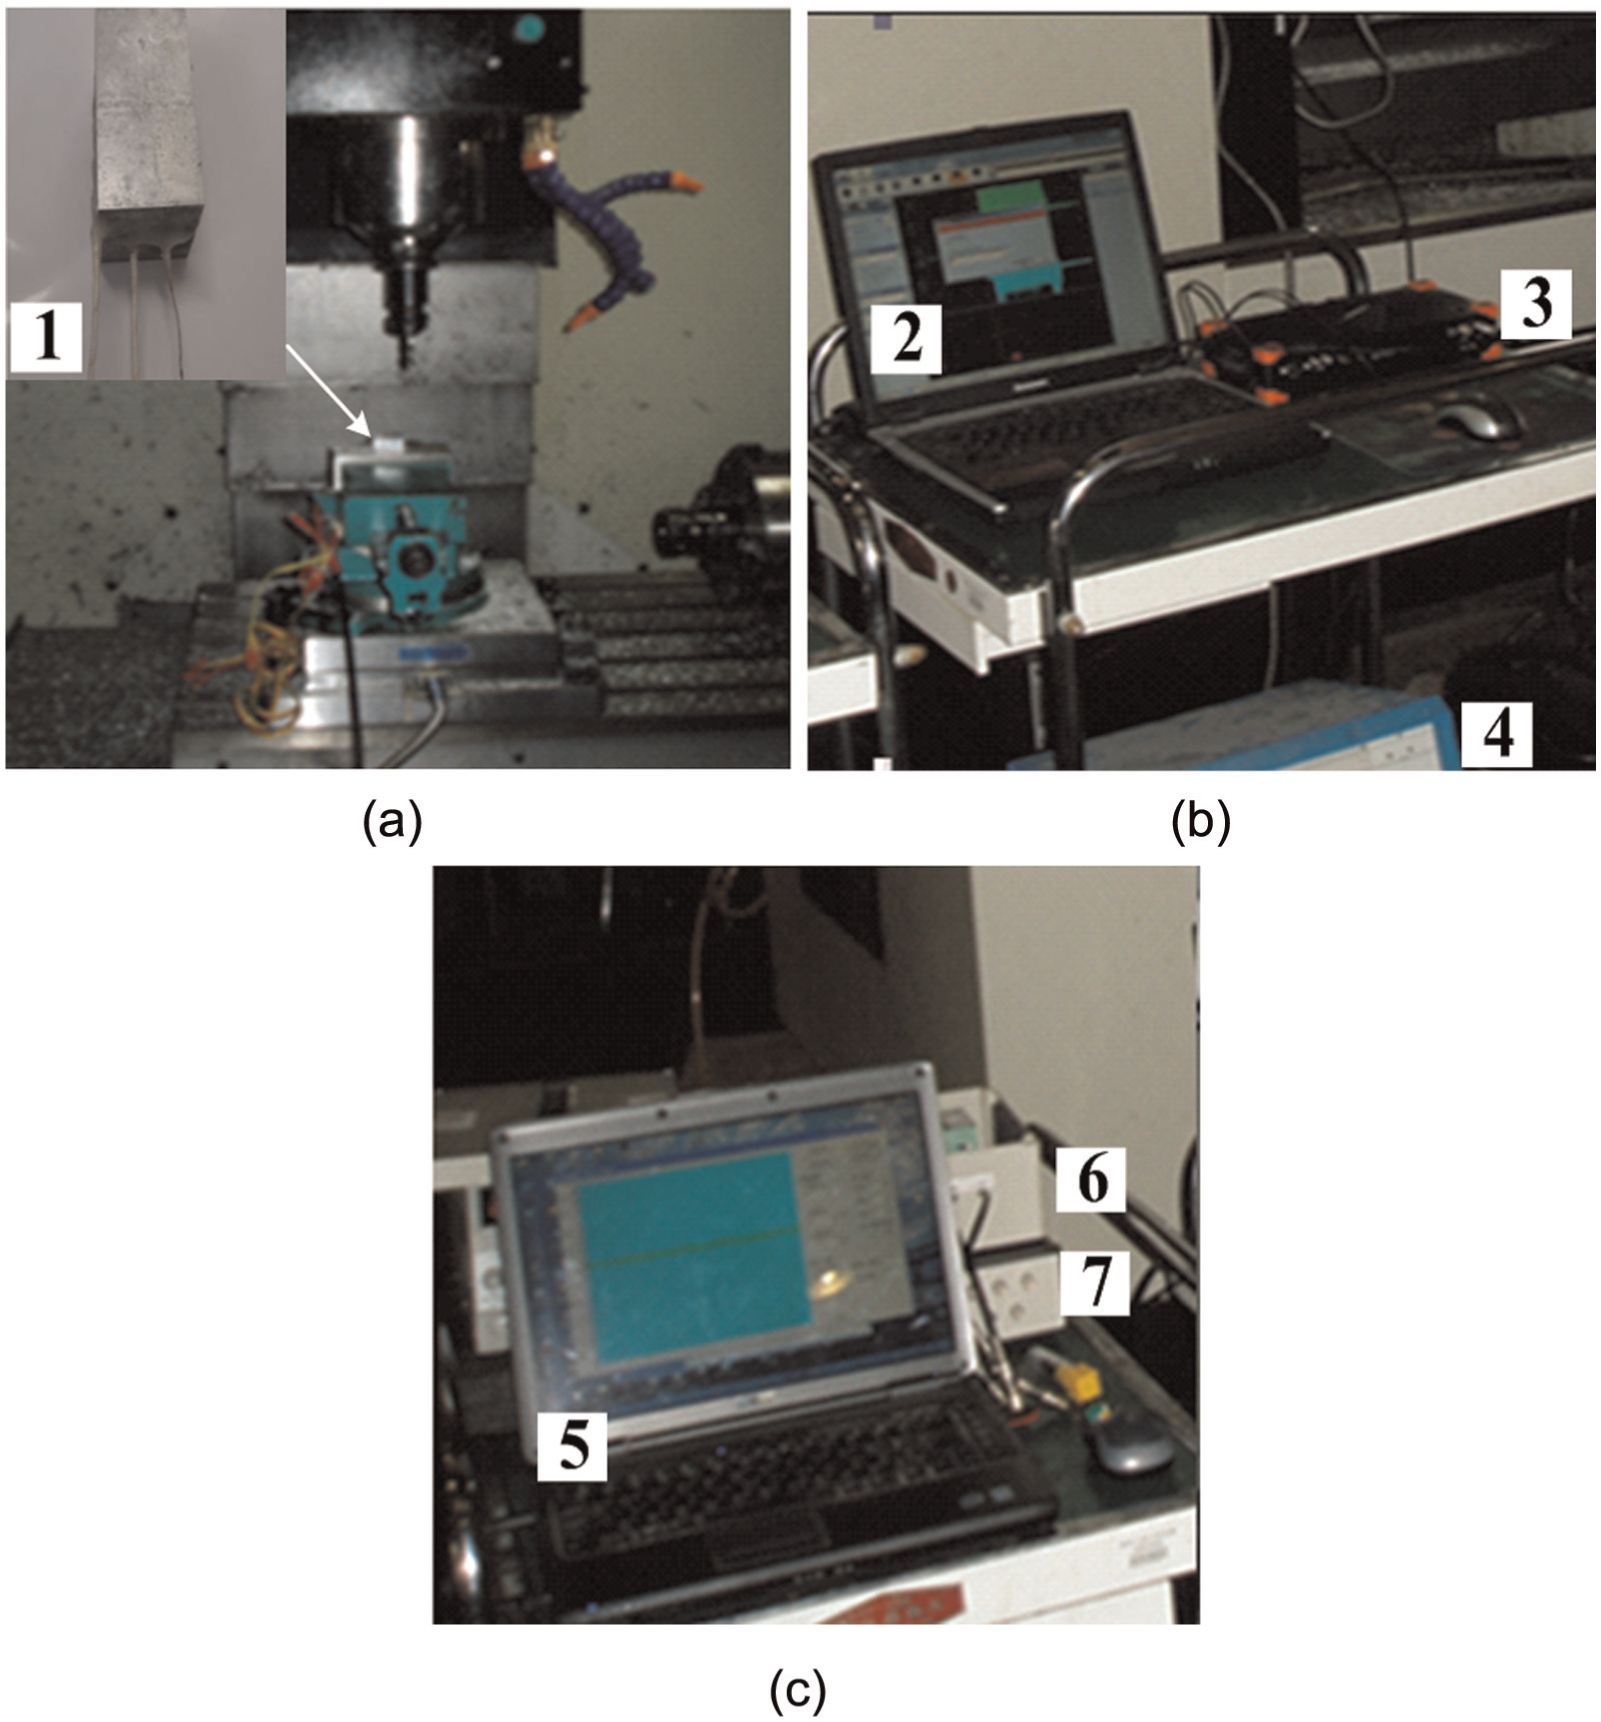
Measurement of milling force and temperature: (a) machining process, (b) measurement for milling force, and (c) measurement for temperature.
The cutting experiments were carried out in YHVT850Z. The cutting tool is a three-flute uncoated cemented carbide end mill. Rake angle, relief angle, helix angle, and diameter of this tool are 14°, 10°, 40°, and 12 mm, respectively. Milling parameters are given in Table 4. The measurement of milling force and temperature is shown in Figure 11.
The measurement system of cutting force consists of a Kistler 9255 B dynamic piezoelectric dynamometer, a Kistler 5017 A charge amplifier, and a recorder. The mean force by averaging 20 peak values of continuous transient cutting force was used as the experiment result of cutting force. The signal obtained from the measurement system of milling force is shown in Figure 12. In Figure 12(a), Fx and Fy are 70 and 32 N, respectively, and
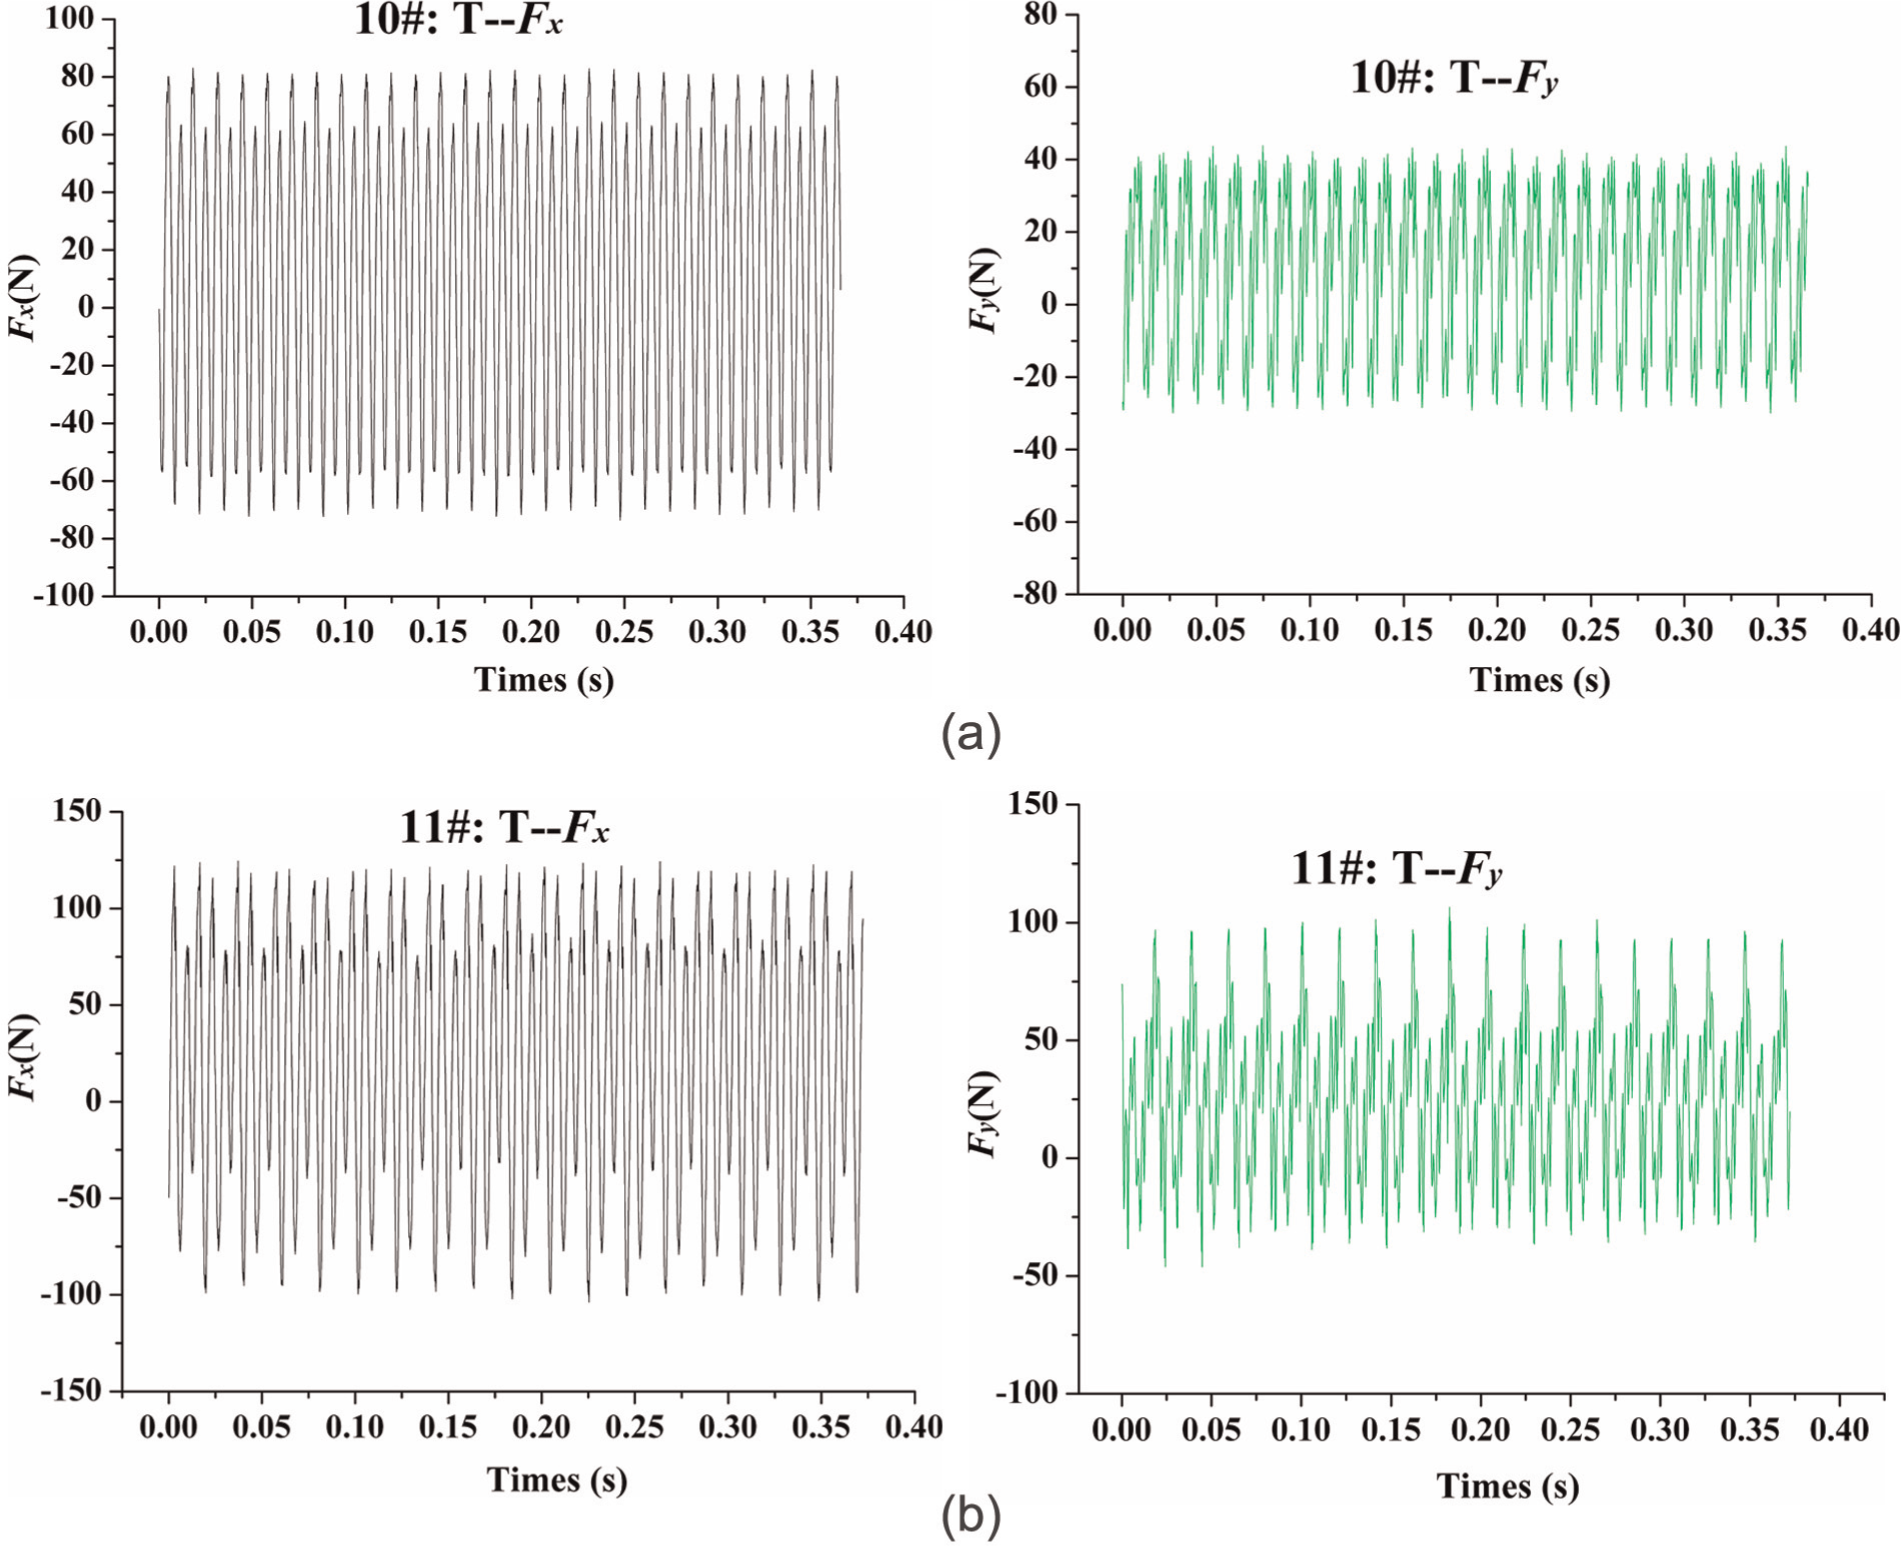
Signal obtained from measurement system of milling force: (a) vc = 170 m/min, fz = 0.02 mm/z, ap = 0.5 mm, and ae = 12 mm and (b) vc = 110 m/min, fz = 0.06 mm/z, ap = 0.5 mm, and ae = 12 mm.
Experiment and simulation results for milling force and temperature.
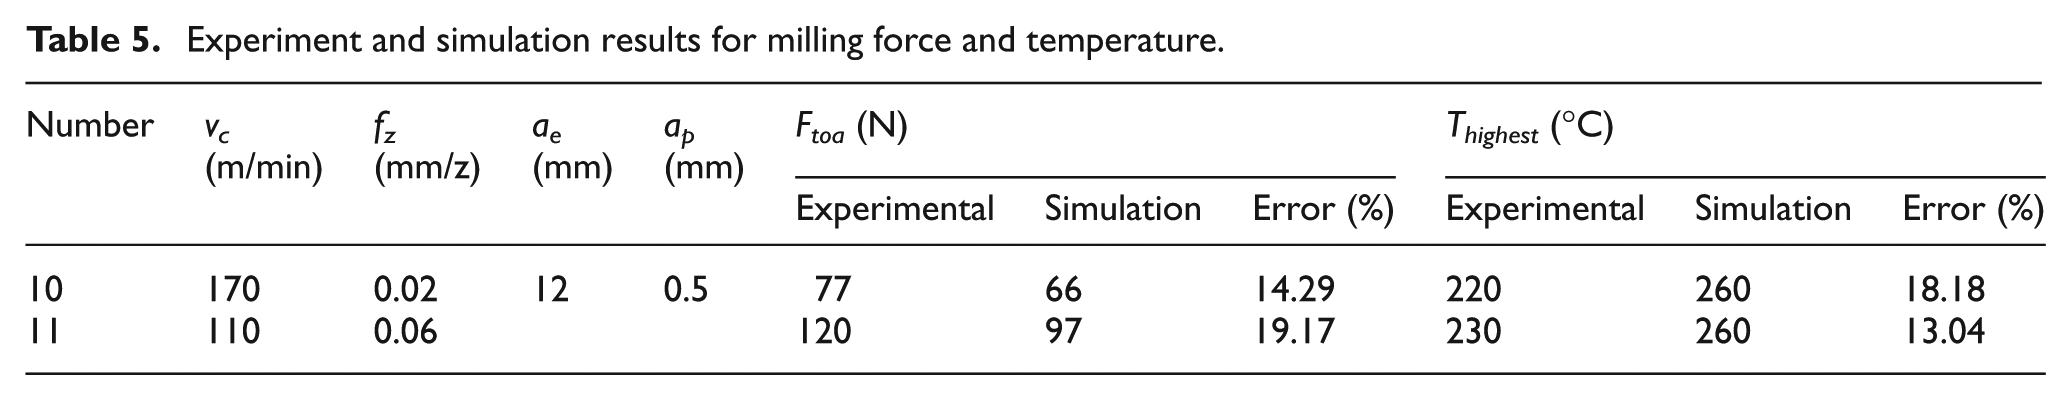
The measurement system of cutting temperature was constructed by a semi-artificial 7055-constantan thermocouple, an A11S11 signal disposal module, a UA305 high-speed USB data collector, and a computer. The signal obtained from the measurement system of milling temperature is shown in Figure 13. Collected milling temperatures are shown in Table 5.
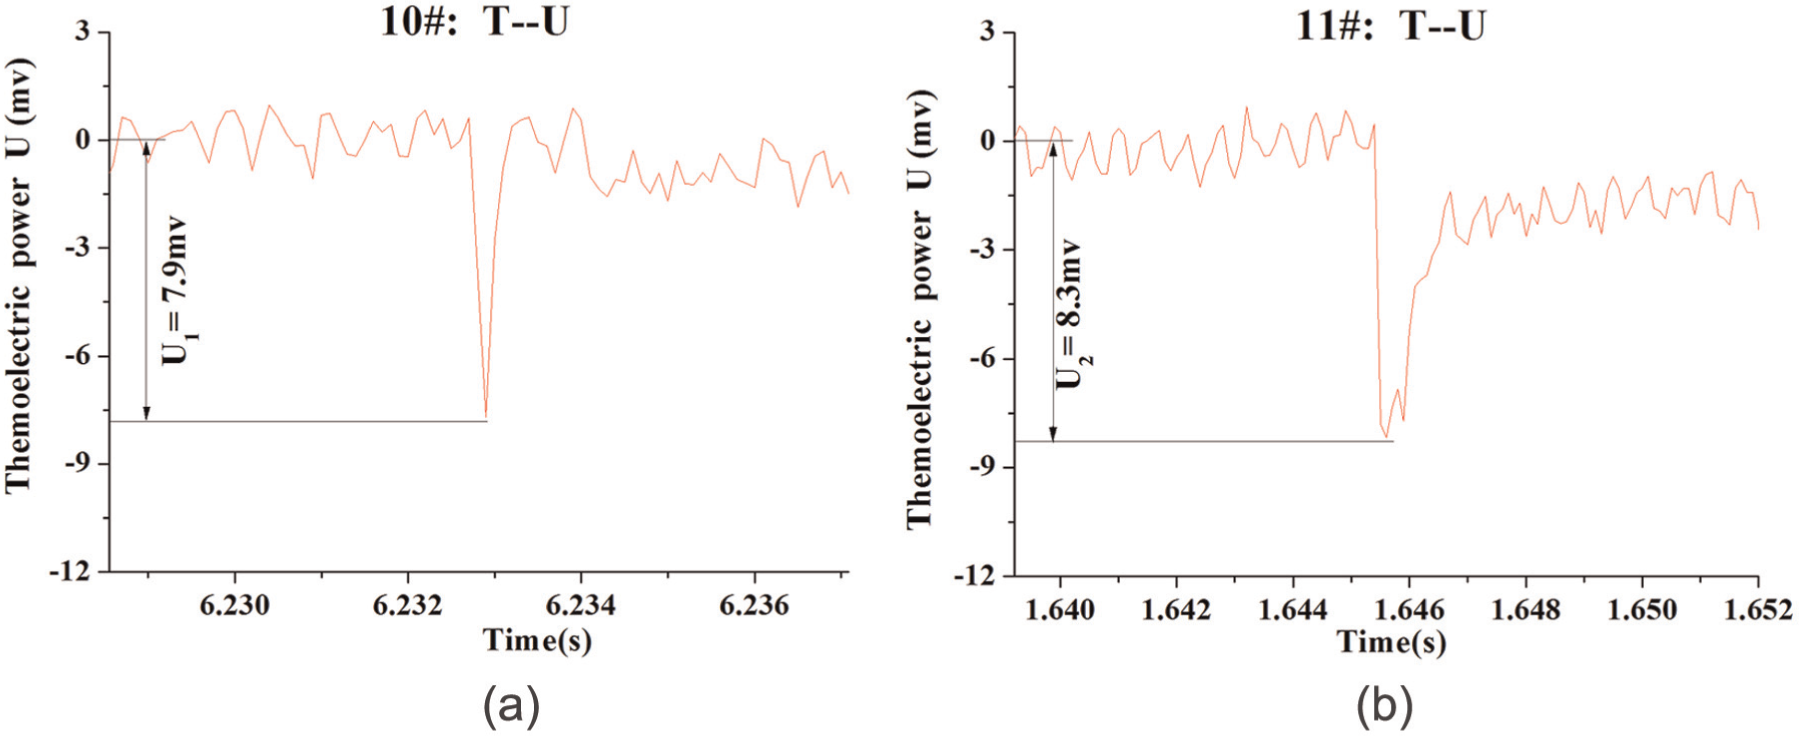
Signal obtained from measurement system of milling temperature: (a) vc = 170 m/min, fz = 0.02 mm/z, ap = 0.5 mm, and ae = 12 mm and (b) vc = 110 m/min, fz = 0.06 mm/z, ap = 0.5 mm, and ae = 12 mm.
Calibration curve between cutting temperatures and thermoelectric potentials of 7055-constantan thermocouple is shown in Figure 14 to predict cutting temperature by measuring thermoelectric potential.
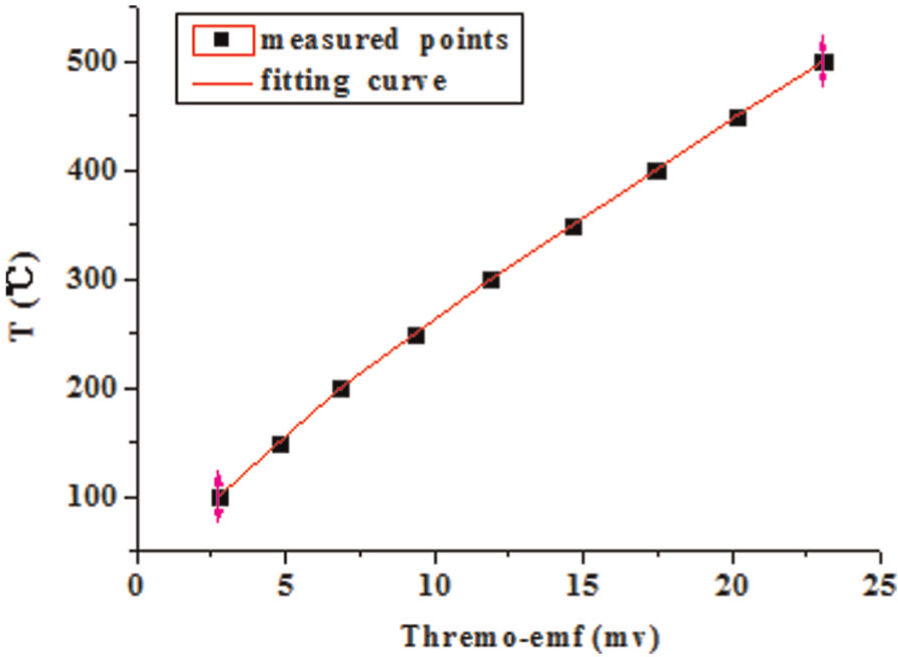
Calibration curve of 7055-constantan thermocouple.
Simulation for milling force and temperature
Third Wave Systems provides AdvantEdge FEM software for metal cutting simulation through a combination of finite element analyses and validated material modeling. Standard material database for AdvantEdge FEM includes 7055 alloy and was used to simulate milling force and temperature. Established temperature field simulation model is shown in Figure 15. Finite element model of two-dimensional milling is shown in Figure 16. Down-milling and no cutting fluid were used. Rake angle, relief angle, cutting edge radius, and diameter of the mill are 14°, 10°, 0.15 mm, and 24 mm, respectively. Initial temperature is 20 °C in milling processing.
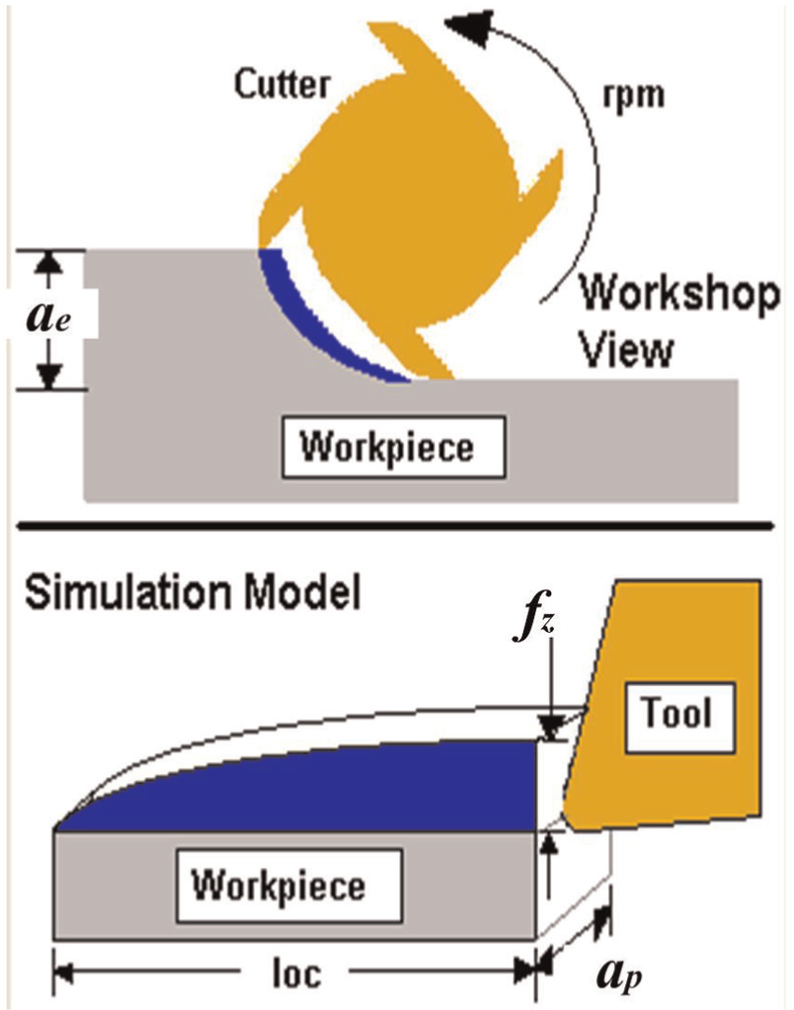
Simulation model.
Finite element model of two-dimensional milling.
The milling force and temperature field simulation in different milling parameters are shown in Figures 17 and 18. When vc = 170 m/min, fz = 0.02 mm/z, ae = 12 mm, and ap = 0.5 mm, the maximum cutting forces of Fx and Fy are 28 and 60 N, respectively, and
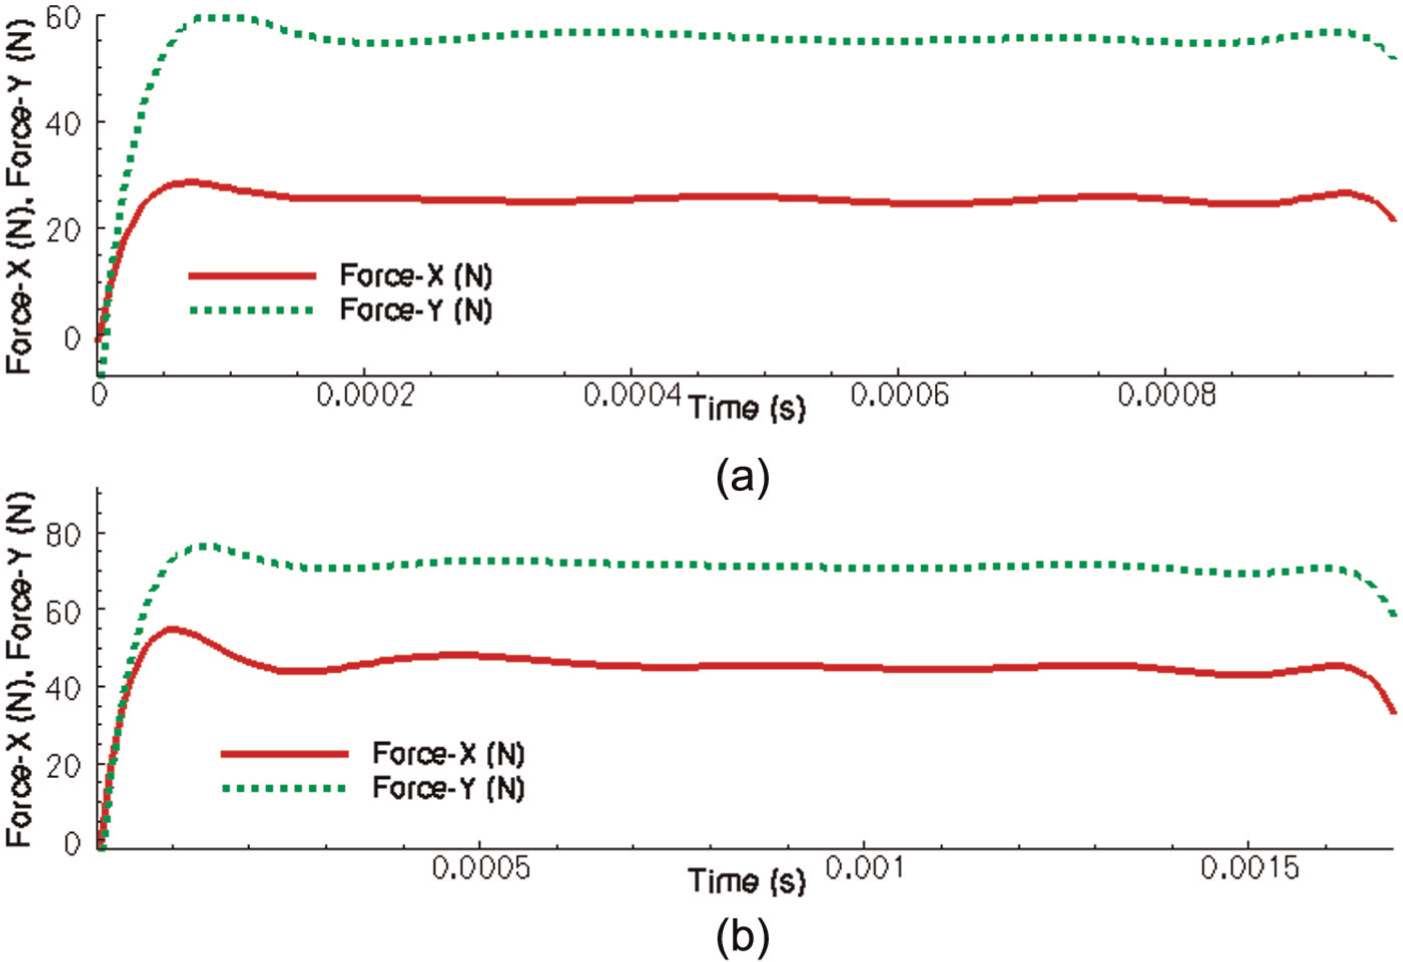
Milling force simulation in different milling parameters: (a) milling force simulation for specimen 10 and (b) milling force simulation for specimen 11.
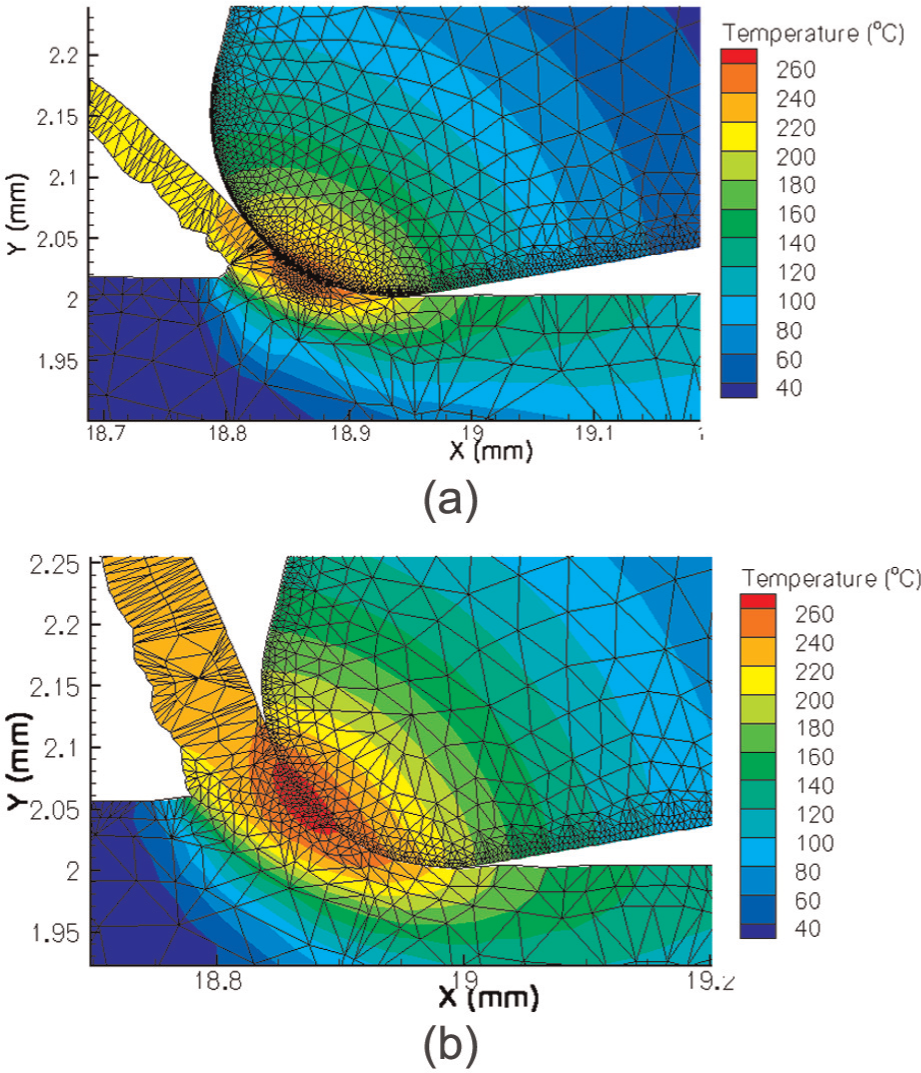
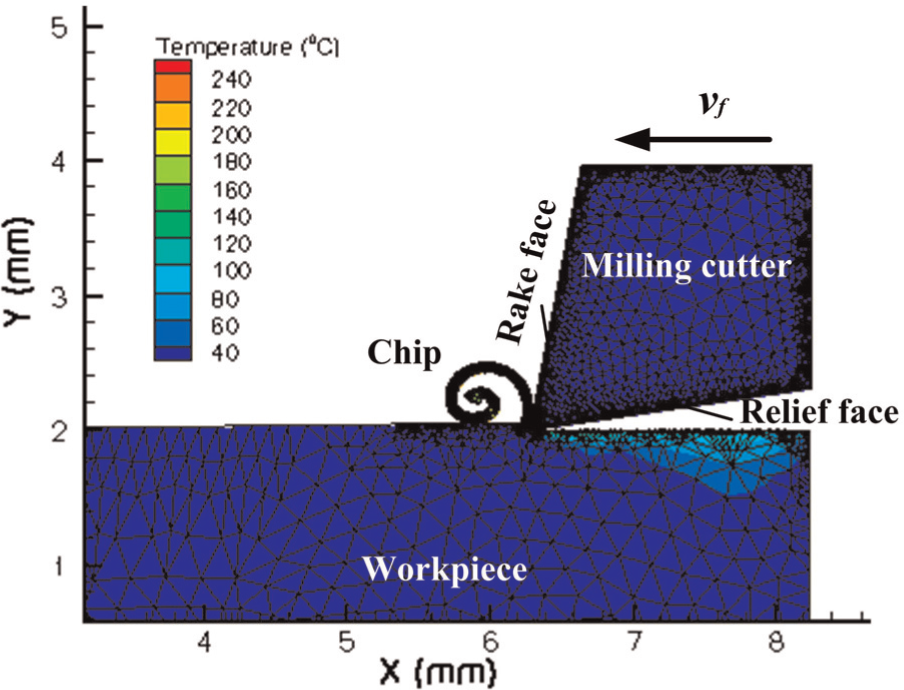
Milling temperature field simulation in different milling parameters: (a) milling temperature simulation for specimen 10 and (b) milling temperature simulation for specimen 11.
The Ftoa and Thighest on workpiece were extracted from the simulation results, as shown in Table 5. Experiment results for milling force and temperature are also shown in Table 5. As can be seen from the table, the error between experiment and simulation results is small. So, the simulation results are credible.
Simulation of milling force and temperature in high-speed milling of 7055
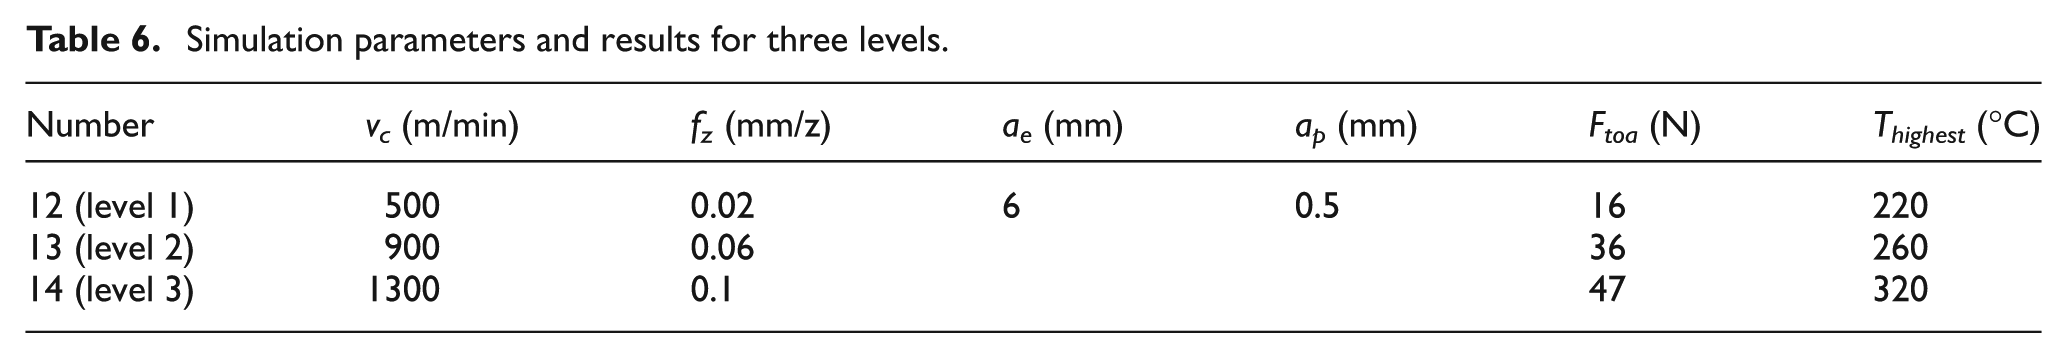
In order to obtain the effect of thermal–mechanical coupling effect on surface metamorphic layer, three levels of milling parameters shown in Table 6 are designed to conduct milling experiment for 7055. The specific processing parameters are shown in Table 6. Milling force and temperature fields in three levels were carried out by AdvantEdge FEM software and shown in Figures 19 and 20.
Simulation parameters and results for three levels.
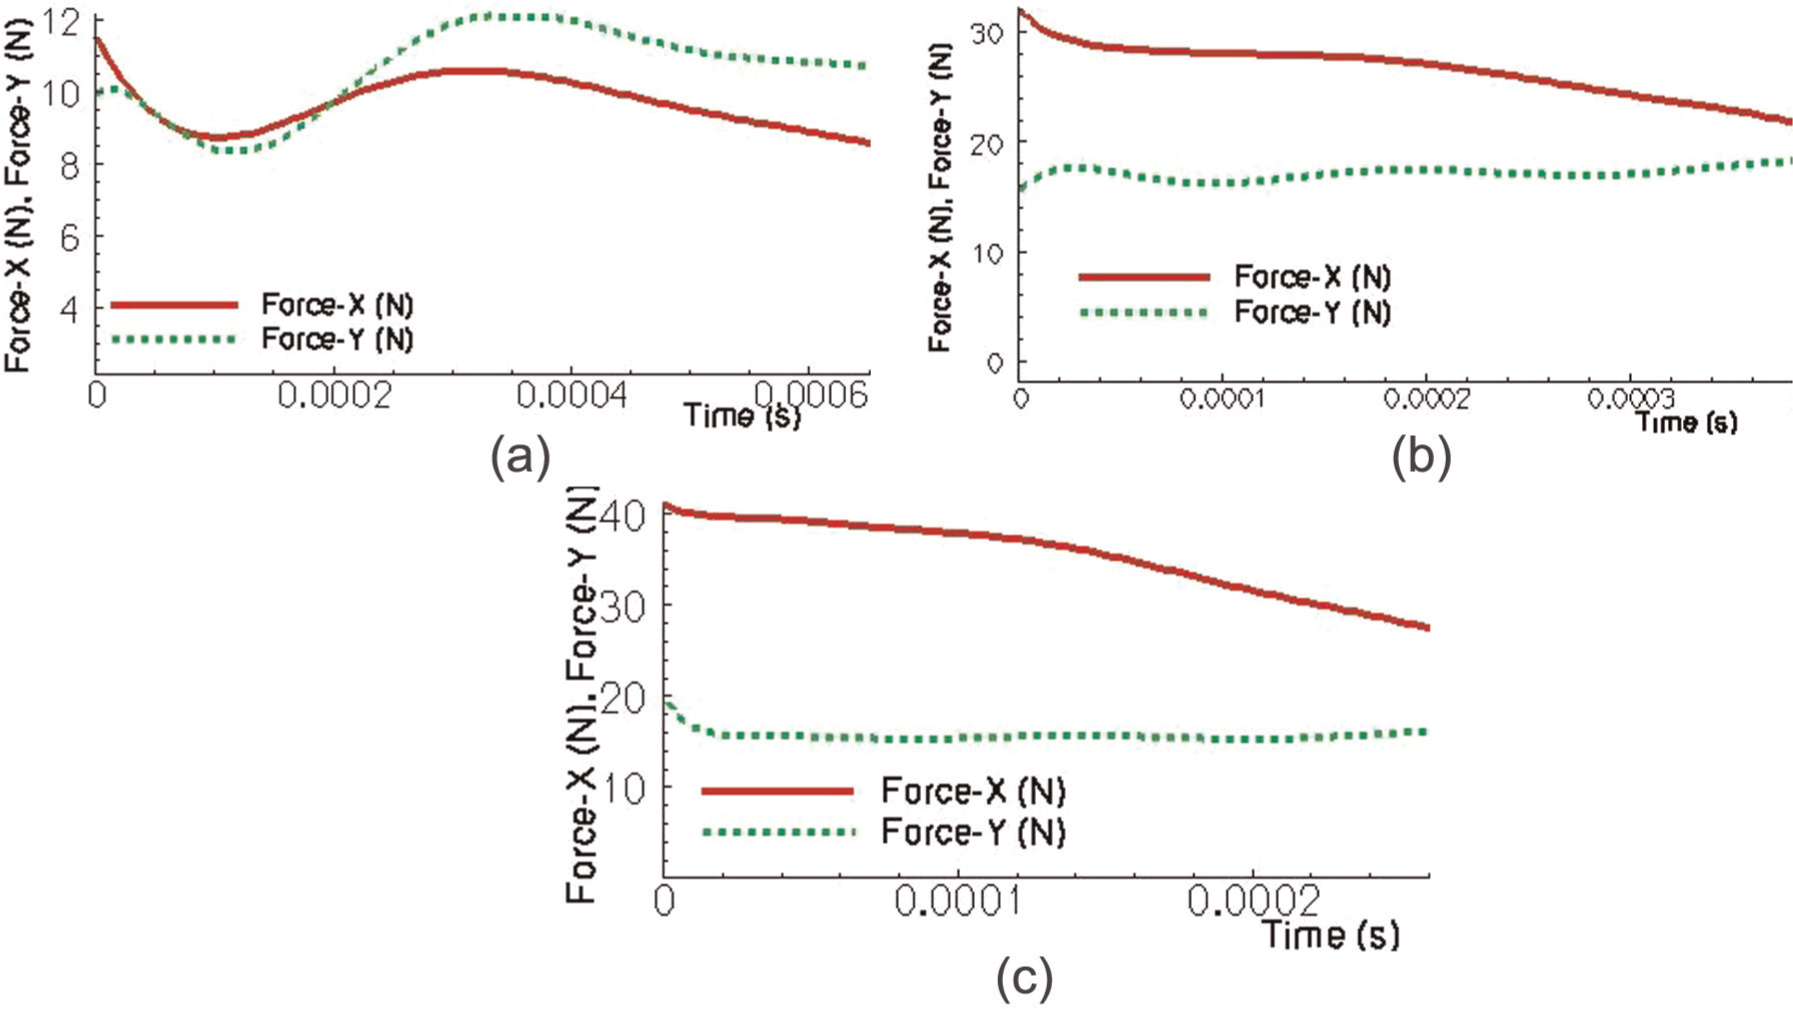
Milling force simulation for (a) specimen 12, (b) specimen 13, and (c) specimen 14.
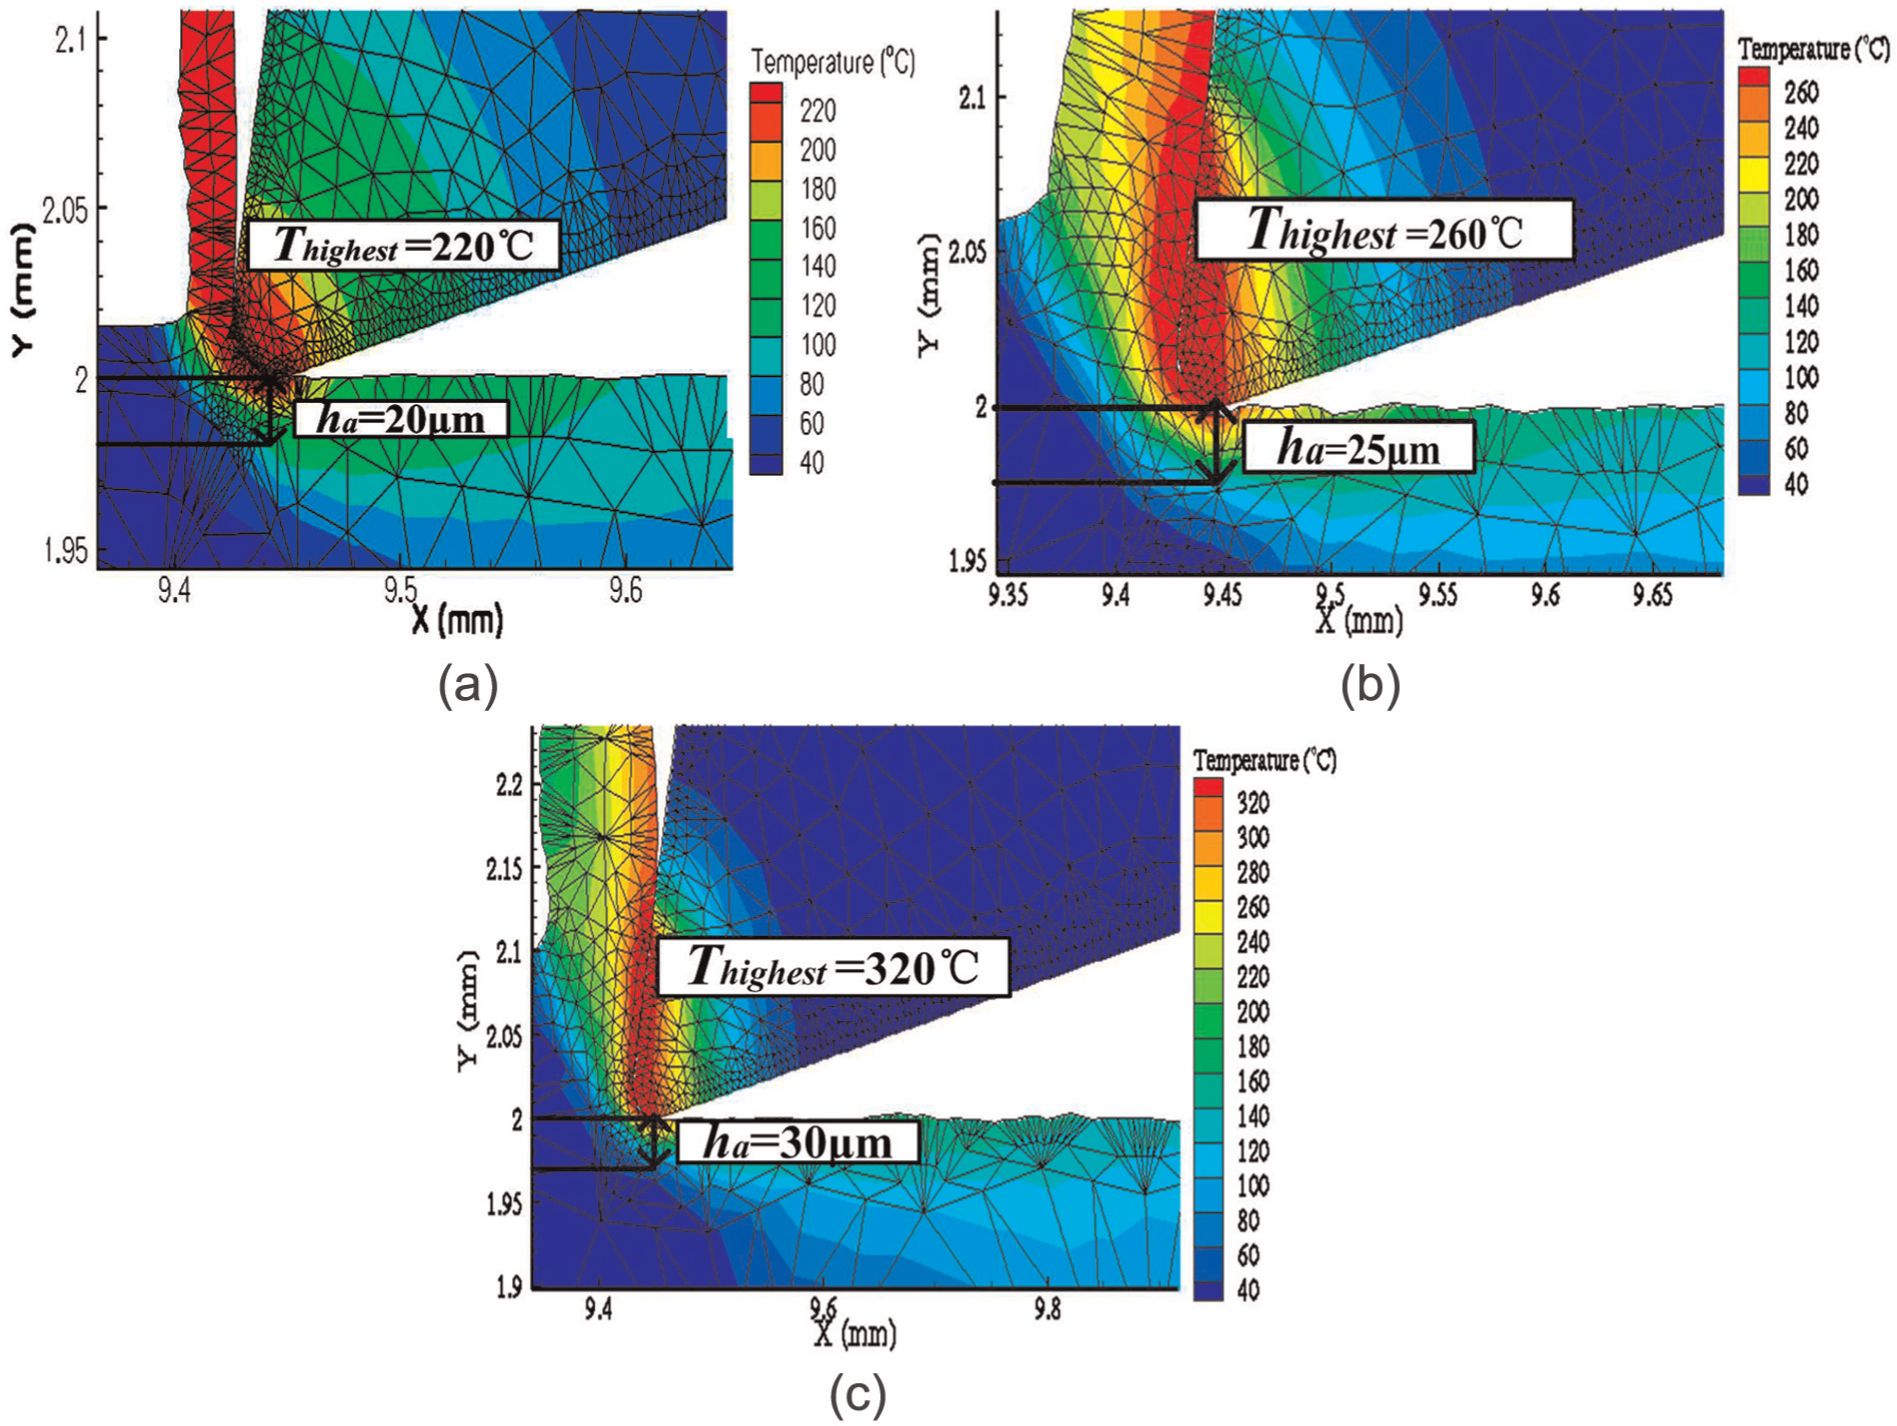
Milling temperature field simulation for (a) specimen 12, (b) specimen 13, and (c) specimen 14.
From Figures 19 and 20, for specimen 12, namely, level 1, the maximum cutting forces of Fx and Fy are 11.5 and 10.5 N, respectively, and
From levels 1 to 3, the region of temperature field for rake face became larger and larger. Temperature distributions for rake and relief faces for three levels are shown in Figure 21. The highest temperature and temperature distribution area of the tool all increase gradually with the increase in process strength. Among the three levels, the highest temperature occurs at a point along the rake face and close to the tool tip. This is because the chip flows along the rake face, and the cutting heat is concentrated in the contact area of tool rake face and chip. For specimens 12–14, distances between the highest temperature point and tool tip are 20, 50, and 50 µm, respectively.
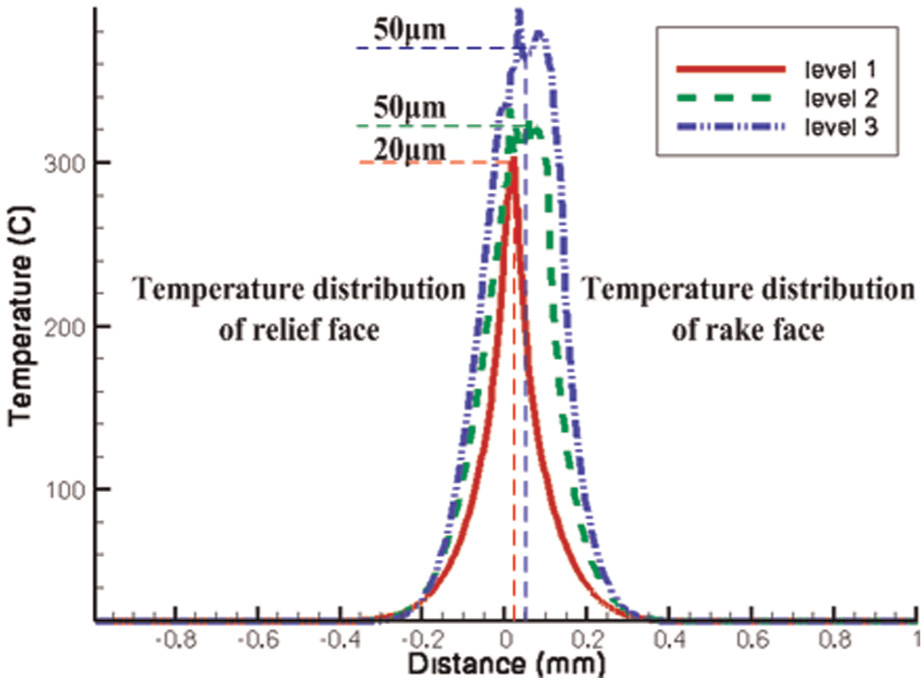
Temperature distribution of rake and relief faces for three levels.
Distribution of residual stress
Residual stress on subsurface for specimens 12–14 are all tested and shown in Figure 22. From it, all machined surfaces perform compressive residual stress, and residual stress tends to 0 gradually with the increase in h. Figure 22(a) shows that σx and σy on machined surface are −118 and −108 MPa, respectively, and the depth of compressive residual stress layer is about 35 µm; Figure 22(b) shows that σx and σy on machined surface are −59 and −87 MPa, respectively, and the depth of compressive residual stress layer is about 45 µm; Figure 22(c) shows that σx and σy on machined surface are −9 and −128 MPa, respectively, and the depth of compressive residual stress layer is about 45 µm.
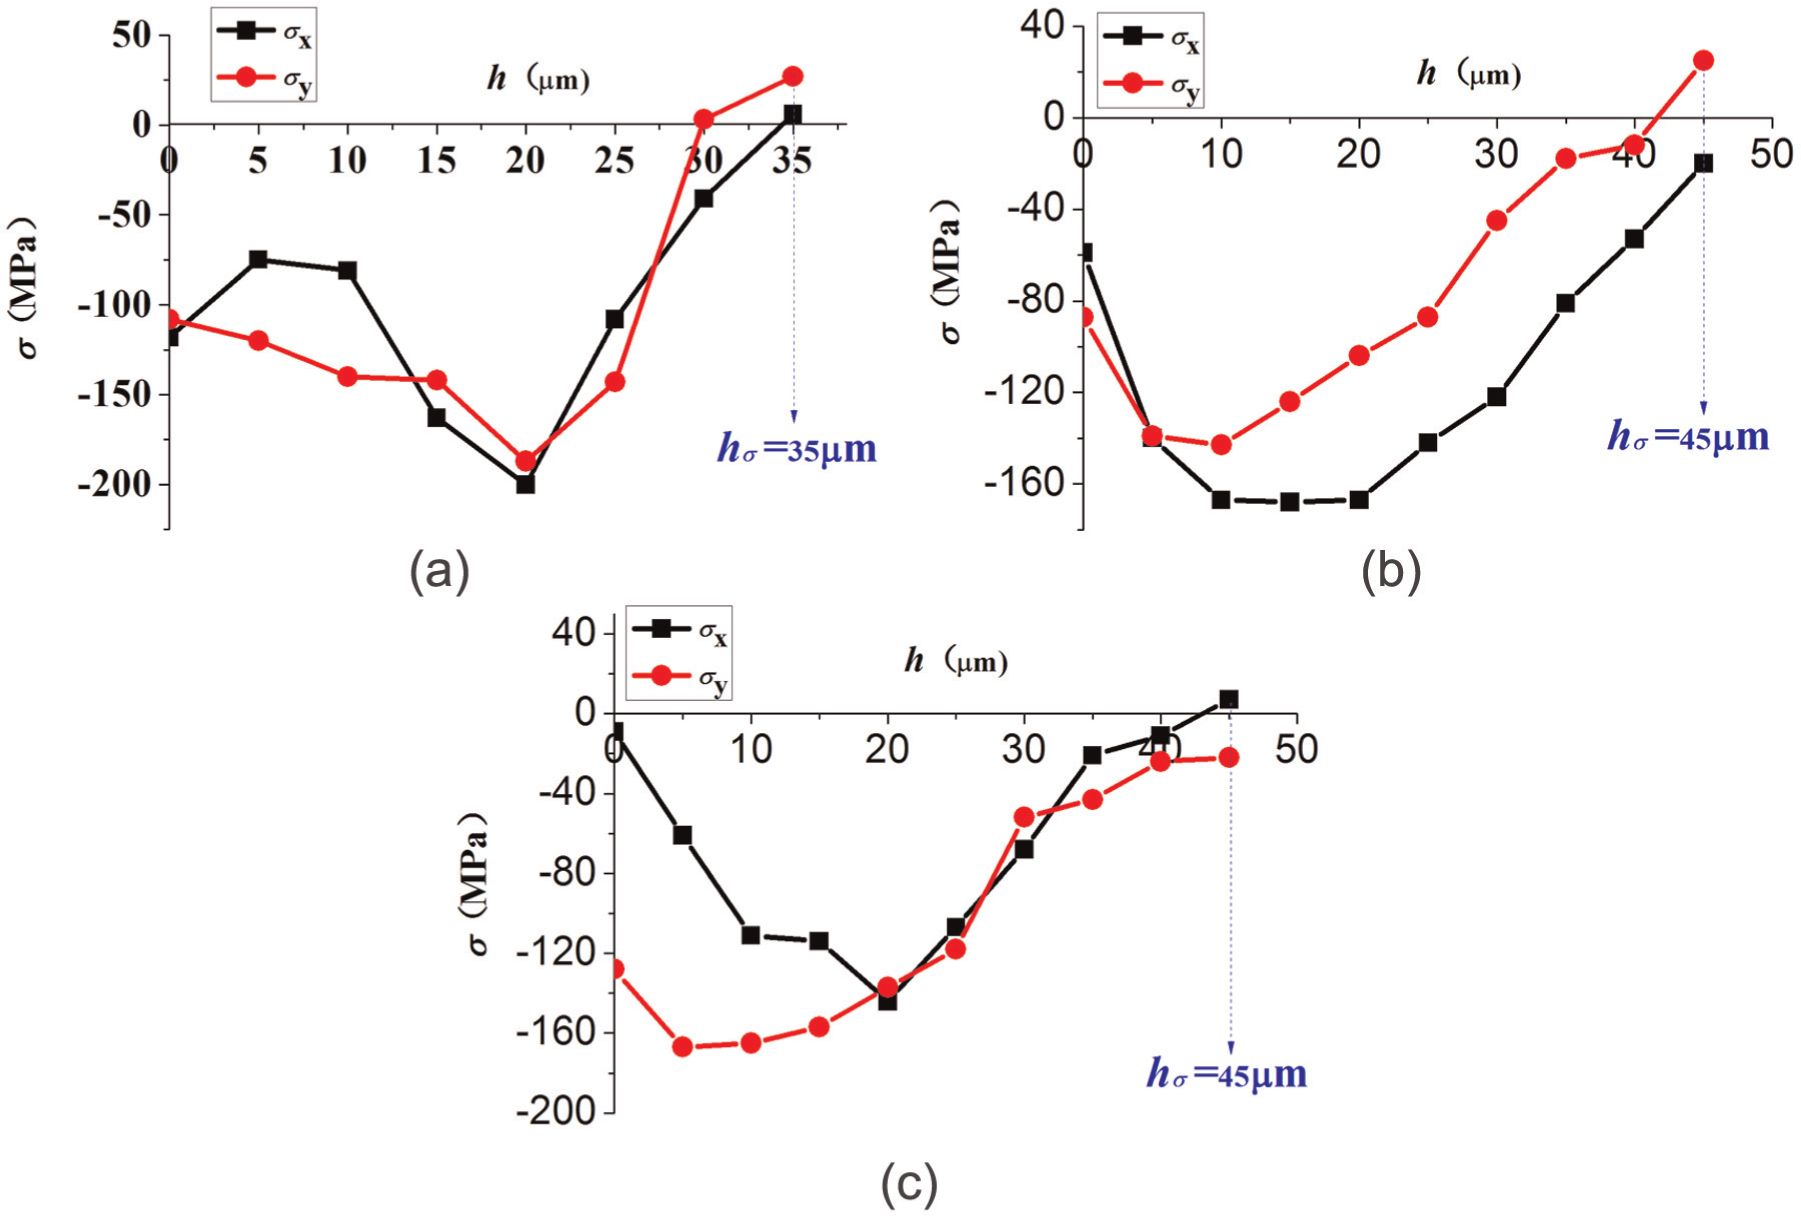
Distribution of residual stress on subsurface for three levels: (a) specimen 12, (b) specimen 13, and (c) specimen 14.
From specimens 12–14, milling force increased from 16 to 47 N, and milling temperature increased from 220 °C to 320 °C. In the first deformation zone, severe plastic deformation and shear effect induce large tensile stress. In the third deformation zone, severe friction and squeeze between flank of milling cutter and workpiece induce tensile plastic deformation. Small elastic modulus for aluminum alloy induces larger rebound on machined surface and leads to strong surface burnishing effect. Compared with the plastic bulge deformation effect by milling force and heat, surface burnishing effect by milling force is more significant. Both effects result in compressive residual stresses on machined surface.
Distribution of micro-hardness
Micro-hardness on subsurface for specimens 12–14 are all tested and shown in Figure 23. Micro-hardness for three levels changes slightly with increase in h. From specimens 12–14, milling force increases from 16 to 47 N, and milling temperature increases from 220 °C to 320 °C. The hardening effect increases with increase in force. The hardening effect is the combined result of cutting force enhancement and cutting heat weakening effect. The highest temperature of 320 °C does not exceed the dynamic recrystallization temperature and phase transition temperature.
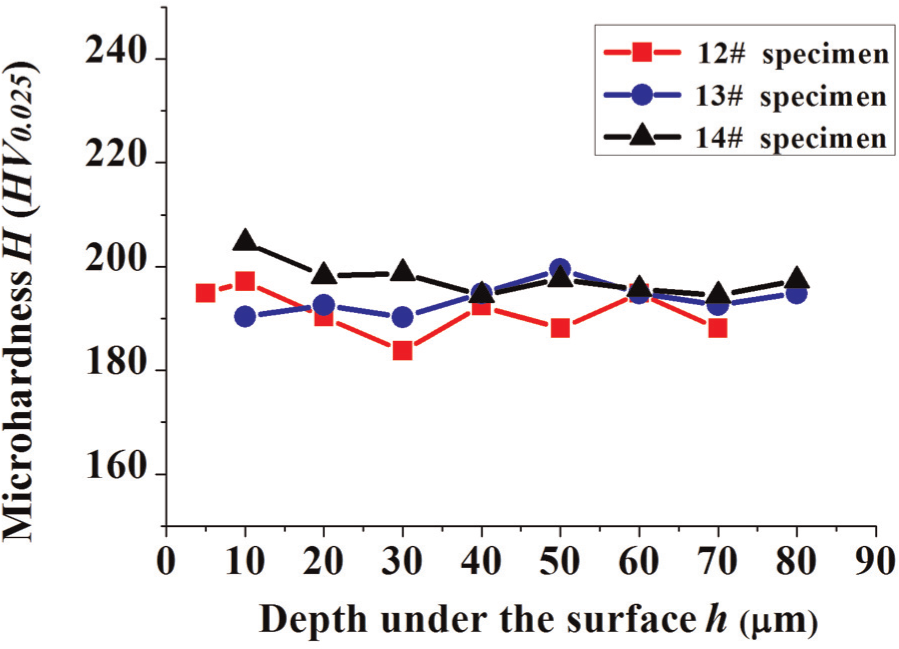
Distribution of micro-hardness in subsurface for three levels.
Microstructure
Microstructures of specimens 12–14 are shown in Figure 24. As can be seen, with increase in milling force and temperature, deformation degree of crystal grain increases, and the depth of deformation layer increases. Because most heat was taken away by chip, phase transition did not occur on three specimens.
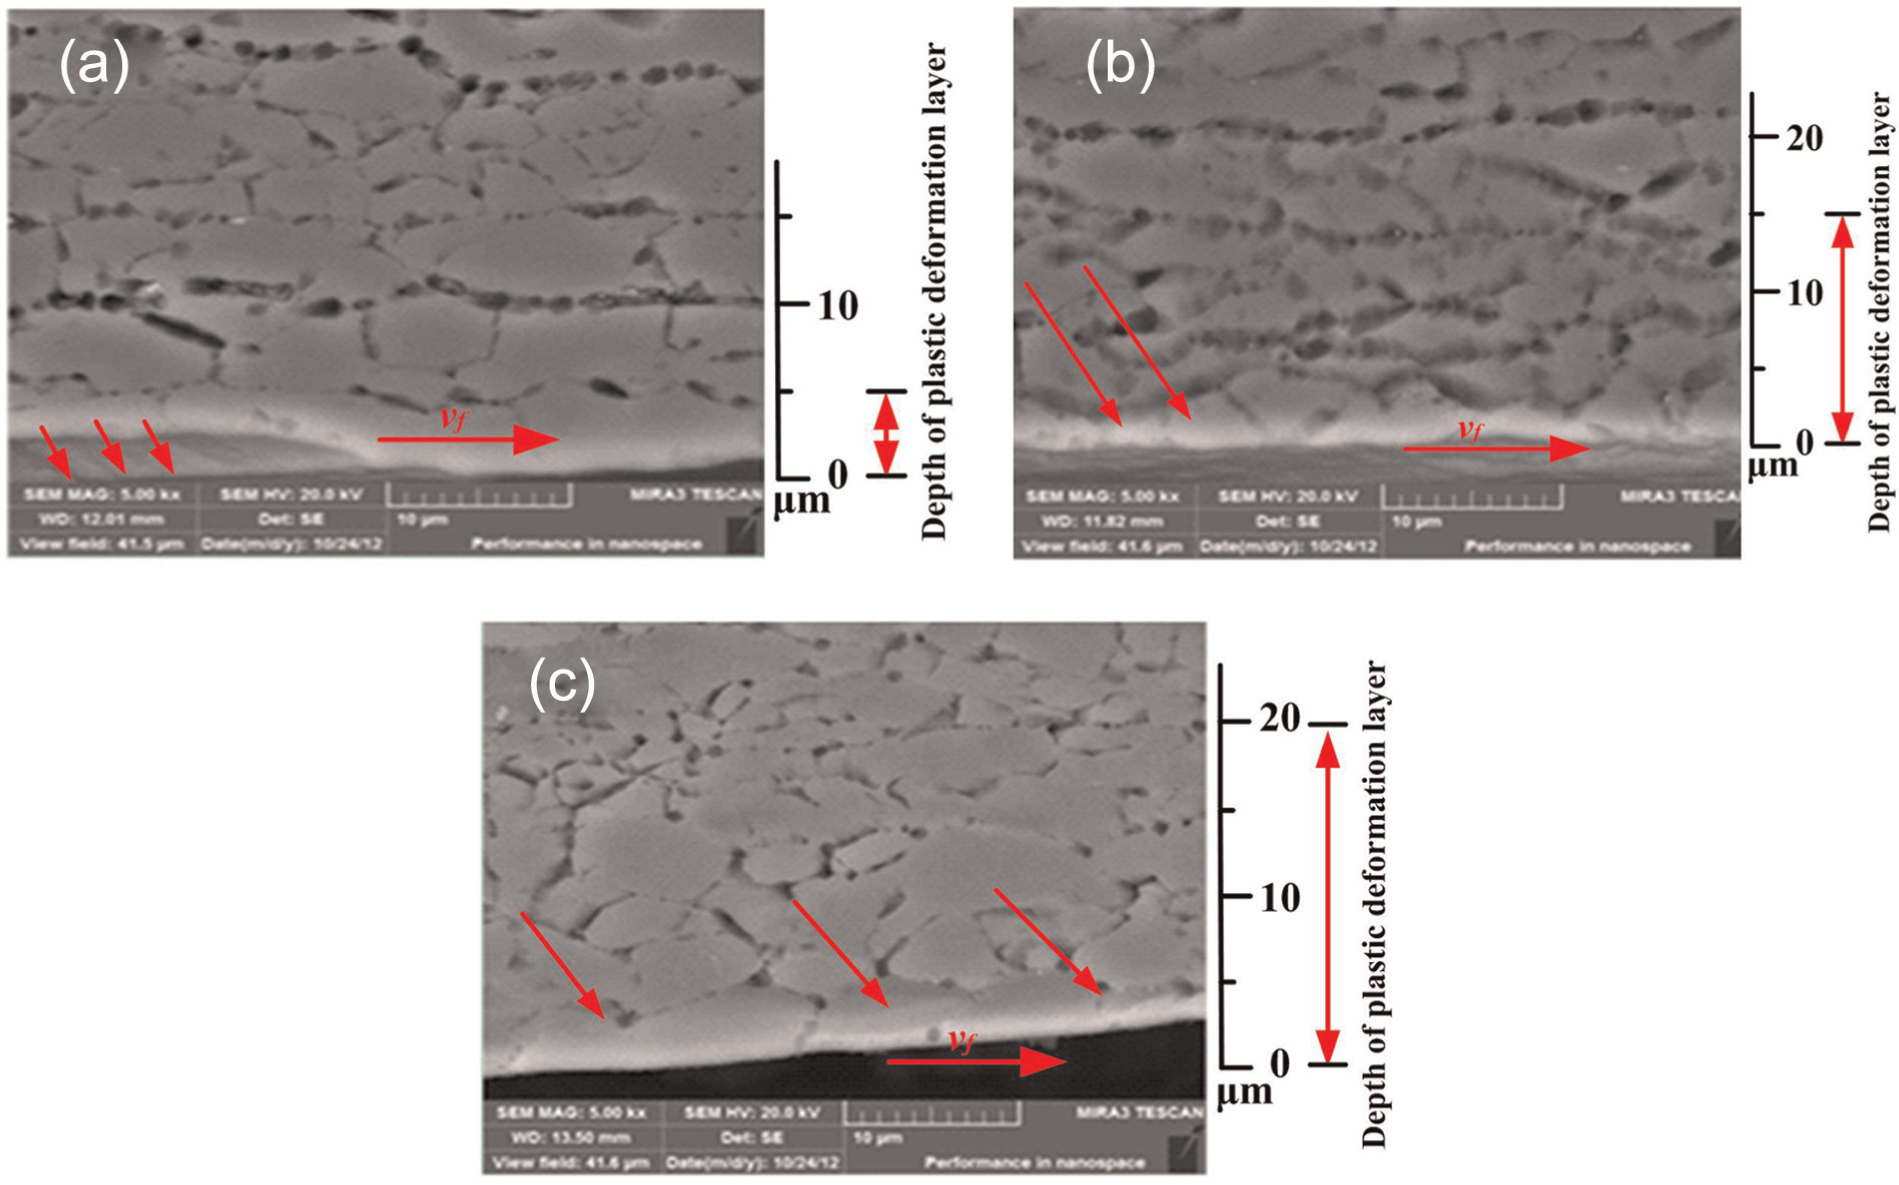
Morphology of microstructure for three levels: (a) specimen 12, (b) specimen 13, and (c) specimen 14.
From Figure 24(a), plastic deformation of specimen 12 is very small along feed direction, and the depth of deformation layer is less than 5 µm. This is mainly because of the fact that strain hardening on subsurface is not obvious when milling force and temperature are 16 N and 220 °C, respectively. From Figure 24(b), plastic deformation of specimen 13 along feed direction is larger than that of specimen 12, and the depth of plastic deformation layer is about 15 µm. This is mainly because strain hardening on subsurface increases when milling force and temperature are 36 N and 260 °C, respectively. From Figure 24(c), plastic deformation of specimen 14 along feed direction is larger than that of specimen 13. Surface grain fibrosis leads to a large degree of deformation, and the depth of plastic deformation layer is about 20 µm. This is mainly because strain hardening caused by thermal–mechanical coupling effect is significant when milling force and temperature are 47 N and 320 °C, respectively.
Conclusion
The major results obtained in high-speed milling of 7055 aluminum alloy are as follows:
Surface roughness is most sensitive to the variation of fz, secondarily sensitive to vc, and least sensitive to ap. Surface roughness increases with the increase in fz and ae, decreases with the increase in vc, and initially increases and then decreases with the increase in ap. The combined proportion of vc and fz affects surface topography.
The X direction residual stress σx is most sensitive to vc, secondarily sensitive to ae and fz, and least sensitive to ap. The σx increases with the increase in vc and ae, decreases with the increase in fz, and initially decreases and then increases with the increase in ap. The Y direction residual stress σy is most sensitive to vc, secondarily sensitive to ae and ap, and least sensitive to fz. The σy increases with the increase in vc, decreases with the increase in ap and ae, and initially increases and then decreases with the increase in fz. All machined surfaces perform compressive residual stress and change from −151 to −30 MPa.
Surface micro-hardness is most sensitive to vc, secondarily sensitive to fz and ap, and least sensitive to ae. Milling parameters have little impact on micro-hardness in high-speed milling of 7055 alloy, and micro-hardness changes from 185.2 to 197.14 HV0.025.
In high-speed milling of 7055 alloy, with increase in milling parameters in this research, milling force increases from 16 to 47 N, and milling temperature increases from 220 °C to 320 °C. The depth of compressive residual stress layer increases from 35 to 45 µm, and the depth of plastic deformation layer increases from 5 to 20 µm. Thus, the strong thermal–mechanical coupling effect induced large plastic deformation layer and large residual stress layer in metamorphic layer.
For high-milling 7055 aluminum alloy, when vc = 1100 m/min, fz = 0.02 mm/z, ap = 0.7 mm, and ae = 6 mm, good surface integrity can be obtained, and the surface roughness, surface residual stresses, and surface micro-hardness are Ra 0.258 µm, −123 MPa, −137 MPa, and 193.76 HV0.025, respectively.
Footnotes
Declaration of conflicting interests
The authors declare that there is no conflict of interest.
Funding
This study was supported by the National Natural Science Foundation of China (grant no. 51005184; grant no. 51375393), Aeronautical Science Foundation of China (grant no. 2013ZE53060), and graduate starting seed fund of Northwestern Polytechnical University (grant no. Z2013048).