
Abstract
The deformation energy in single point incremental forming has an immediate impact on the processing cost, the heat and the wear effects between the tool and the formed material. Meanwhile, poor forming quality is still one of the largest challenges for the development and commercialization of this method. Therefore, the goal of this study is to search for the optimal working condition for lower energy consumption with better forming quality during the forming process. A Box–Behnken design for a cone parts forming process has been performed. The effects of four input parameters (step down, tool diameter, wall angle, and initial sheet thickness) on three outputs—deformation energy, surface roughness, and geometric error—have been investigated. With the target of minimal synchronization of deformation energy consumption, surface roughness, and geometric error, which are 1522.4 J, 0.97 µm, and 1.939 mm, respectively, in this case, four processing parameters were optimized with tool diameters as 16 mm, step down as 0.5 mm, sheet thickness as 0.57 mm, and wall angle as 65°. With optimization of deformation energy and surface roughness, in conjunction with geometric error compensation, an increased accuracy of the resulting parts can be obtained with minimum deformation energy and surface roughness.
Keywords
Introduction
Single point incremental forming (SPIF) is an emerging technology for flexible metal processing. Unlike other conventional technologies, 1 it requires no dedicated dies to form a complex shape. With the use of computer numerical control (CNC) machines and simple tools, small batch production can be realized to meet the demands of diversity and personalization.2,3 The motion of the tool is controlled along the contour lines generated by the three-dimensional models. Accumulating plastic deformation between the tool and material can result in obtaining the target shape.4,5
In recent years, environment and sustainable problems for plastic process have considerable attention, as have SPIF processes.6,7 Duflou et al. 8 proposed that it can decrease energy use and enhance resource utilization in incremental forming processes by optimizing processing parameters. Branker et al.9,10 analyzed the cost, energy, and carbon dioxide emission in SPIF and found that the cost and energy usage reduce from US$4.48 and 4580 kJ to US$4.10 and 1420 kJ, respectively, by increasing the step down and feed rate. Ingarao et al.11,12 analyzed energy consumption in the incremental forming process and traditional stamping based on measured forming force. Ambrogio et al. 13 adopted CNC milling and turning machines for SPIF experiments. The results demonstrated that reducing the forming time and selecting a reasonable forming machine can effectively reduce the power consumption.
The forming quality is still one of the largest challenges for the development of SPIF. Surface quality and geometric accuracy are the main concerns of the qualities of forming products. The surface quality of forming parts not only determines the appearance of the product but also affects their use.
14
Although the entire forming force is small,
15
larger contact pressure between the sheet and tool head can hardly lead to the lubricant entering the contact area.
16
Proper surface coating of the tool head was employed to improve the forming parts’ surface quality to ensure the existence of lubricant at the contact area between the tool head and sheet in Hussain et al.
17
To create models for the equivalent roughness, Hamilton and Jeswiet
18
used Rz and Ra roughness and processing parameters, which showed strong sensitivity to the target shape and the step down. Azevedo et al.
19
evaluated the lubricant influence of different types on the surface qualities and forming forces generated by SPIF. The results showed that the lubricant leading to lower friction values and requiring less forming forces would be the most influential factor in performing this process. Durante et al.
20
obtained surface roughness with the tool head and the step down value by numerical calculation and determined that the theoretical relationships and experimental results followed the same trend. In the aspect of geometric accuracy, the geometric error for SPIF currently only reaches approximately
Several recent publications have focused on the subjects of the process parameters for SPIF based on the design of experiments. Bahloul et al. 24 used the Box–Behnken design (BBD) method to research the effect of four factors (wall angle, initial thickness, tool diameter, and step size) on sheet thinning rate and forming forces. The best process parameters with the objective of minimum forming forces and sheet thinning rate were generated by genetic algorithms in his work. Bagudanch et al.25,26 achieved the maximum temperature, forming force, formability, and surface roughness in the polymer SPIF using the design of experiments, the results were statistically analyzed, and the influences of five parameters (step down, tool diameter, feed rate, spindle speed, and different materials) were investigated. Liu et al. 27 considered the overall surface roughness in SPIF using the BBD method, the empirical model was established with four processing parameters on the surface roughness, and the optimal conditions were obtained with the minimum overall surface roughness.
From the above, the total energy consumption during the forming procedure is mainly from electric energy of the forming machine and the deformation energy. Among them, the former regards only the use of machine type, while the latter is in terms of the processing parameters, which directly affect the thermal and friction effects between the tool and material. Investigation of the variation in deformation energy can explain material deformation behaviors under different processing parameters. Meanwhile, little research exists on internal relations and interactions between the most relevant processing parameters, as well as on multi-objective optimization with deformation energy and processing qualities. In this work, using cones of Al 1060 sheets as the study object, the BBD method was used to investigate the most influential processing parameters involving step down, tool diameter, wall angle, and initial sheet thickness on deformation energy, surface roughness, and geometrical accuracy. Furthermore, on the basis of empirical models from response surface methodology (RSM), an optimal process parameter combination was obtained by multi-objective optimization on deformation energy, surface roughness, and geometrical accuracy.
Theoretical background
The main influential parameters concerning the SPIF process are shown in Figure 1, where t is original sheet thickness, D is the tool diameter, the vertical dimension between each adjacent trajectory is defined as step down Z, and the wall angle α is the angle between the horizontal plane and the deformed sheet.

Schematic representation of related parameters.
In contrast to the consumed electric energy being measured directly, in this work, the deforming energy is obtained by calculating the measured forming force components. As stated by the theory of SPIF, the total deformation energy is composed of deformation energy Ev and Eh. The difference is whether the tool moves along the vertical or the horizontal trace. As illustrated in Figure 2, deformation energy Ev is relative to the vertical force Fz, while the horizontal force Ft defines the deformation energy Eh. Therefore, the deformation energy at the ith contour can be calculated as follows

where tti is the needed time at the ith contour, as shown in Figure 4, f is the feed speed of tool, and Z is the step down. The deformation energy during the entire process is concluded as

With n = h/Z, h presents the total depth of the forming part.

Directions of Fx, Fy, Fxy, Fz, Fr, and Ft.
In this process, axial force Fz, radial force Fr, and tangential force Ft are three necessary components for the calculation of deformation energy. However, from experimental acquisition, Fx, Fy, and Fz are directly obtained component forces. Therefore, Figure 2 elaborates the conversion relation of Fx, Fy, and Fz and Fz, Fr, and Ft


where θ is the angle between the real position and the horizon line of the tool head, ψ is the angle between Fxy and Fx, and Fxy is the composite force of Fx and Fy.
Experiments
Experimental equipment
As shown in Figure 3, SPIF experiments were conducted on a three-axis CNC milling machine with a horizontal spindle. Hemispherical tools made of X210CrW12 were used to form the material. Al 1060 sheets with a size of 140 mm × 140 mm and three different initial thicknesses were employed during the experiments. The chemical compositions and mechanical properties of the material are shown in Tables 1 and 2. The tool speed remained the same at 500 mm/min, and the target shape was conical with a forming depth of 24 mm. Fuchs Renoform Fw50 oil was used to reduce friction and excess surface wear between the tool and sheet.

Single point incremental forming device.
The chemical composition (wt%) for an Al 1060 sheet.

Mechanical properties of an Al 1060 sheet.

The component forces during the forming processing were measured by a force platform, a Kistler 9257B three-component force dynamometer, which is able to measure a vertical force within ±10 kN and two horizontal forces within ±5 kN. Using the data acquisition device, the three-component forces can be recorded, as shown in Figure 4.

Forming force components during the process.
The surface roughness Ra is the most widely recognized parameter to evaluate surface roughness. In this article, the value Ra of the formed parts was acquired by a TR200 roughness meter. To minimize error, an average of five readings was calculated to characterize the surface roughness for each forming part. Figure 5 displays a three-dimensional scanner that is used to scan the forming shape, and then Geomagic Qualify was applied to assess the deviation between the forming parts and target shapes. The cross-sectional profile through the part center and vertical direction (Z) was to estimate geometric accuracy. The average deviation between the forming parts and target shapes in the vertical direction was defined as geometry error, as indicated in Figure 6.

The part shape scanning device.

Comparison between the measured and target shape.
Design of experiment
The RSM as an empirical model method was employed to study the internal relations of process variables and to develop a mathematical model that can precisely describe the overall process. Because more process parameters are involved in the forming process, the BBD was selected as the experiment method. In this research, tool diameter D, step down Z, initial sheet thickness T, and wall angle α were chosen as process parameters for analysis and study, and each parameter received three levels. The factors and values in the BBD method are summarized in Table 3.
Independent factors and the levels.

Results and discussion
The specific experimental scheme and results are shown in Table 4. In terms of experimental results including deformation energy, surface roughness, and geometric error, further investigations were performed to research the effects of each factor on the three responses mentioned above, as necessary. On this basis, functional relations of three responses were fitted individually using the RSM, and the quadratic model was taken in this study

where y is the response result, xi is the factor variables,
Experimental scheme and results.

Deformation energy
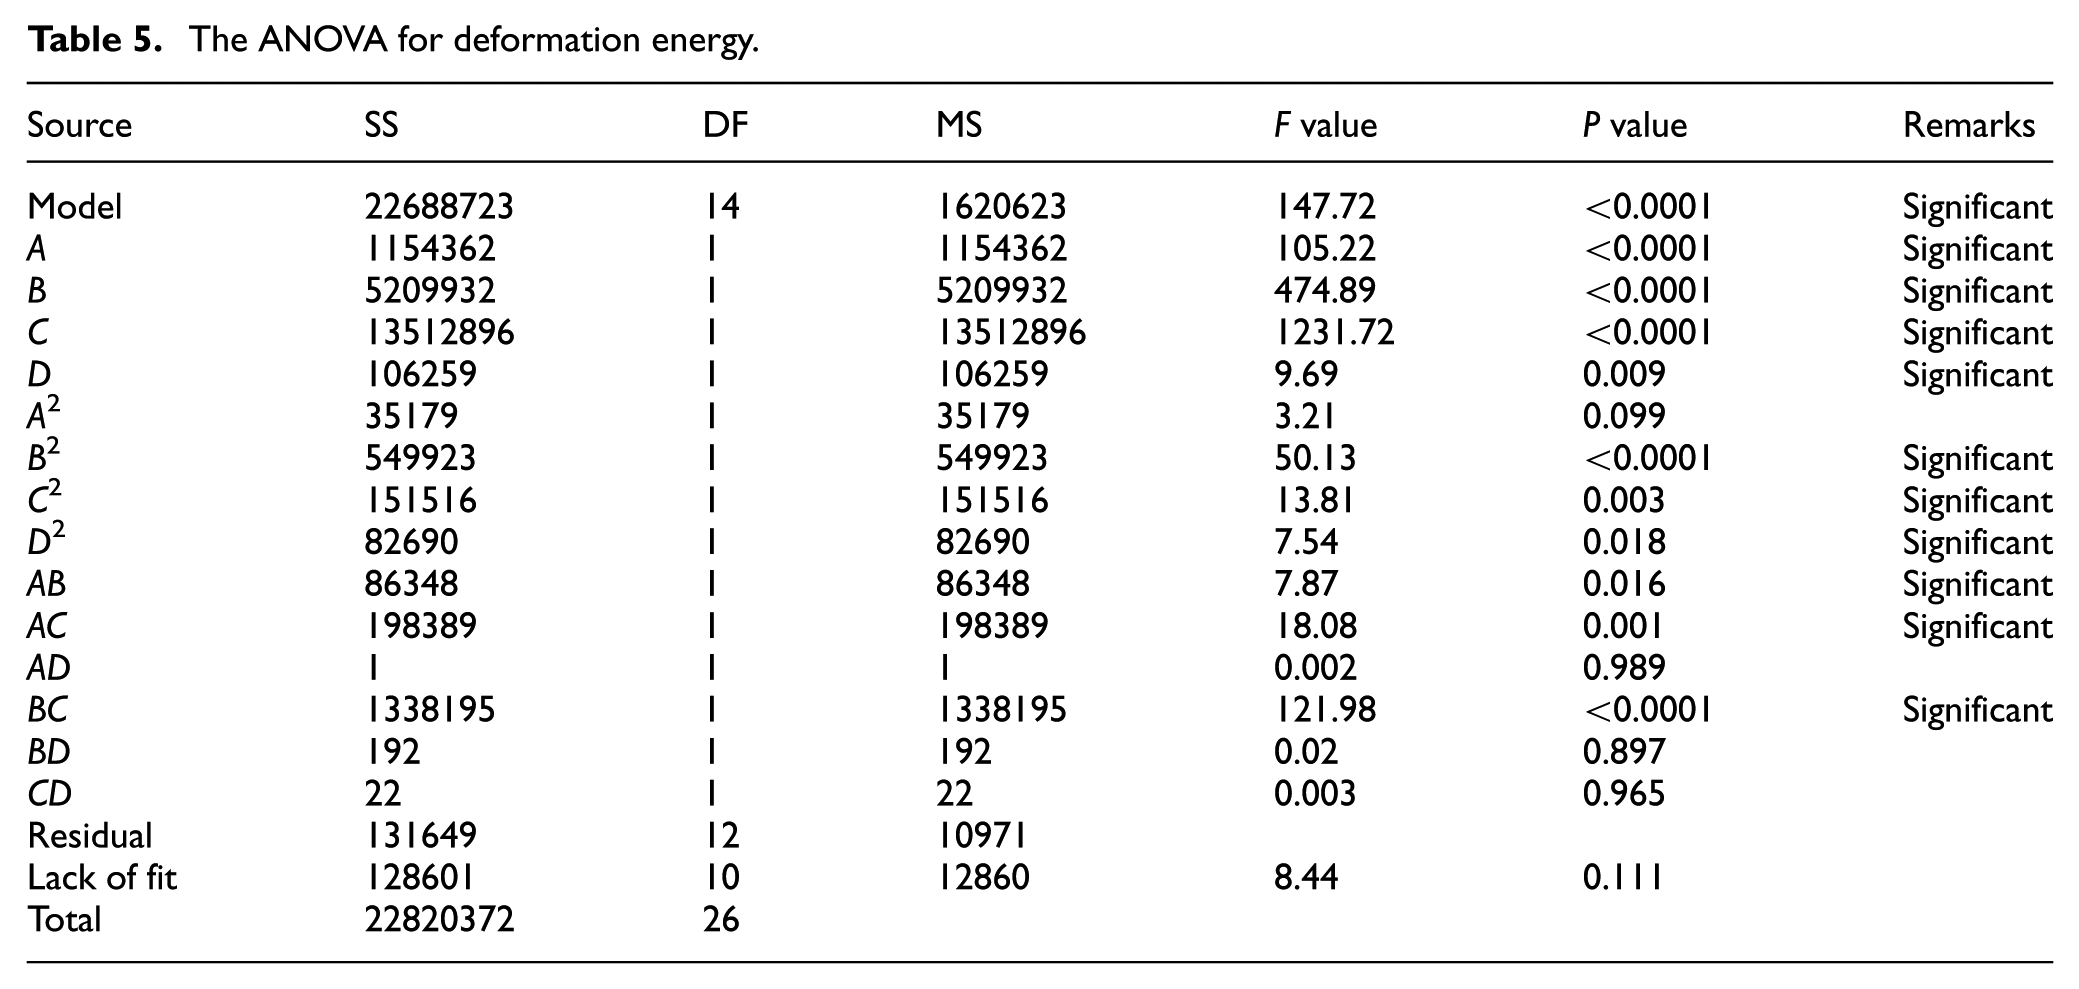
Analysis of variance (ANOVA) was used to estimate the fitness of the developed model and to judge the significance of each factor to responses. ANOVA results of deformation energy are listed in Table 5. The level of confidence is 95%, which means that the factor effect is identified to be significant to the response in the situation when the corresponding P value is less than or equal to 0.05. From Table 5, when the P value of the entire model is less than 0.0001, this illustrates satisfactory approximation of the established quadratic model. Figure 7 shows normal probability plot of residual for the response of deformation energy. It can be seen that the distribution of points tends to be linear, suggesting that the results do not have a large deviation. Furthermore, the model prediction ability is commonly measured by the value of predicted R2. A higher value of R2 of 0.9942 indicates a highly matching predictions model for the experiment, which can be widely used for further studies.
The ANOVA for deformation energy.
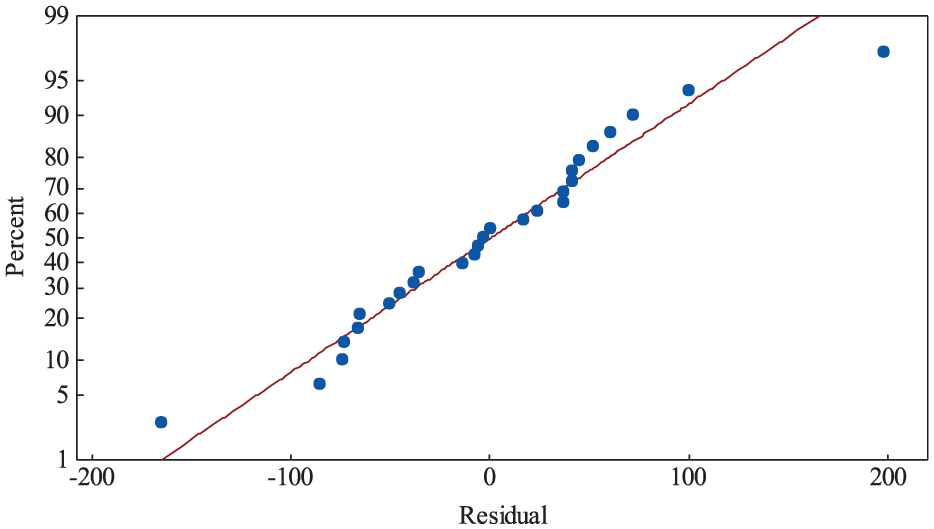
Residuals plot for deformation energy.
Due to the difference in measurement scales and units from factors, the obtained model fails to analyze the effects of each factor on response correctly. Therefore, the deformation energy model is obtained from the use of coded parameter values and the elimination of insignificant factors, as presented in equation (6). From the P value in Table 5 and the coefficient in equation (6), all four factors have remarkable linear effects, especially the thickness (C). Moreover, the quadratic effect of the step down (B2) and two-level effects of sheet thickness and step down (BC) have the most influential contributions to the deformation energy
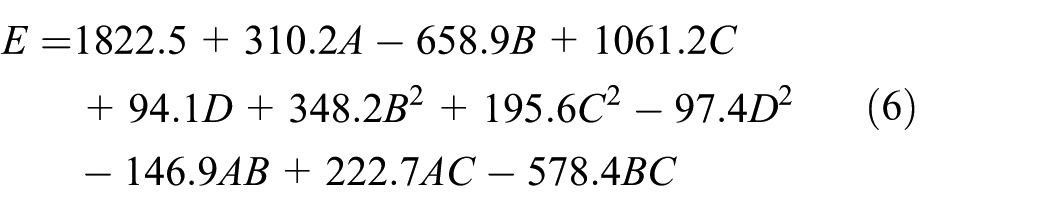
Figure 8 presents the three-dimensional response surfaces on the deformation energy by variable factors, and each of them is received while the two other factors remain at level 0. In previous research, Arenes et al. 16 established an empirical formula to predict the forming force during the process based on a large amount of experiments. The formula included five parameters (step down, wall angle, sheet thickness, tool diameter, and ultimate tensile strength). According to the equation, the maximum force increased with higher sheet thicknesses because more material deformation occurred during the forming processing. The relatively larger forming force leads to increased deformation energy consumption with the fixed target shape, and therefore, the deformation energy increases with an increase in the sheet thickness. The same variation is obviously observed in Figure 8(b), (d), and (f). Similar to the sheet thickness, when a larger tool diameter was used, the forces increased because the contact zone between the sheet and the tool increased. Therefore, the increase in tool diameter leads to the increase in deformation energy, as shown in Figure 8(a)–(c), especially on the occasion of a smaller step down and larger sheet thickness. With an increase in the step down, the forming force demonstrated a linear growth in previous experiments. 28 However, this resulted in a shorter forming trajectory, which was associated with decreased friction and energy consumption. 12 In consequence, the influence of step down on deformation energy consumption is more complex than a monotonic relationship, as displayed in Figure 8(d). The larger wall angle could cause the contact area to expand, leading to a gradual increase in the forming force and thus a slight increase in deformation energy with a large wall angle, as shown in Figure 8(c), (e), and (f).

Three-dimensional response surfaces for the deformation energy: (a) the effect of tool diameter and step down, (b) the effect of tool diameter and sheet thickness, (c) the effect of tool diameter and wall angle, (d) the effect of step down and sheet thickness, (e) the effect of step down and wall angle, and (f) the effect of sheet thickness and wall angle.
Surface roughness
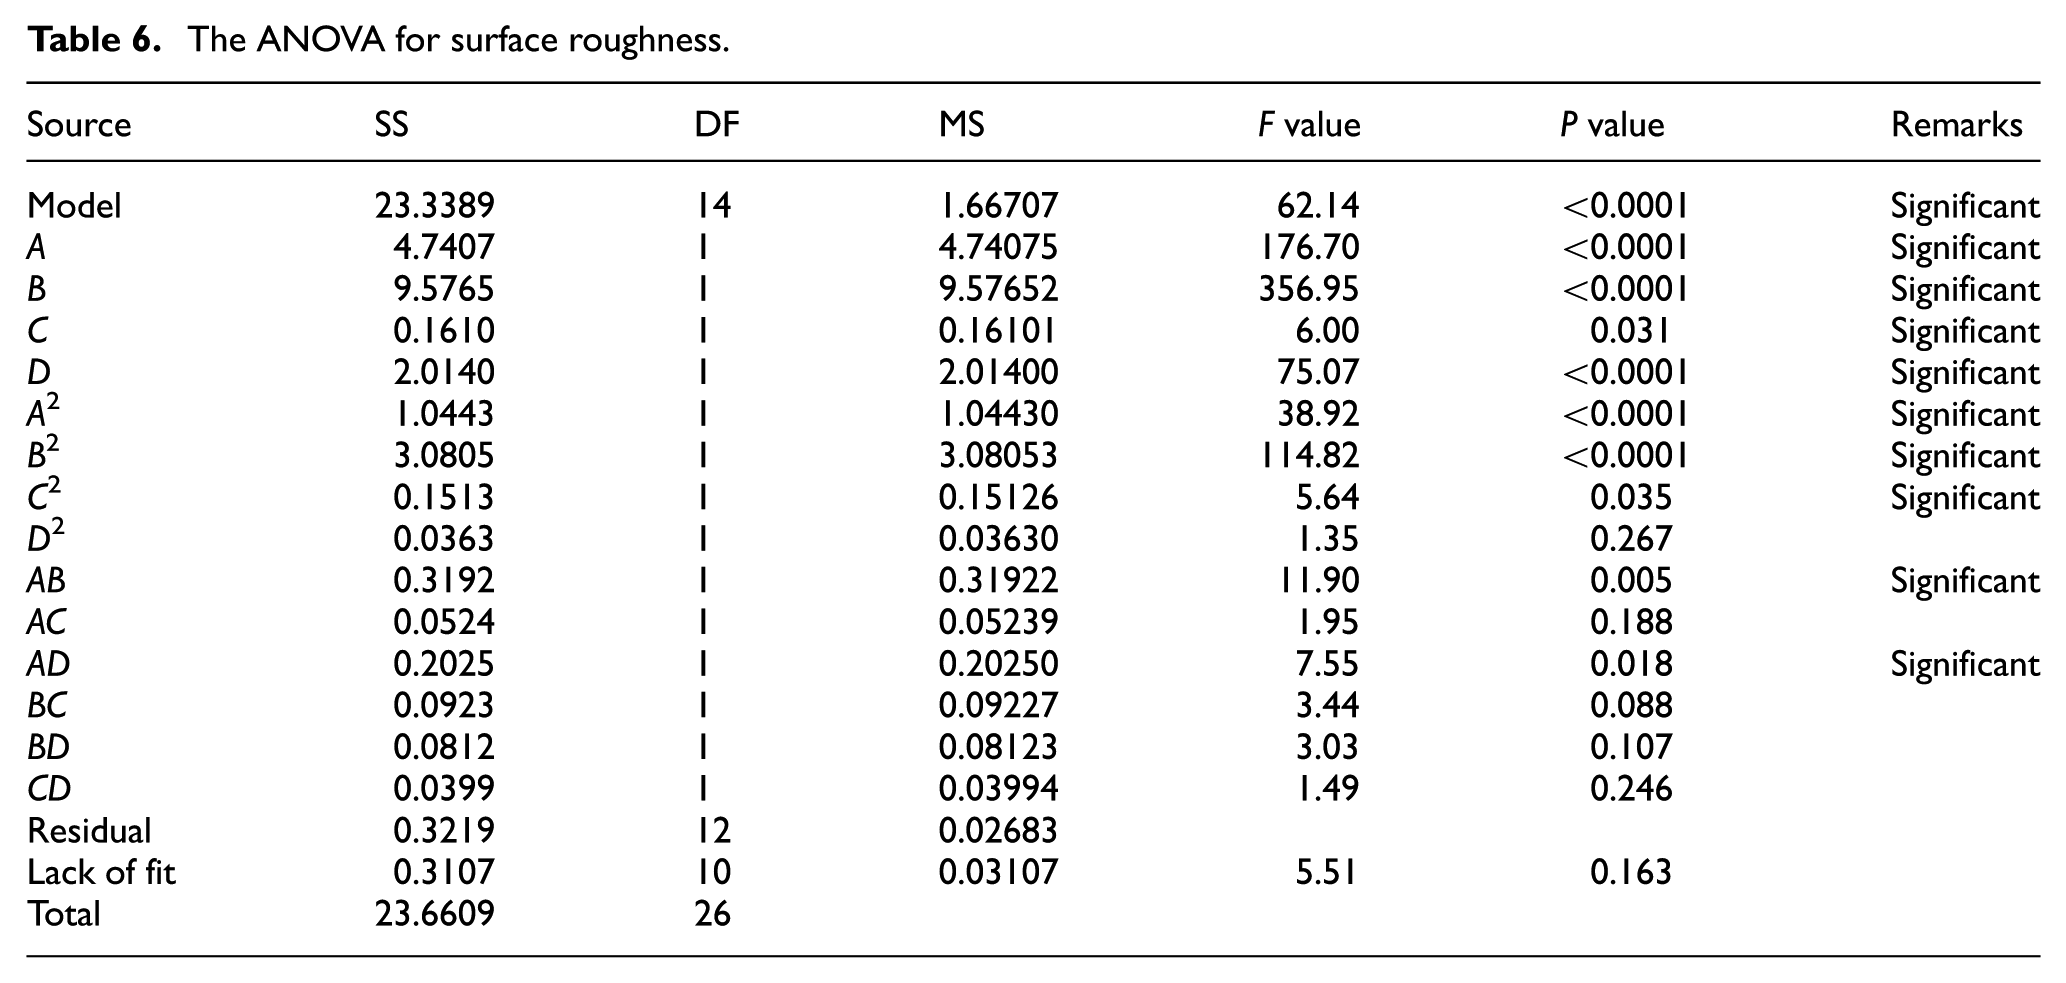
Similar to the former analysis of deformation energy, ANOVA results of surface roughness are listed in Table 6. The level of confidence is 95%. From Table 6, with the P value of the entire model is less than 0.0001, this indicates sufficiently adequate conditions for the established quadratic model. Figure 9 shows that normal probability plot of residual for the response of surface roughness has no large deviation. The predicted R2 value coefficient of 0.9736 can give a better evaluation in experiments.
The ANOVA for surface roughness.

Residuals plot for surface roughness.
By eliminating insignificant factors, the surface roughness model with coded parameter values is obtained in equation (7). From the P value in Table 6 and the coefficient in equation (7), all four factors show remarkable linear effects. The former study suggested that the step down has the greatest influence on the surface roughness, 29 exactly as shown in equation (7). Moreover, the quadratic effect of the step down (B2) and the two-level interaction effects of tool diameter and step down (AB) have the most significant influence on surface roughness of the forming parts

For in-depth study, while maintaining two other factors at a fixed level of 0, variable factors were adopted to obtain response surface plots of surface roughness, as presented in Figure 10, where the roughness varies from 1.5 to 5.5 µm. Bhattacharya et al. 14 researched the effect of SPIF on surface roughness through experimental investigations, and it was reported that the surface roughness increased with a decrease in the tool diameter for all step downs. The same variation is obviously observed in Figure 10(a)–(c). Moreover, the smaller the diameter is, the more obvious the roughness changes will be. This can be attributed to more overlap zones between the neighboring trajectories in cases of an unchanged step down. Four significant parameters were studied to evaluate their effects on surface roughness using the Taguchi method and ANOVA. 30 It was concluded that step down influenced roughness most; as step down became larger, roughness increased. The same variation is obviously observed in Figure 10(a), (d), and (e). This is because the increase in step down could directly cause the increase in residual height that contributes to the surface quality of forming parts. From Figure 10(c), (e), and (f), the roughness diminishes with an increase in the forming angle, with the same trend being observed by Bhattacharya et al. 14 This is due to the increased undeformed area that can be found with lower wall angles, while increasing wall angles will generate more overlap areas between the neighboring trajectories. Additionally, as displayed in Figure 10(b), (d), and (f), roughness is insensitive to sheet thickness. It increases only slightly with a tool diameter of 16 mm. The conclusion is that the negative quadratic influence of the sheet thickness can create a nonlinear effect on surface roughness, as obtained in equation (7).

Three-dimensional response surfaces for the surface roughness: (a) the effect of tool diameter and step down, (b) the effect of tool diameter and sheet thickness, (c) the effect of tool diameter and wall angle, (d) the effect of step down and sheet thickness, (e) the effect of step down and wall angle, and (f) the effect of sheet thickness and wall angle.
Geometric error
ANOVA results of geometric error are listed in Table 7. The level of confidence is 95%, and the P value is less than 0.0001, which indicates that the model can be adequately applied. Figure 11 shows a normal probability plot of residual for the response of geometry error, showing that the statistics hardly deviate. The predicted coefficient of 0.9651 can give a better evaluation in experiments.
The ANOVA for geometric error.

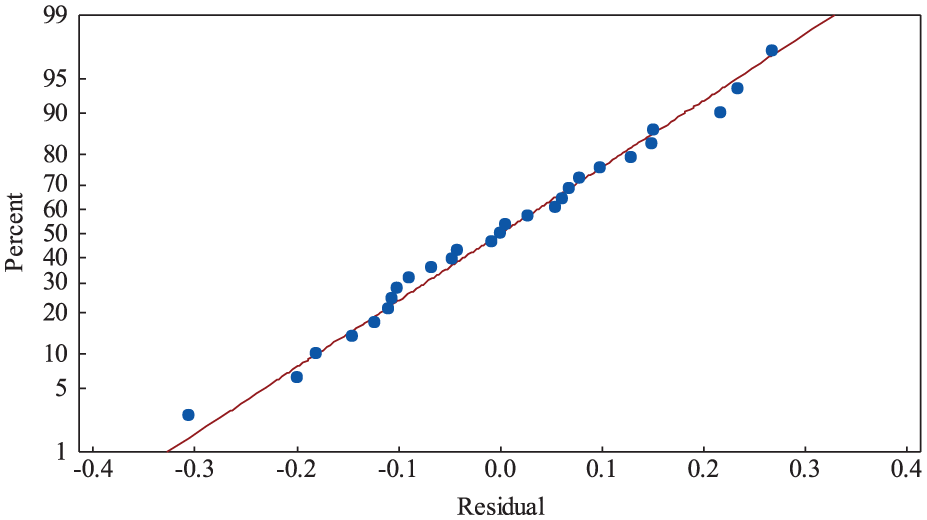
Residuals plot for geometric error.
As stated before, the model of geometric error is presented in equation (8). According to the coefficients in equation (8) and the P values in Table 7, all four factors show remarkable linear effects, among which sheet thickness (C) performs the best. Moreover, the quadratic effect of the wall angle (D2) and the two-level interaction effects of sheet thickness and wall angle (CD) have the most significant influence on the geometric error of forming parts

Variable factors were chosen to obtain response surface plots of geometric error with two other factors maintained at a fixed level of 0, as shown in Figure 12, where the geometric error ranges from 1.5 to 5.5 mm. As shown in Figure 12(a)–(c), geometric error increases with an increase in the tool diameter when selecting a thicker sheet. In addition, geometric error increases first and then decreases following an increase in the tool diameter. Under all studied circumstances, it is indicated that the negative quadratic influence of the tool diameter can create a nonlinear effect on part geometric accuracy in equation (8). The geometric error displays similar behavior as an increase in wall angle, as shown in Figure 12(c), (e), and (f). From Figure 12(d), in the case of a thicker sheet, geometric error is obvious with a larger step down, which is in accordance with the work of Lu et al. 31 The transition area between neighboring trajectories allows for better control of material deformation, which achieves better part accuracy. In the meantime, improved part accuracy can be obtained from a reduced step down. Figure 12(b), (d), and (f) illustrates that the thicker the sheet is, the larger the geometric error becomes, especially with a step down of 1.5 mm and a tool diameter of 16 mm. The same results can be found in a previous study. 32

Three-dimensional response surfaces for the geometric error: (a) the effect of tool diameter and step down, (b) the effect of tool diameter and sheet thickness, (c) the effect of tool diameter and wall angle, (d) the effect of step down and sheet thickness, (e) the effect of step down and wall angle, and (f) the effect of sheet thickness and wall angle.
Multi-objective optimization
On the basis of previously obtained quadratic models regarding deformation energy, surface roughness, and geometric error, the desirability function using an optimization of the RSM in Minitab was conducted for multi-objective optimization. The desirability function ranges from 0, which suggests that the response is completely unsuitable, to 1, which suggests that the response is a satisfactory approximation to the target value.
To acquire minimal synchronization of deformation energy, surface roughness, and geometric error, each response should be set to range from 0 to 1. Because each response shares equal importance in this work, all the weights were set to 1. Figure 13 displays the optimal results. It is observed that the variation trends of desirability followed by the change in each parameter are plotted in the first row, and the values within square brackets represent the parameters combination creating the optimum of the three responses. Composite desirability peaks at 0.897, with a tool diameter as 16 mm, a step down as 0.5 mm, a sheet thickness as 0.57 mm, and a wall angle as 65°. The deformation energy, surface roughness, and geometric error are 1522.4 J, 0.97 µm, and 1.939 mm, respectively.

Multi-response optimization results.
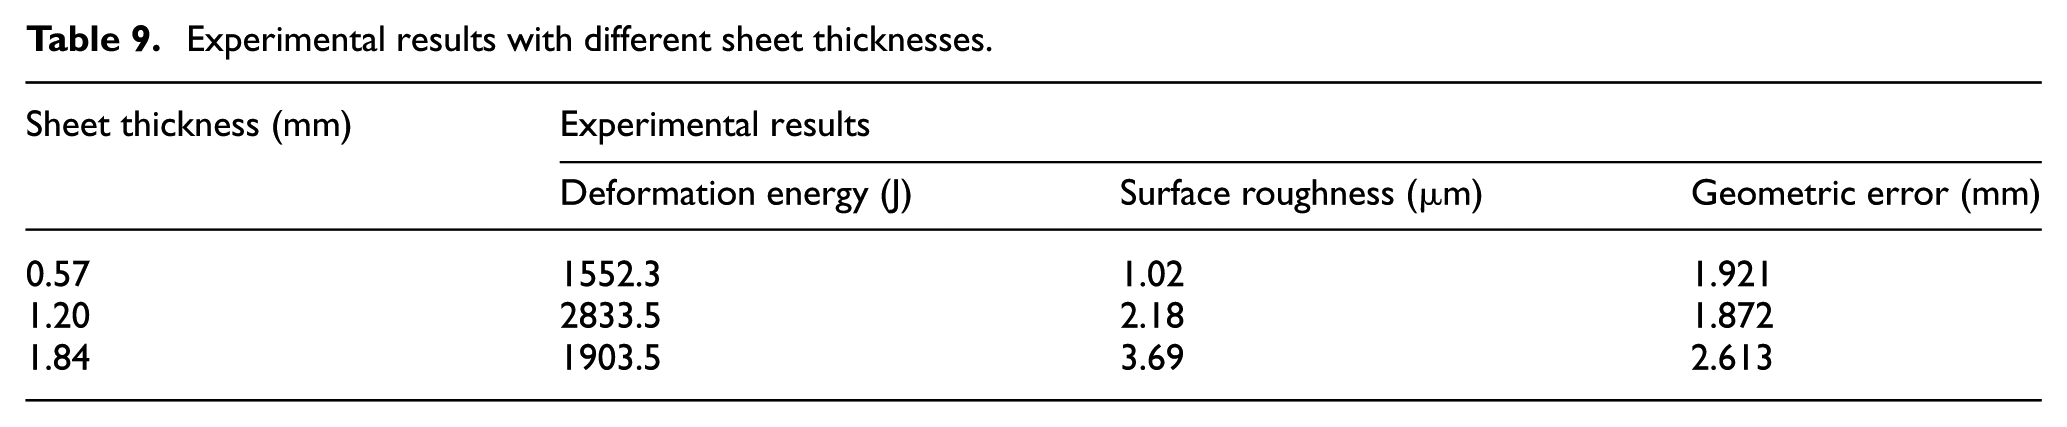
In actual production, the sheet thickness is commonly defined, and the optimized results are listed in Table 8. Table 9 indicates the experimental results using the optimized parameter combination, and a smaller error in the absolute value between the results of experiments and optimizations is observed, indicating that the RSM response model presents better fitting with the experimental results.
Optimized results with different sheet thicknesses.

Experimental results with different sheet thicknesses.
Through multi-objective optimization, the consumed deformation energy and surface roughness diminish, while the geometric error shows difficulty meeting the requirements for practical use. To improve the geometric accuracy of forming parts, the method of target contour compensation was employed. In Figures 6 and 14, the compensation was only adopted in the slope area, where the geometric error was obviously larger than that in the bottom of the part. The calculation equation of compensation X is shown in equation (9)

where

The method of target contour compensation.
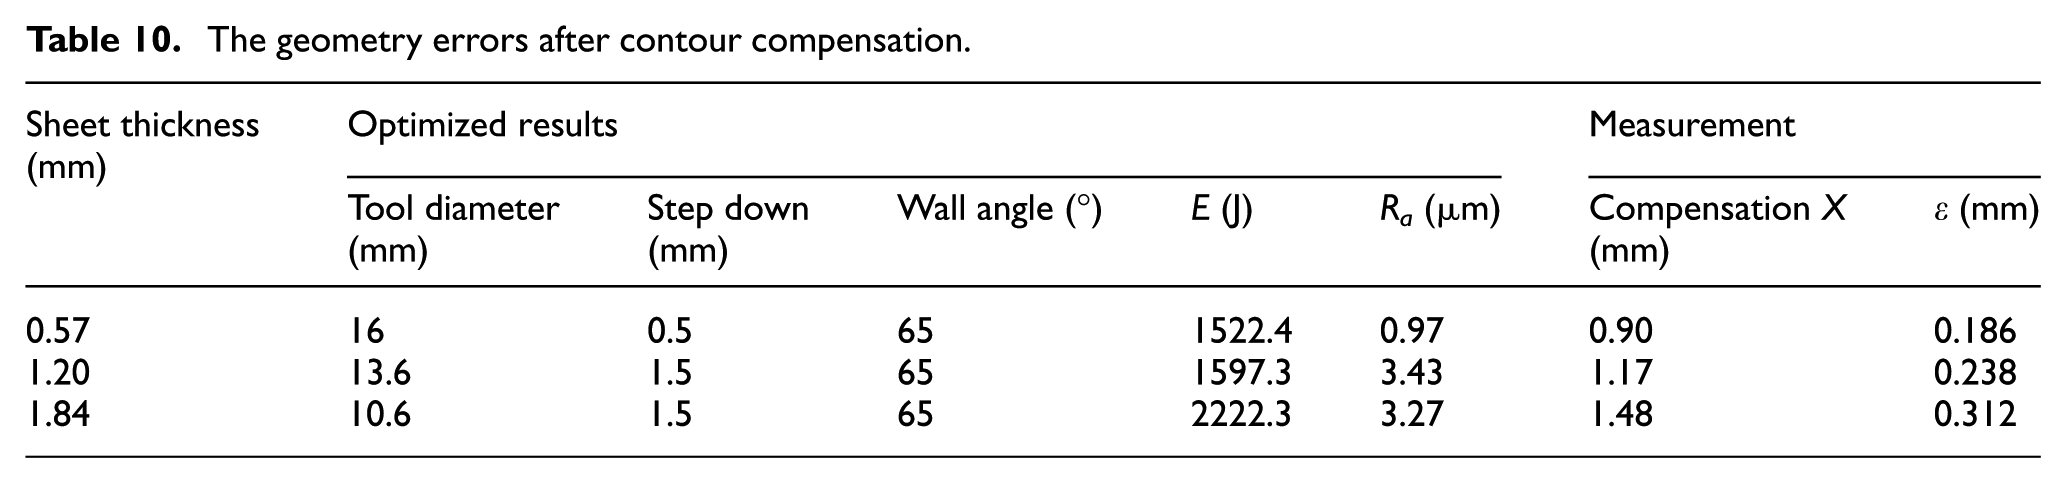
The geometric error was calculated by equation (8) with minimal synchronization of deformation energy and surface roughness. Then, the forming parts were compensated through the compensation X obtained from equation (9). The results from measurements are listed in Table 10, which show that forming parts of high precision can be accomplished in this way.
The geometry errors after contour compensation.
Conclusion
In this study, the BBD method was applied to investigate the influence of four input parameters (step down, tool diameter, wall angle, and initial sheet thickness) on the three outputs concerning deformation energy, surface roughness, and geometric error in SPIF. The quadratic empirical modeling of the three outputs has been established under different conditions of process parameters. Furthermore, the optimal process parameters conditions were obtained to achieve the minimum deformation energy and the best forming quality using desirability functions. The conclusions are drawn as follows:
The deformation energy is obtained from forming force components. The thickness presents the most remarkable linear effect. Meanwhile, deformation energy increases with an increase in the sheet thickness, tool diameter, and wall angle, among which wall angle shows the smallest influence on deformation energy.
The surface roughness (Ra) is influenced most by the step down and is proportional to an increase in the step down. On the contrary, it is inversely proportional to an increase in the wall angle and tool diameter. With smaller tool diameters, the surface roughness changed more obviously.
Sheet thickness affects geometric error more significantly than any other parameters, which increases with an increase in the thickness. The tool diameter and step down showed similar behaviors as sheet thickness with respect to geometric error, although only in the case of thicker sheets. Additionally, geometric error increased first and then decreased with an increase in the wall angle.
With the target of minimal synchronization of deformation energy, surface roughness, and geometric error, which are 1522.4 J, 0.97 µm, and 1.939 mm, respectively, experimental parameters of tool diameter, step down, sheet thickness, and wall angle are 16 mm, 0.5 mm, 0.57 mm, and 65°, respectively. By optimizing the deformation energy and surface roughness, in conjunction with geometric error compensation, higher accuracy in the forming part can be obtained with a minimum deformation energy and surface roughness.
Footnotes
Academic Editor: Xichun Luo
Declaration of conflicting interests
The author(s) declared no potential conflicts of interest with respect to the research, authorship, and/or publication of this article.
Funding
The author(s) disclosed receipt of the following financial support for the research, authorship, and/or publication of this article: This work was supported by National Natural Science Foundation of China (NSFC) grant funded by the government of China (nos 51475366 and 51475146).