
Abstract
Based on Bezier curve, experimental design theory, and response surface method, the optimization design method for turbine blades is established. The turbine of turbodrill tested on the bench is taken for an example, and the numerical simulation model is established using third-order Bezier curve fitting blade surfaces. The model is then verified by test experiment data of the turbine bench and proven to be reliable. The blade structure parameters are defined as independent variables, and the maximum efficiency is defined as the objective function. Based on the simulation results by the computational fluid dynamics, first the significant impacts on the blade profile parameters are filtered out by seven times in single-factor sensitive analysis, and then the relationship between the objective function and independent variables is obtained by using the Box–Behnken design and response surface methodology. Moreover, the regression equation of turbine efficiency and blade structure parameters is built, and the interaction effects between the parameters are analyzed. Numerical simulations on three selected groups of optimum combination show that computational fluid dynamics simulations are in good accordance with the calculations based on response surface method; furthermore, compared with the reference model, the performance of the optimized model is significantly improved, of which efficiency can be increased by more than 10%. This study can provide a new perspective and basis for the design and optimization of the turbodrill blades.
Introduction
As an important downhole motor, due to its high rotation speed, high temperature resistant, and non-rubber components, turbodrill has been widely applied in the oil and gas fields.1,2 Additionally, combined with an efficient bit, it can achieve anti-deviation and fast penetration, which has been successfully tested in many oilfields.3,4
Turbodrill provides exciting possibility for drilling through and completing wells in deep region. As the core component of turbodrill, turbine has a critical impact on the performance of the whole motor. In general, turbine is a type of hydraulic axial turbomachinery that composes of the rotor and stator, which converts the hydraulic power provided by the drilling fluid (pumped from the surface) into the mechanical power while diverting the fluid flow through the stator vanes to rotor vanes. The blades with complex shape are designed by various profiles for optimum performance. Consequently, design and optimization of the blade profiles play an immeasurable role in improving turbodrill performance.
In recent years, optimization design on turbine blades has attracted the attention of many scholars. A Oyama et al. 5 used a three-dimensional (3D) Navier–Stokes solver for aerodynamic analysis and the real-coded adaptive range genetic algorithm for efficient and robust design optimization of the transonic axial-flow blade. By optimizing two-dimensional (2D) compressible flow of axis-flow turbine vanes, SY Cho et al. 6 improved the turbine performance; M Natanal et al. 7 put forward a method in which the computational fluid analysis (CFA) was utilized to optimize the blade profile, inlet angle, and outlet angle of an asymmetric turbine; ÖÖksüz and İS Akmandor 8 applied a new multiploid genetic algorithm for a multi-objective turbine blade aerodynamic optimization problem, and it was found that this method successfully accelerated the optimization and prevented the convergence with local optimums; T Korakianitis et al.9,10 proposed a specific surface curvature distribution blade design method for the 2D and 3D high-efficiency rotation machinery blades; combining computational fluid dynamics (CFD) and fluid–structure interaction (FSI), A Mokaramian et al. 11 optimized the blade profile of a small-diameter turbodrill particularly used in coiled tubing operation.
Although many scholars devote much to improving the performance of turbine with various methods, there were few descriptions about optimal methods for turbine blades design and few works focusing on the optimal process containing all blade parameters, which play a significant role in improving turbodrill performance. Thus, in this article, on the basis of Bezier curve, experimental design theory, and response surface method, an optimization design method of the turbodrill blades was developed. Also, the sensitive analysis and response surface method were described. Then the results were presented and discussed. At the end, the method was confirmed by the turbine bench test experiment data and the simulation results for the design of the turbodrill blades.
Blades design
Bezier curve, which has been successfully applied as an advanced geometric modeling tool due to its unique geometric properties, combining with basis function of Berstein polynomial, is used to construct the turbine blade profile in this article. 12
Definition
It is assumed that there are k+1 points of position vector provided in space (i = 0, 1, 2, …, k), and the corresponding k-time Bezier curve can be expressed as

where Bi,k is the k-time basis function of Berstein, which can be written as

Parametric design about blades
As an interactive modeling software for rotation machinery in ANSYS, BladeGen provides users with an intuitive and efficient design environment. In this article, third-order Bezier curve is selected to generate blade profile. In the design of the platform, different blade profiles can be obtained by adjusting the four control points or entering coordinates of the points. Table 1 and Figure 1 show the shape parameters describing the blade profile.
Shape parameters of blades.


Shape parameters for designing turbine blades.
As shown in Figure 2(a), there are four control points (P0, P1, P2, and P3) of third-order Bezier curve sculpting the blade shape. In theory, points P1 and P2 can be controlled arbitrarily. Owing to the constraint of leading edge and trailing edge angles, the four points should be determined based on theoretical arithmetic. It is assumed that four points (x0, y0), (x1, y1), (x2, y2), and (x3, y3) indicate P0, P1, P2, and P3, respectively, in the 2D coordinates. Wherein the maximum deflection position is mainly controlled by x1 and x2, and the maximum deflection value is determined by y1. From Figure 2, it can be inferred that x0 = y0 = y3 = 0 and x3 = 1. If the values of x1, x2, and

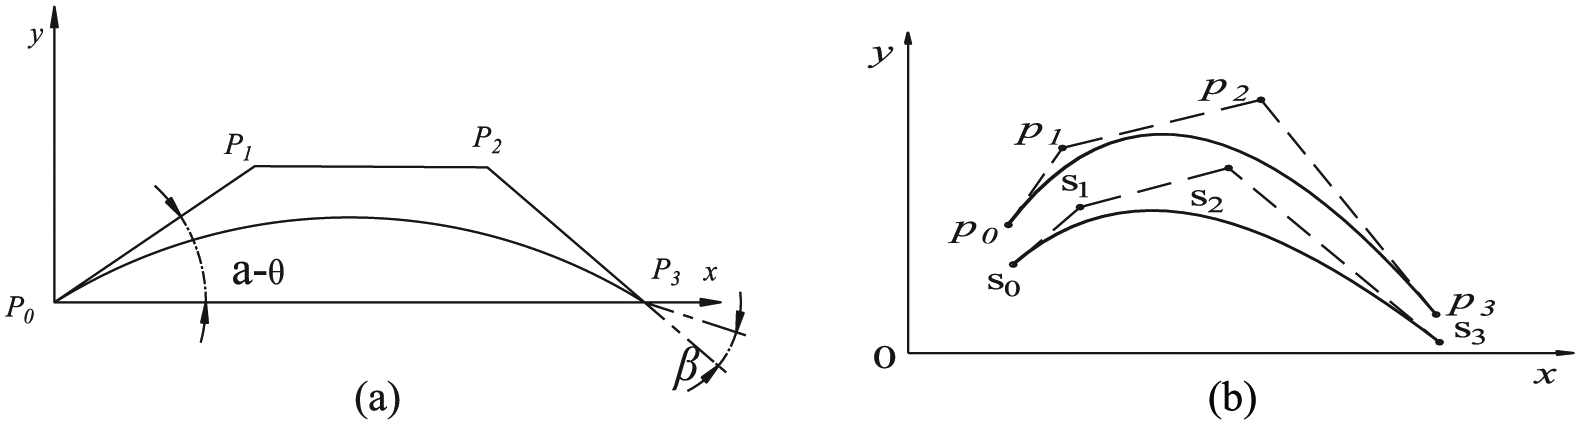
Control points and blade profile: (a) control points of mean camber and (b) control points of pressure and suction sides.
Thus, the mean camber line can be obtained

Accordingly, if the four control points of pressure side (p0, p1, p2, and p3) and suction side (s0, s1, s2, and s3) are determined, the expression of pressure side and suction side can be obtained in the same way. The 3D model of axial-type turbine blades designed by BladeGen is shown in Figure 3


Three-dimensional model of stator blades and rotor blades: (a) blades of the stator and (b) blades of the rotor.
Objective function definition
The main function of the turbine in turbodrill is to convert the hydraulic power into mechanical energy, and then the energy is conveyed to the bit by the shaft. The main performance parameters that determine the properties of turbine include torque, output power, pressure drop, and efficiency. When the turbine works under the rated condition, the loss of energy is minimum and the efficiency is maximum. In this article, the maximum turbine efficiency, which has a linear relation with torque and pressure drop, 13 is selected as the objective function, and the parameters of blade structure are selected as the independent variables. The objective function is

where η is the maximum turbine efficiency; Ni represents the output power described as Ni = nπMi/30, N = ΔPQ is the input power, Mi is the torque at maximum efficiency, Q is the flow rate at maximum efficiency, ΔP is the pressure drop defined as ΔP = P1 − P2, where P1 and P2 are the pressures of the inlet and outlet of the blades, respectively.
Under a certain operating condition, the performance of the turbine is mainly determined by the shape parameters of the blades including inlet structural angle (β1k), outlet structural angle (β2k), stagger angle (βm), leading wedge angle (φ1), trailing wedge angle (φ2), height of blades (b), and number of blades (z). Thus, it is necessary to select a good combination of blade parameters for optimum performance of the turbodrill.
Sensitive analysis of blade parameters
Multiple shape parameters determine different blade profiles, which have varying degrees of sensitivity to the performance of turbine. In this article, the single-factor design method is adopted to conduct the sensitive analysis of blade parameters.
Numerical model and governing equations
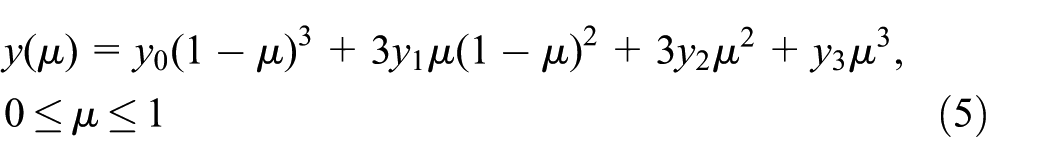
In order to reduce the difference between the fluid flow and the actual flow at the inlet and outlet for an approximate steady solution, specifically, the entrance and exit of the blade channel were extended to a distance twice the height of the blade upward and downward, respectively. 14 Then the shape data about the blades generated by BladeGen were imported into TurboGrid which can create high-quality hexahedral meshes for turbomachinery. In TurboGrid, the meshing measures have quality criteria reflected by mesh statistics. In order to improve the accuracy of meshing, it is essential to refine the grids in specific regions around the blades especially in inlet and outlet arcs. Besides, H-grid was selected as the mesh type in the inlet and outlet domains. After modified and improved, the 3D grids were gained with 782,720 nodes and 722,122 elements in all. Thus, the 3D grids of the turbine model embracing the global grid and flow passage grid across the blade are shown in Figure 4.
Grid of the turbine: (a) the global grid and (b) flow channel across the blade.
In the CFD simulations, the fluid is considered continuous and incompressible through the turbine, and it should follow mass conservation and momentum conservation theorem. For a certain operating condition, it is the incompressible drilling fluid, whose density is referred to as a constant. Thus, the mass conservation equation can be described as 15

On the other hand, combining with the


where Rij is the Reynolds stress tensor defined as below

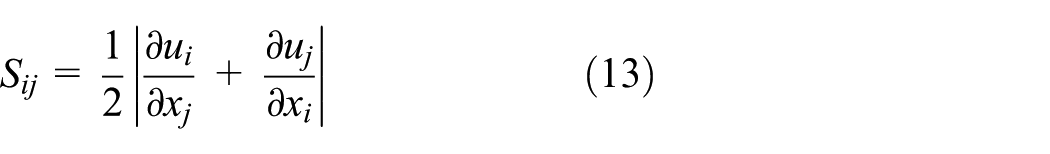
Here, µ i is the turbulent viscosity coefficient, K is the turbulent kinetic energy, and Sij is the mean rate of strain tensor
Boundary conditions
To improve the quality of simulation and ensure a unique solution, the single flow passage across the blade model was chosen as the simulation model for its periodicity and the boundary conditions can be described in Figure 4(b), including interface condition, inlet–outlet boundary, periodic boundary, and no-slip wall boundary conditions. Because of stationary of the stator and rotation of the rotor when turbine working, the interaction is generated. The type of interface produced was set as frozen rotor. And for all the CFD simulations of this article, it was achieved by specifying a mass flow rate at the inlet and a total pressure at the outlet. The inlet mass flow was set to 16.8 kg/s, and the pressure at the outlet was set to 1 atm. Because the blades distributing around the exterior were the same with equal pitch, the periodic boundaries of the stator and rotor were set as periodic. No-slip walls were specified for the domain walls including boundary of the stator blade and rotor blade.
Experimental verification
Figure 5 shows the structure of the turbine bench, which mainly consists of pumping device, loading device, the body of bench, automatic control, and data acquisition. In order to ensure a constant of the displacement of fluid, the closed-loop control system of the displacement in multistage centrifugal pump was adopted. And the magnetic powder brake was chosen as a loading device controlled by the computer automatically. Then automatic control was conducted by the closed-loop device including the flow measurement, adjustment, and execution part. Finally, the data acquisition and processing were accomplished by the computer and data processing software. To verify the reliability of the simulation model, the bench test of 10-stage turbines (Figure 6) was performed with water instead of drilling fluid at a certain flow rate and different speeds for the characteristic of torque M, pressure drop ΔP, and efficiency η, and the flow rate at the inlet was set to 16.8 L/s. Before test, the stators and rotors of the turbines were installed on the shaft and pressed tightly, as shown in Figure 7. Then the testing instruments should be preheated by electricity more than 15 min, and the turbines were started at a low speed to make the bearings running in for 15 min.

Diagram of turbine bench.

Testing bench of 10-stage turbines.

Stators and rotors tightly on the shaft.
In the simulations, the density of fluid was set to 1000 kg/m3 and dynamic viscosity to 8.899 × 10⁻⁴ N s/m2. As shown in Figure 8, comparisons between the results show that the simulation results correspond with the experimental results well on the whole, even though there are some differences between the results for the volume loss and mechanical loss existing in the experiment, 17 which indicates that the numerical model built above can be employed for the optimization of blades.

Simulation and experimental verification.
Sensitive analysis
In this article, the turbine tested on the turbine bench is taken as the primary turbine model TURBINEPre, and it is preferred to change the blade parameters of TURBINEPre as the reference turbine model TURBINERef, whose relevant parameters are set as follows: β1k = 110°, β2k = 33°, βm = 69.1°, φ1 = 20°, φ2 = 12°, b = 13 mm, and z = 26. Table 2 shows the schemes’ arrangement of sensitive analysis based on single-factor design method.
Sensitive analysis of blade variables.

Figures 9–11 show the comparisons of the performance for sensitive analysis of blade variables. From these figures, it can be seen that β1k and φ1 have little impact on the performance of turbine, showing that the value of the inlet structural angle and trailing wedge angle can be chosen in a wide range. And βm has a greater impact on the turbine performance. In low-speed region, the efficiency of the large stagger angle is higher than that of the small one of turbine. In contrast, the efficiency of the small stagger angle is higher in high-speed region. As a result, a reasonable stagger angle should be selected when designing blades. Furthermore, φ2, b, and z all have a great influence on turbine performance. Especially in high-speed region above 1500 r/min, the efficiency can be greatly improved by increasing b and z appropriately. It is concluded from Figure 10 that the pressure drop is decreased with the increase in β2k, whereas the torque generated is low, causing low efficiency. Consequently, a small inlet structural angle is fit for designing the blades.18,19
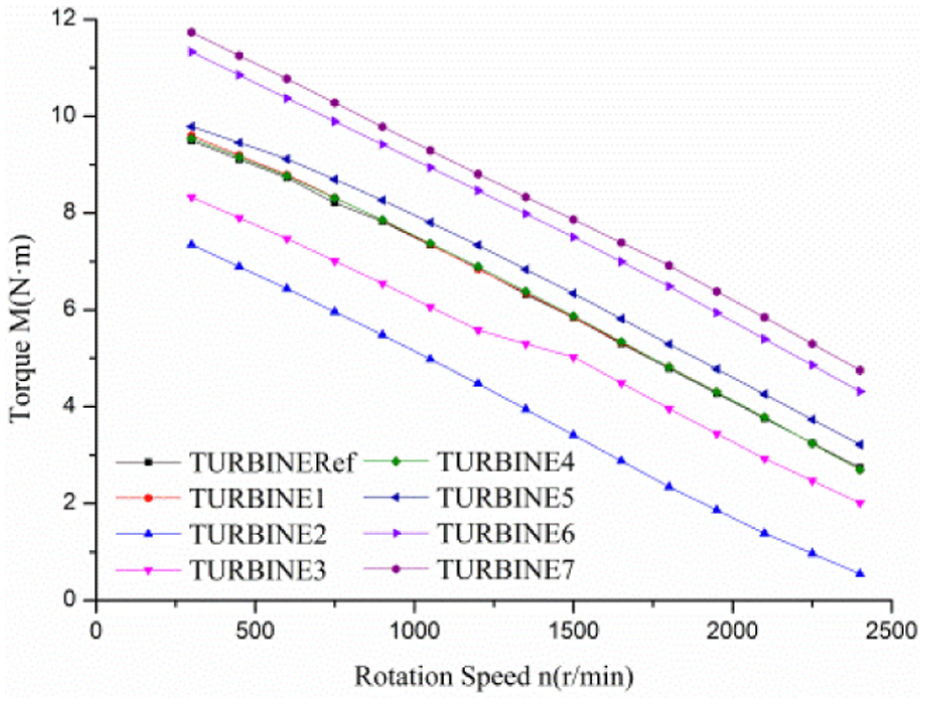
Comparisons of torque.

Comparisons of pressure drop.

Comparisons of efficiency.
From the above analysis results, we can draw a conclusion that β2k, φ2, βm, b, and z are the main controlling factors on the performance of turbine, and thus these parameters will be selected as the objects for the later design and analysis based on response surface method.
Response surface method for blade parameters
Design-expert software is developed by the United States for various multi-factor design and analysis, which contains the response surface design module possessing the main methods of Box–Behnken and central composite design.20,21 The relationship between factors and responses in the form of functions and intuitive graphs can be correctly and quickly presented. On the other hand, the calculation of the design process can be effectively reduced.
In order to conduct the parameter combination design of blades, the Box–Behnken method is adopted. On account of multiple factors of the blades and the characteristic of the method, five factors and three levels arranged in Table 3 are chosen.
Impact factors and level of Box–Behnken method.

According to the Box–Behnken design method, 46-group schemes in Table 4 were determined and the response of each scheme was gained by numerical calculation through CFD. Then Design-expert software was applied for the analysis of the response surface method to get the relationship between the objective function and the blade variables. Furthermore, a mathematical model of the relationship was established by using the least squares method. The regression equation in terms of actual factors of efficiency according to the results of response surface method in Table 5 can be obtained as follows

Levels of factors and corresponding results.

Analysis of confidence degree.

We can see from Table 5 that it provides statistics about confidence analysis of these factors, which indicates the different significances of various factors. From the variance inflation factor, it is reliable that the mathematical model was built well by quadratic polynomial, as a bigger value of the variance inflation factor indicates a larger significance. 22
Figure 12 shows the studentized residual of turbine efficiency, in which the residual points distribute almost in a straight line, which indicates that the mathematical model established in this article fits well. 23

Residual distribution of turbine efficiency.
The impacts of interaction between the parameters of the blades on the objective function are shown in Figures 13–20, and each contour in the figures indicates the gradient value of the objective function. As shown in Figures 13 and 14, when b and z are under middle level, β2k gets a great effect on the efficiency. Besides, the large value of objective function can be acquired within the range of β2k from 35° to 40°, at the low level of βm and φ2. It is inferred from Figures 15–17 that βm has an impact on efficiency to a great degree. From Figure 15, it can be deduced that the objective function is inclined to rise with the decline of βm and φ2. Figure 16 shows that when b is constant, it can achieve greater efficiency at a low level of βm. Figure 17 shows that the objective function, to a certain extent, is influenced by z and it tends to increase with the decrease in z when βm is at a lower level. Figure 18 shows that b has a greater influence on the efficiency than that of φ2, so a small blade height should be employed for designing. Finally, it can be seen from Figures 19 and 20 that when z is at a lower level, the efficiency becomes higher both at high and low levels of φ2 and b.

Impact of βm and β2k on efficiency.
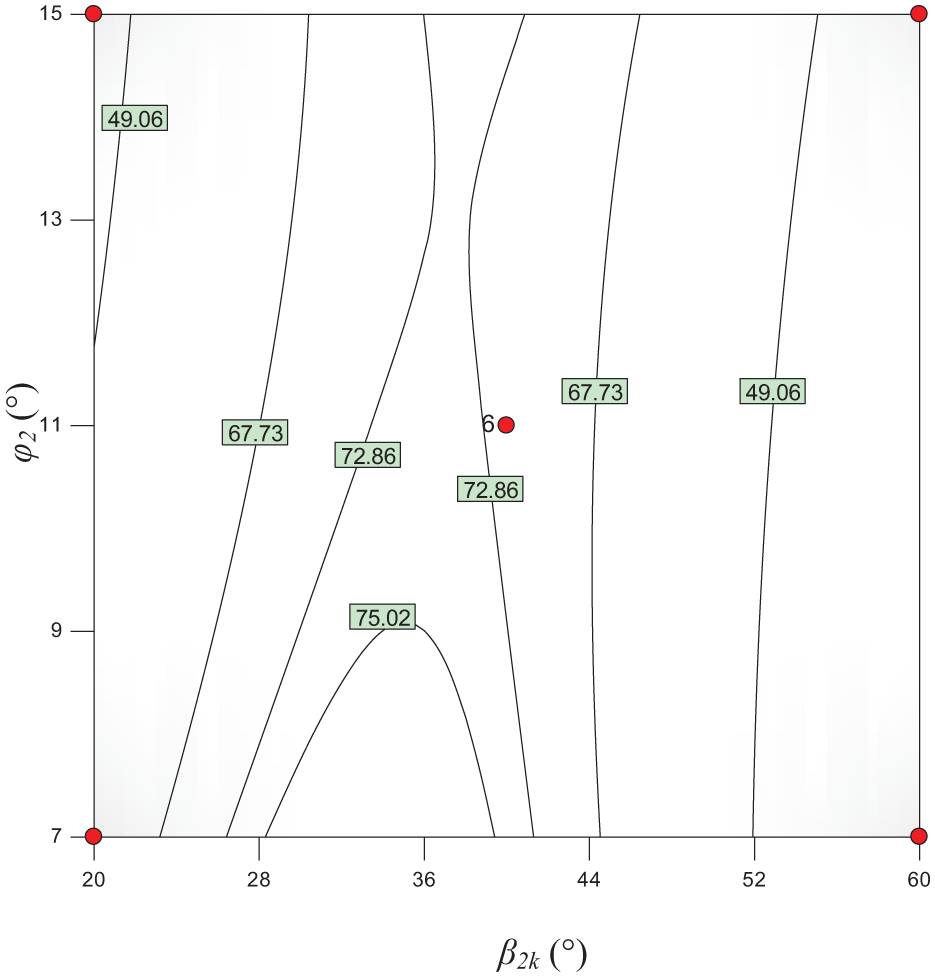
Impact of φ2 and β2k on efficiency.
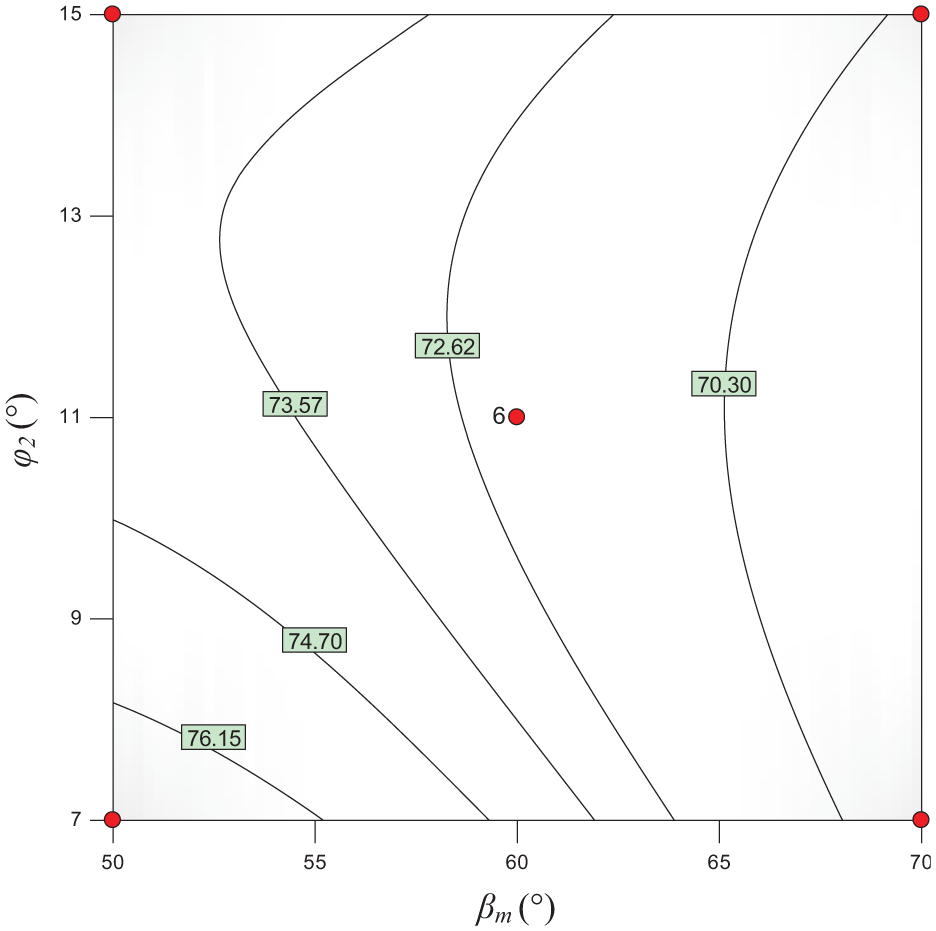
Impact of φ2 and βm on efficiency.

Impact of b and βm on efficiency.
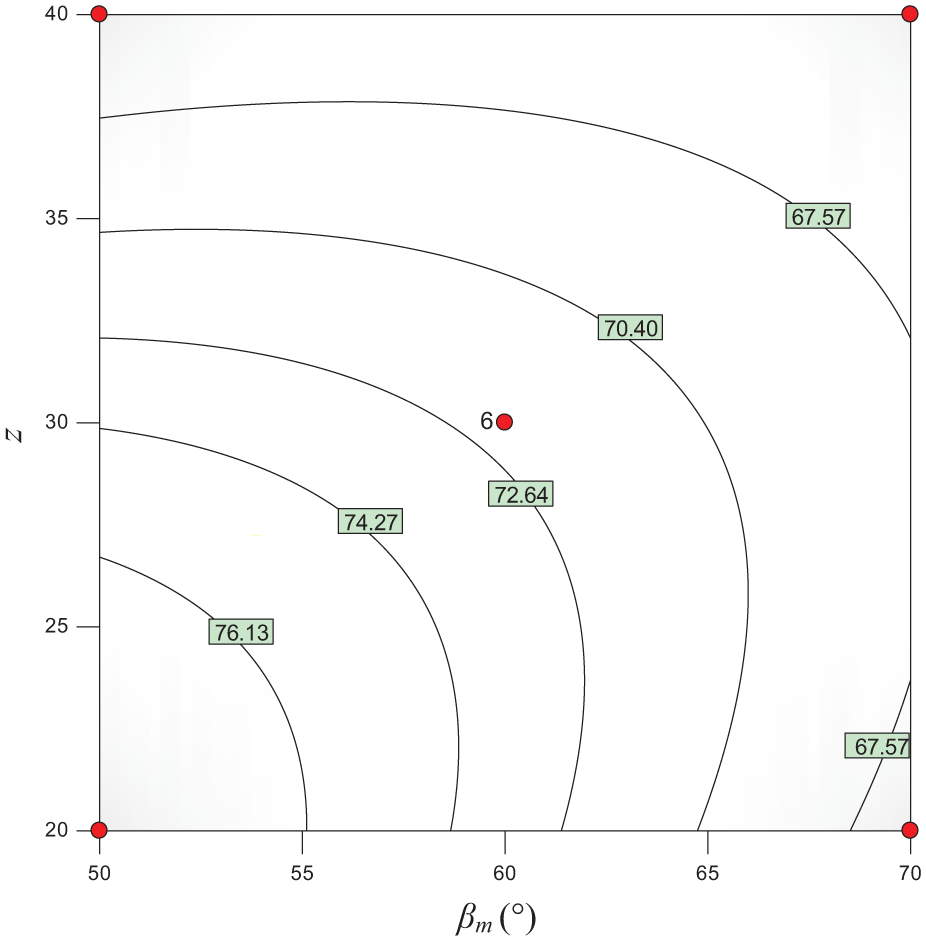
Impact of z and βm on efficiency.
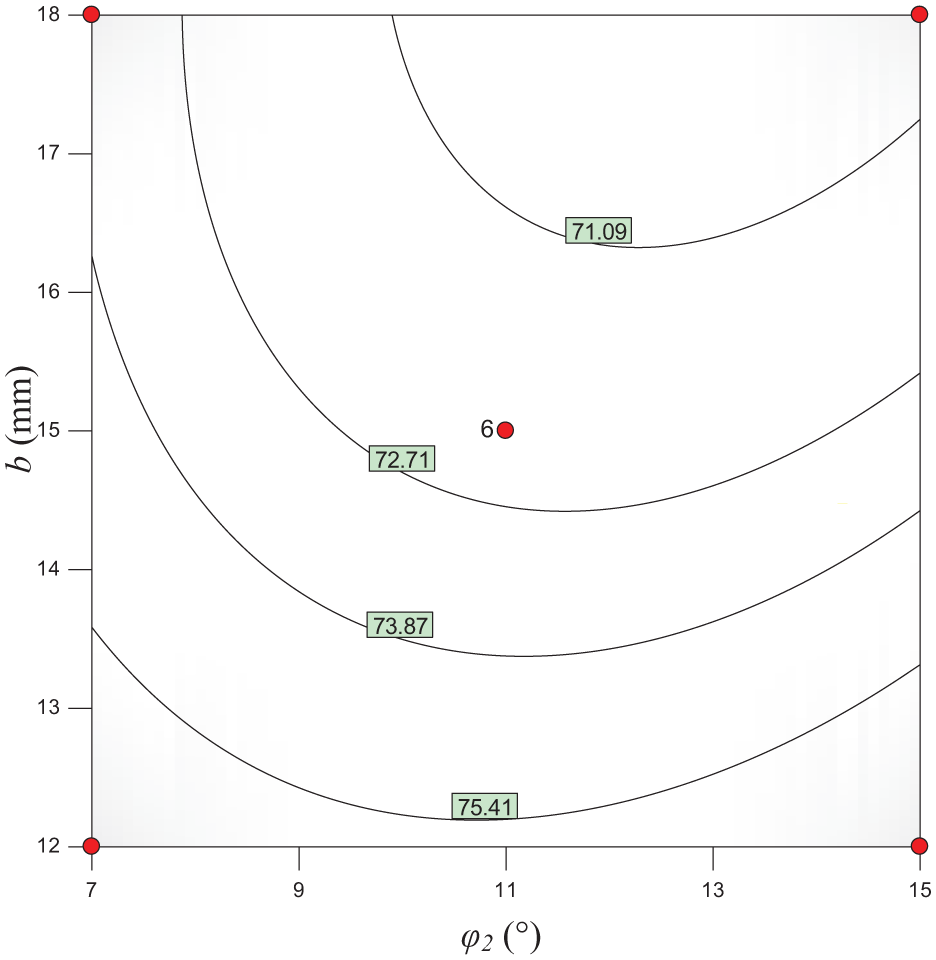
Impact of b and φ2 on efficiency.
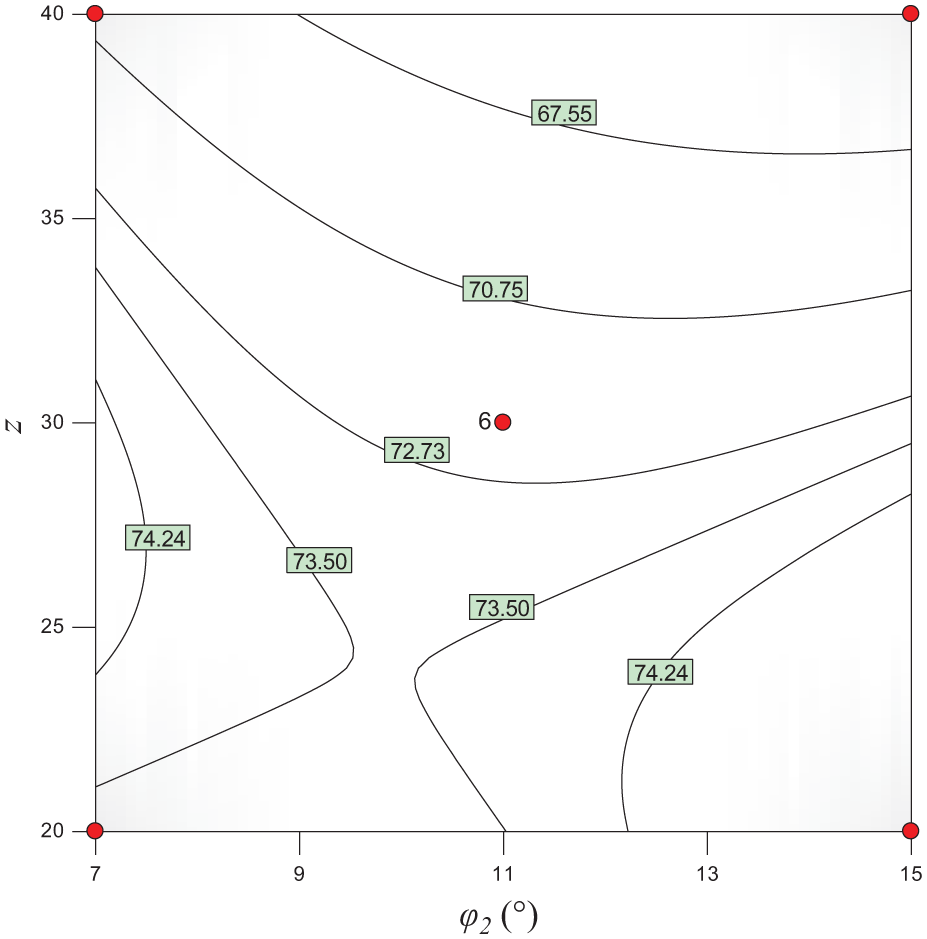
Impact of z and φ2 on efficiency.

Impact of z and b on efficiency.
Optimization and results
Groups of parameter combination schemes with higher efficiency were obtained by the Design-expert software for optimization of mathematical model of turbine efficiency, in which three groups were preferably selected. Then the optimization results obtained by response surface method were compared with the simulation results calculated by CFD in the same condition, as shown in Table 6.
Optimal parameters and result verification.

The comparisons between the optimization results obtained by response surface method and the simulation results calculated by CFD show that the relative error is less than 3%, which indicates that the mathematical model established in this article, relating to the objective function and the blade variables, is reliable. Furthermore, compared with the efficiency of the turbine TURBINERef model, fortunately, the efficiency can reach to 82.4123% by response surface method optimization under the same working condition, which gets an improvement of more than 10%. As a result, the response surface method can be applied to the optimization design of turbine blades for more effectively obtaining the optimal combination blade parameters and a higher efficiency.
Conclusion
The performance optimization of the turbodrill blades was carried out by using the response surface method in combination with the Box–Behnken design method. In the procedure, the relationship between efficiency and shape parameters of the turbodrill blades was established. Based on the CFD, 7 sets of sensitive analysis and 46 sets of response surface method design on the blade shape parameters were performed for the preferred parameter combinations, in which three typical groups were chosen for comparison with the simulation results. The conclusions obtained in the analysis were summarized as follows:
The 3D simulation model of the blades were built based on Bezier curve and turbosystem fluid mechanical software, and the experimental results verified the reliability of the simulation model, which laid a foundation for later study and design.
On the basis of the simulation results of CFD, seven sets of univariate sensitive analysis on the structural parameters were conducted. As a result, five significant factors of blades influencing efficiency were screened out, which included the outlet structural angle (β2k), the stagger angle (βm), trailing wedge angle (φ2), height of blade (b), and number of blades (z).
Based on the Box–Behnken design and response surface method, the mathematical model relating to the objective function and the blade variables and the regression equation of efficiency were exactly established for the optimum combinations of the parameters.
The optimization results based on response surface method were in good agreement with the simulation results of CFD, and the efficiency of the optimized turbine blades got an improvement of more than 10% than that of the primary turbine model. Thus, the optimization method developed in this article can be applied to the optimization design of the turbine blades for more effectively obtaining the optimal combination of the blade parameters and a higher efficiency.
Footnotes
Academic Editor: Hyung Hee Cho
Declaration of conflicting interests
The author(s) declared no potential conflicts of interest with respect to the research, authorship, and/or publication of this article.
Funding
The author(s) disclosed receipt of the following financial support for the research, authorship, and/or publication of this article: This work was supported financially by the Education Key Laboratory of Southwest Petroleum University (OGE201403-20).