
Abstract
There has been growing emphasis on quality measures and process analysis techniques that may be implemented in the daily practice of aviation refuelling to improve the overall quality of safety care. The quality assessment and process controls are most effective when used to determine the level of execution proficiency against the standard of aviation fuel quality control and handling. In this article, we have developed the quality assessment tools, control charts and new key indicator to prioritize the quality improvement that should be actionable and specific to guide process improvement efforts successively. Changing from a regular visual check to an automatic visual inspection tool, as well as from a pass/fail criteria to a satisfaction scale from 1 to 10 in the control, produces systematic data. Control charts are an effective way to separate a change in the process, so the user can focus on issues that are more likely to improve quality and safety. Our proposed quality assessment tools, process control and quality improvement prioritization were used to provide continuous feedback on the aviation refuelling service’s capability to exceed the standards.
Keywords
Introduction
Aviation fuel handling and quality control are considered critical procedures that require both safety and quality management from the refinery through to fuel transportation, delivering to the airport, storage, and finally delivery into the aircraft. Beside the human errors and equipment failures that may occur, the significant risks come from two primary sources: an unintended ignition of fuel vapour occurred by a single spark and fuel contamination during the delivery process and storage. The high risk of ignition of fuel vapour may result from spillage arising from human errors, process failure, poor quality fuel handling, depot leaks or aircraft tank venting of pressurized fuel couplings. The single spark to ignite the fuel vapour occurs from the discharge of electrostatic energy generated from the fuel movement in the aircraft tank during the fuelling process, as well as the electrostatic energy accumulation on the surface of the aircraft and refuelling truck. If the charge has sufficiently high potential, it can spark within the aircraft tank. Currently, the use of dissipater additives in the fuel and electrical bounding can eliminate this risk. However, incidents and accidents still occur, such as the accident of British Airways Boeing 777–200 in 2001 on the ground at Denver International Airport, USA. The refuelling coupling under pressure was the improper attachment, resulting in the single spark causing substantial damage and the death of the refuelling operator. 1
The fuel contamination can also affect the aircraft engines, and it may not be evident until the aircraft has been airborne. The potential sources of fuel contamination are particulates, 2 water, 3 other petroleum products 4 and microbial growth in the fuel.5,6 The main source of particulate contamination is rust and scale from the surfaces of fuel tanks and pipes which are made of steel or alloys. Another source comes from airborne solids entering the tanks through its seals of floating roof tanks, solids through from damaged hoses and filters, and from microbial infestation. Managing water contamination is critical and requires careful monitoring and filtering from the fuel. Some major examples of water contamination are as follows: 3
Low spots in a pipeline;
Rain water leaking past the seals in floating roof tanks;
Moist outside air entering the vents of fixed roof depots;
Airflow during refuelling operations can change the moisture content of air in contact with the fuel;
Water left behind after cleaning operations in tanks or transport vehicles due to poor personal procedures;
Changes in temperature of the fuel can increase the chance of water condensing out.
Other petroleum product contamination can occur when different types of fuels are stored in the same storage tanks. However, this case can lead to zero incidents if the fuel specification is fully checked before loading. Finally, the solids formed by microbial growth (i.e. bacteria and fungi) can block the fuel filter and some micro-organisms can generate acidic substances resulting in metal corrosion. There are three main methods for all contaminant detection and removal: filtering, water-absorbing media and clay treatment.
An example of an incident related to fuel contamination is a Cathay Pacific Airbus A330-300 route from Surabaya to Hong Kong had trouble in controlling engine thrust. One engine became unusable and a PAN and then a MAYDAY were declared prior to a successful landing at the destination with excessive speed, after gaining control of the thrust from the remaining engine. The problem was the salt water contamination of the hydrant fuel system at Surabaya. 7 Note that the fuel contamination can occur at various points in the fuel supply chain, from the refinery through to the storage at depot, and delivering fuel into the aircraft. 8
With these primary risks that can occur during the refuelling process, control of fuel quality at the airport becomes critical, and a quality assurance process is required to ensure that the refuelling service quality improves towards the zero-accident objective. It should be noted that the way the airport implements the quality practices can impact on the safety performance significantly, 9 such as aircraft fuel system failure prognosis, 10 fault diagnosis, 11 maintenance quality function deployment 12 and gap analysis with analytic network process. 13 Therefore, most airports have acquired both quality management system (QMS) and safety management system (SMS) programmes to identify the hazards associated with organizational factors, including human performance. QMS is generic and non-industry specific, while SMS is specially designed for fuelling system programmes, such as Joint Inspection Group (JIG) standard. 14 JIG standard focuses on fuel handling and quality control procedures through the quality control chain (see Figure 1). The individual control procedures are established at the refinery and are continued through transportation, storage at depot and refuelling into the aircraft. Even though the SMS and standards have been applied, incidents and accidents still remain that affect the significant loss of property and even death. As a result, an enhancement of service quality integrating to safety standards at airport towards better risk management and incident/accident prevention. 15
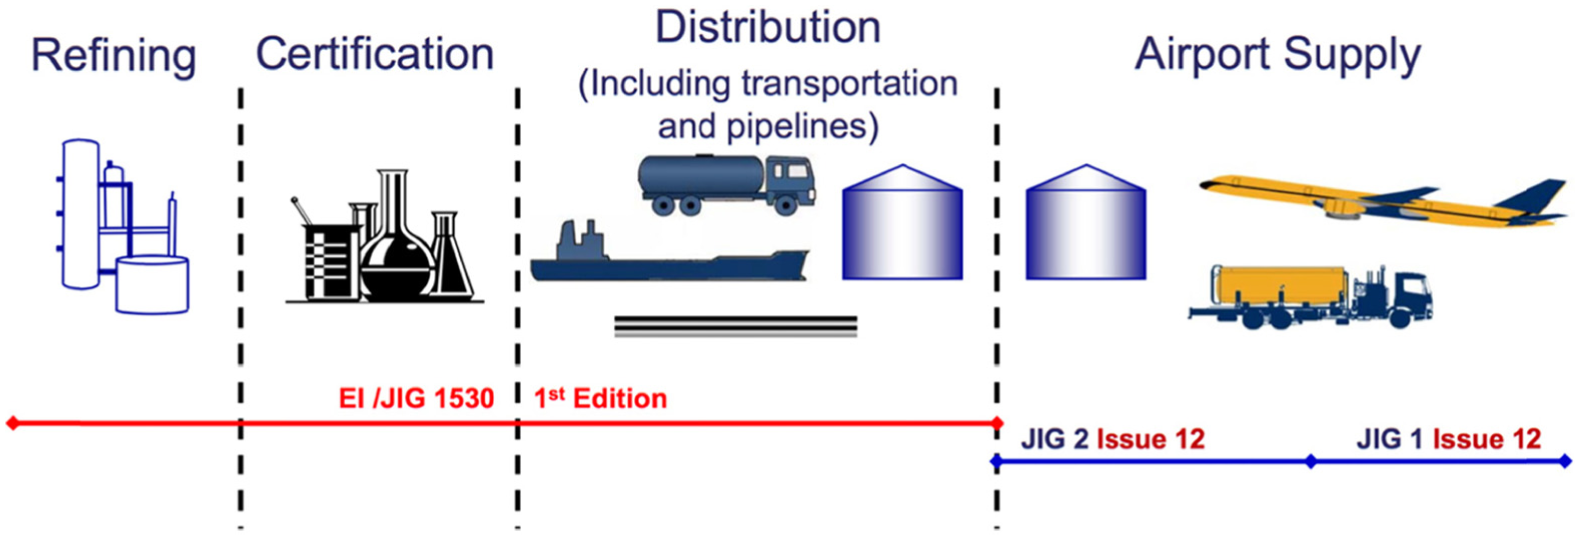
Overview of JIG standards mapped with aviation fuelling supply chain.
This article, however, aims primarily to develop the aviation refuelling quality assessment tools, process controls towards the quality improvement prioritization based on the JIG standard to improve aviation refuelling service and safety at the airport. The key weakness of applying safety standards alone is a lack of continuous quality improvement and identification of quality gaps for improvement. 16 Therefore, it is very important to ensure the refuelling process, equipment and people constantly improve in terms of quality. Based on our literature review, there is no publication focusing on quality improvement and prioritization on refuelling service at the airport.
Our proposed method will ensure the refuelling service quality is able to control the refuelling process towards the zero-accident objective. Additional goals of this research are to minimize the human errors that can occur during quality assessment, 17 by developing an in-house quality assessment software to generate the systematic quality assessment records and to monitor the process using statistical process control (SPC) techniques to identify the site-specific tolerance levels for the point-of-maintenance indicator. These tools will assist in refuelling operation to be more effective.
Aviation refuelling services at airport
The need of aviation safety standards with data-driven monitoring
Safety has had a significant impact in aviation operation, technology, development and innovation. 18 A study found that organizations have been focusing more on their staff’s safety responsibilities than on implementing an effective SMS and encouraging positive safety culture. 19 However, human error is considered as a primary cause in 70%–80% of all aviation incidents and accidents. The safety standards should recommend to incorporate error analysis during operation. 20 To minimize the human errors in safety management, systematic interventions or monitoring is recommended to address the interrelated process of safety programmes. 21 A further reduction of the accident rate in human errors will require investment in better support for error management, especially in better understanding of the nature and effectiveness of error detection mechanisms. 20 Therefore, relying on staff’s safety responsibilities alone may not be enough to achieve the safety goals in aviation, even though most of the errors can be detected based on routine checks.
Accidents are usually highly visible, and as a result, aviation has developed standardized methods of investigating, documenting and disseminating errors and their lessons. 22 Sarter et al. 20 suggested that aviation operation requires more effective feedback in support of data-driven monitoring rather than implementing the safety standard alone. For example, a quantitative model had been used for the assessment of the aviation risk generated from the fight safety management information system. 23 A hybrid multiple criteria decision-making model was developed and applied to address dependent relationships among criteria based on an analytical network process as a safety feedback. 24
JIG standards
The JIG standards for aviation fuel quality control and operating procedures consist of internationally agreed-upon procedures for handling aviation fuel at airports and upstream aviation fuel facilities. These standards have been approved from the international air transport association (IATA) and have been widely used in the airport in Thailand. The standards include recommended practices for fuel sampling and testing, depot, hydrant, and fuelling vehicle design features, and procedures for storage and delivery of aviation fuel to aircraft. Figure 1 (shown above) maps the JIG standards to the aviation fuel supply chain which is shown as follows:
EI/JIG standard 1530 defines quality assurance requirements for the manufacture, storage and distribution of aviation fuels to airports.
JIG 1 issue 12 is the aviation fuel quality control and operating standard for into-plane fuelling service. 25
JIG 2 issue 12 is the aviation fuel quality control and operating standard for airport depots and hydrants. 26
EI/JIG 1530 1st edition was exhibited on October 2013, and JIG 1 and 2 Issue 12 were exhibited on January 2016. In this article, JIG 1 and 2 Issue 12 has been focused for quality assessment tool development and process control; therefore, the discussion of JIG 1 and 2 is presented in this section. Both JIG 1 and 2 Standards contain three main parts: quality control, maintenance and accident/incident reporting. The shared goals of JIG standards include zero breakdown of fuelling and depot storage equipment, zero defects and zero accidents. The JIG standards are a comprehensive set of quality control and maintenance practices. Along with maintenance, JIG standards facilitate airport management with an emphasis on quality, safety and productivity, which results in an overall performance enhancement of fuelling services. JIG standards involve four main parties: fuelling operator or staff, internal and external inspectors, airport management and fuel suppliers.25,26
Beside JIG standards, there are aviation fuel safety standards available, such as:
Airline for American (A4A), as an operation and maintenance guidance manual; 27
NFPA 407 standards, for aircraft fuel servicing published by National Fire Protection Association, USA, focusing on safety operation and equipment maintenance for private aircraft; 28
CAAP 234 guidelines for aircraft fuel requirement used in Australia; 29
OISD standard-235 from India; 30
ASTM D1655 standard specification for aviation turbine fuels. 31
All standards share the same common focus of fuel handling, but differ in routine check period and techniques.
Monitoring aviation safety data through control charts
One of the quality management tools, or Six-Sigma, is SPC and has been potentially applied to analyse the aviation safety data.32,33 SPC is divided into two stages: collection of empirical training data to determine the control limits and then monitoring a process using control charts to detect whether data exceeds the control limits. 34 The control limits are set as the range within which the process is considered normal or in control. These control limits can be used as a warning indicator that a process may not be stable. The unstable process might not result in an accident or incident, but the warning warrants further investigation due to statistically abnormal deviation in aviation procedures. Moreover, the SPC technique can be applied to monitor a significant change in the process over time to identify the failure likelihood and its trend.
The control charts are a simple but effective means for monitoring multivariate observations. For example, the meaningful threshold system can be developed for multivariate aviation safety data for both regulating and monitoring purpose to evaluate the safety performance. If data fail to the defined threshold level, the assignment of appropriate corrective actions must be established to prevent the shift from incident to accident. SPC has been applied to measure aviation system’s safety performance based on the proactive measurement tool for assessing the safety performance. The main purpose of using SPC in aviation is to reduce any defects and variability from processes and objectives. 35 Therefore, integrating SPC into regular SMS will lead to a systematic approach in managing aviation quality that can be more beneficial to higher safety performance. 36
Ground-based safety and quality assessment for refuelling services at the airport
A quality assessment can be done by visual appearance tests, physical checks, fuel sampling for contamination checks (i.e. water, particulate and microbial tests), conductivity checks and product identification checks that are recommended in JIG standards. Sampling fuel for water detection, particulate detection, other petroleum products and microbial tests uses the visual appearance test that can vary from assessors and environments. The assessment form uses questionable or unsatisfactory results obtained from these simple tests. Figure 2 presents the sample of paper-based forms used in quality assurance in refuelling service at Thai airport. These forms were developed based on the recommendations from JIG standards.

Quality assessment form for water and dirt precautions certificate (left) and for aviation fuel station tank release record (right).
This quality assessment aims to focus on SMS programmes for identification of hazards associated with human performance, equipment and fuel quality prior to and during the refuelling service. This can be improved to integrate using quality assessment tools and process controls (SPC) to evaluate the service performance and quality of service. With our proposed quality assessment tools and process controls, the refuelling service quality can be maximized.
Proposed quality improvement prioritization and case study
Aviation refuelling service quality monitoring
In this research, the scope of service quality monitoring is within refuelling service airport; into-plane fuelling service (JIG 1 issue 12) and airport depots and hydrants (JIG 2 issue 12). Figure 3 presents the frequency of quality assessments, and measurement methods, on the refueller truck. There are four main measurement methods: visual check, control or physical check, conductivity check and microbiological growth test. Beside the daily check, the truck must be additionally checked prior to the service being provided. The sampling fuel must be collected to ensure it is water-free and has no contamination. In addition, Figure 4 shows the quality assessments through the process map from delivering fuel, storing and releasing to the refueller truck. There are microfilter and water filter separators before loading fuel into depots and water filter separators before releasing the fuel to the refueller truck.
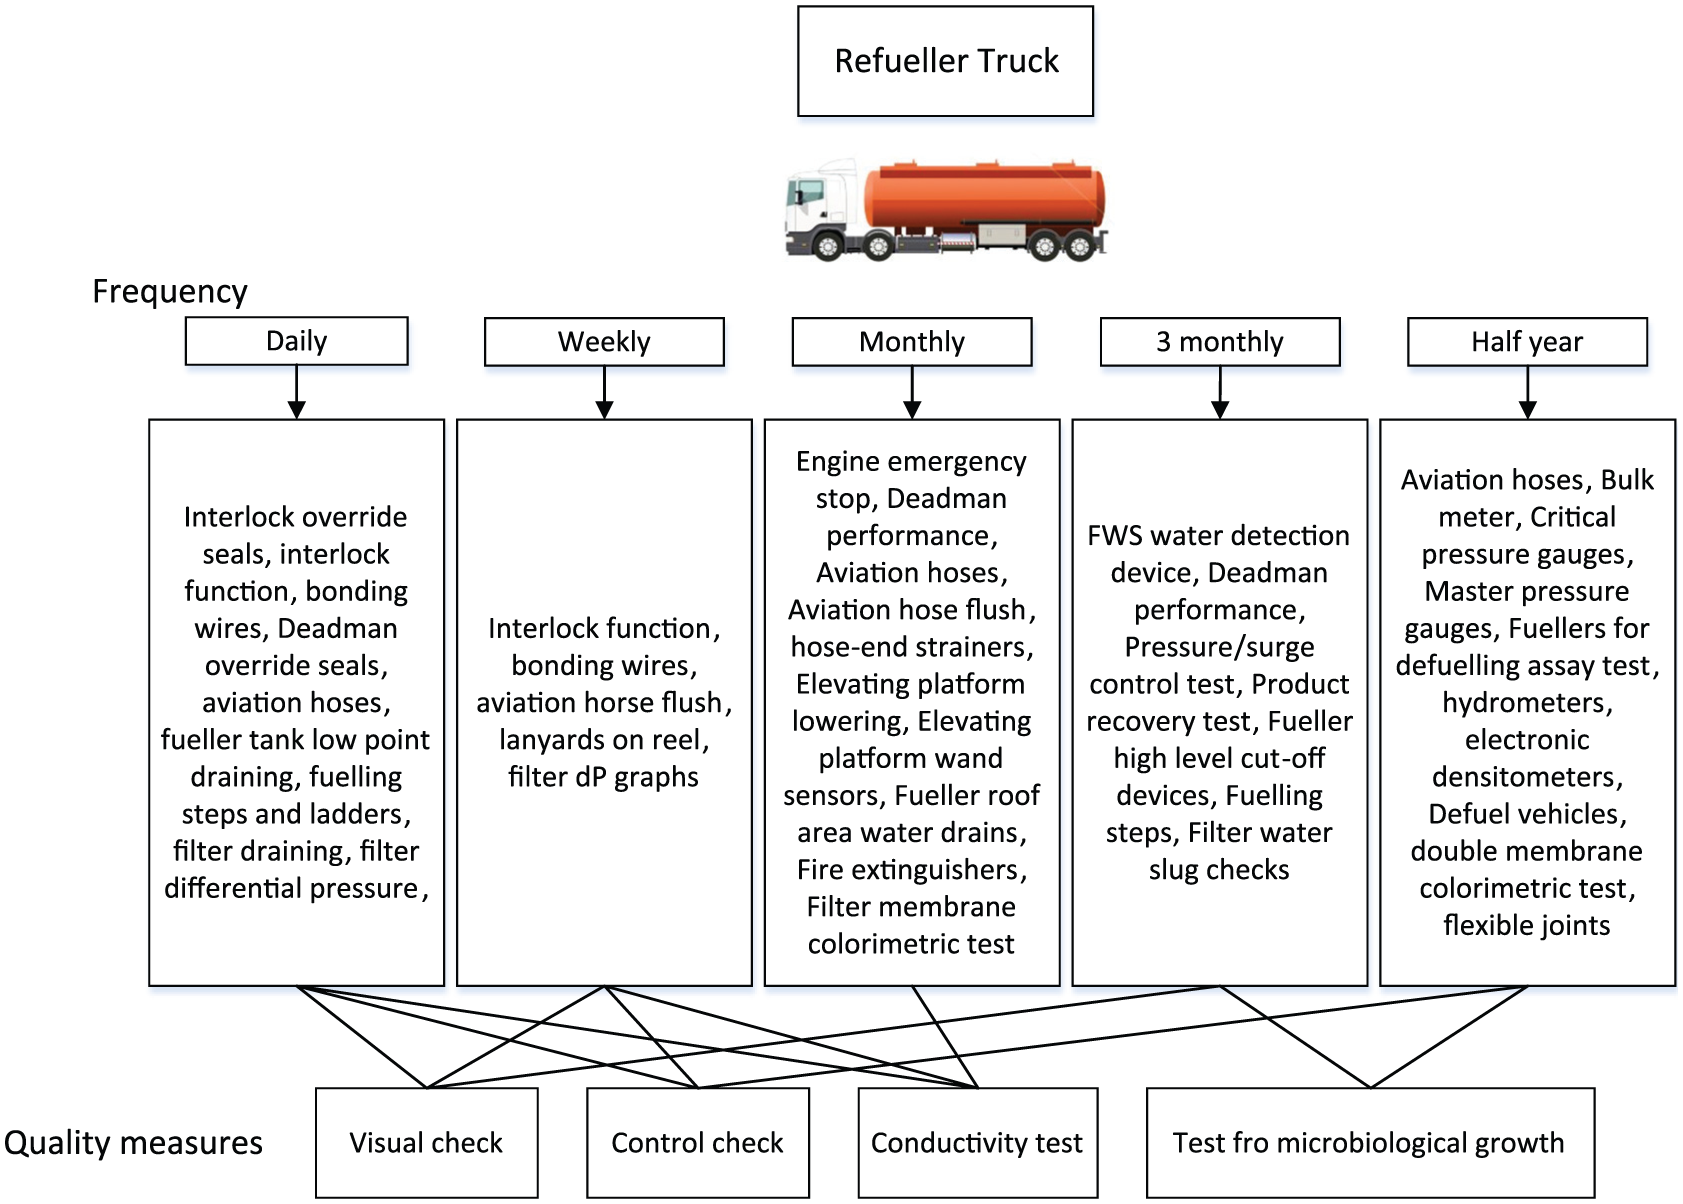
Quality monitoring on refueller truck.

Quality monitoring on depot.
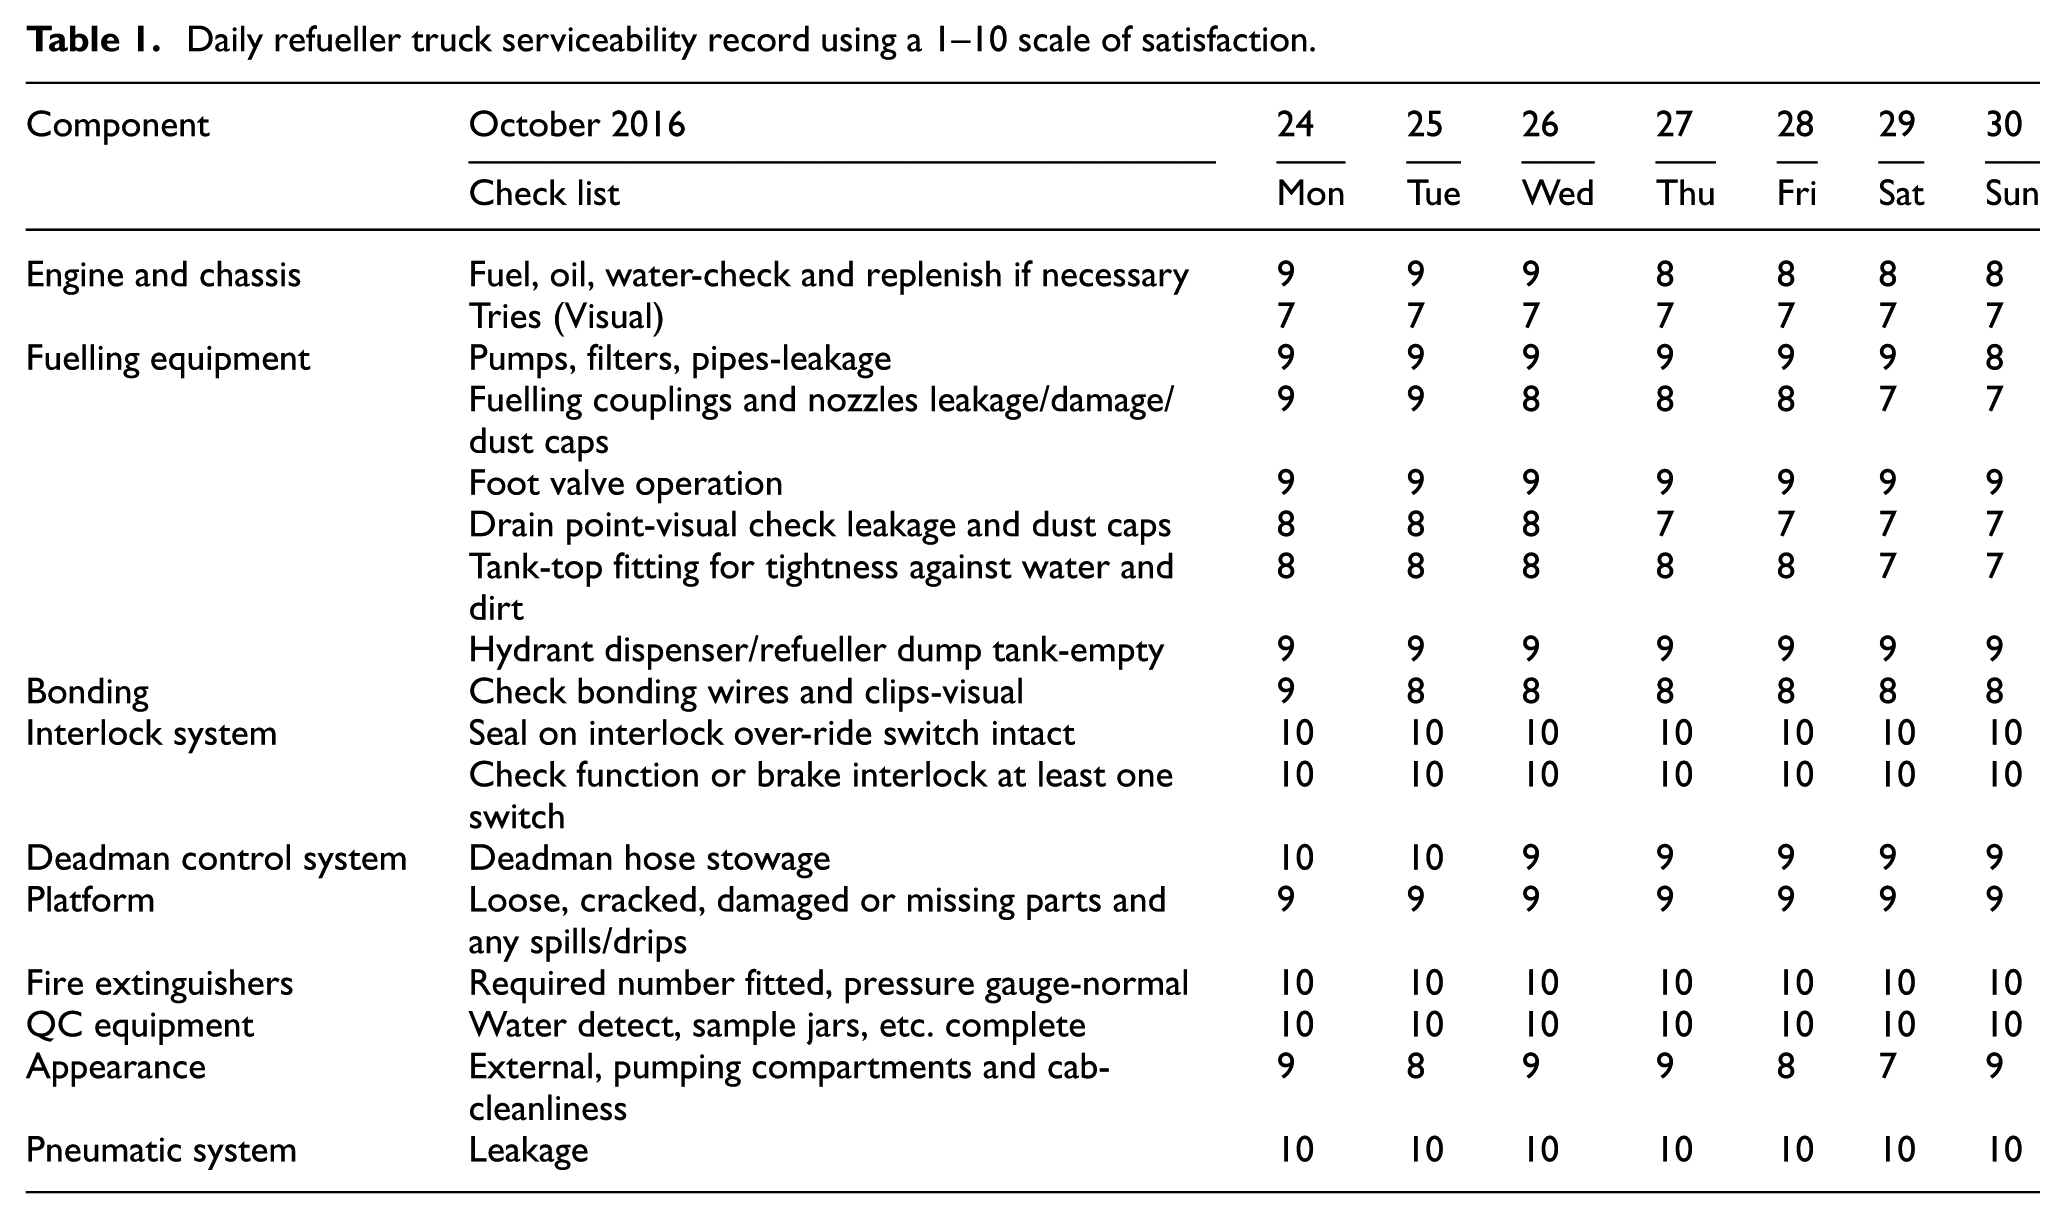
For our proposed method for quality assessment, we have developed an automatic visual inspection tool for the microbiological growth test and use a satisfaction scale (score 1–10) instead of pass/fail criteria (see Table 1). The data from the satisfaction scale, conductivity test and output of the automatic visual inspection tool are used to conduct the control charts to monitor the quality performance of the refuelling service. Moreover, the activity log is recorded to ensure the staffs’ activities meet the JIG standards. The output of the quality assessments and process controls is to establish a quality improvement priority (QIP) list. Figure 5 shows the workflow of our proposed quality assessment tool.
Daily refueller truck serviceability record using a 1–10 scale of satisfaction.
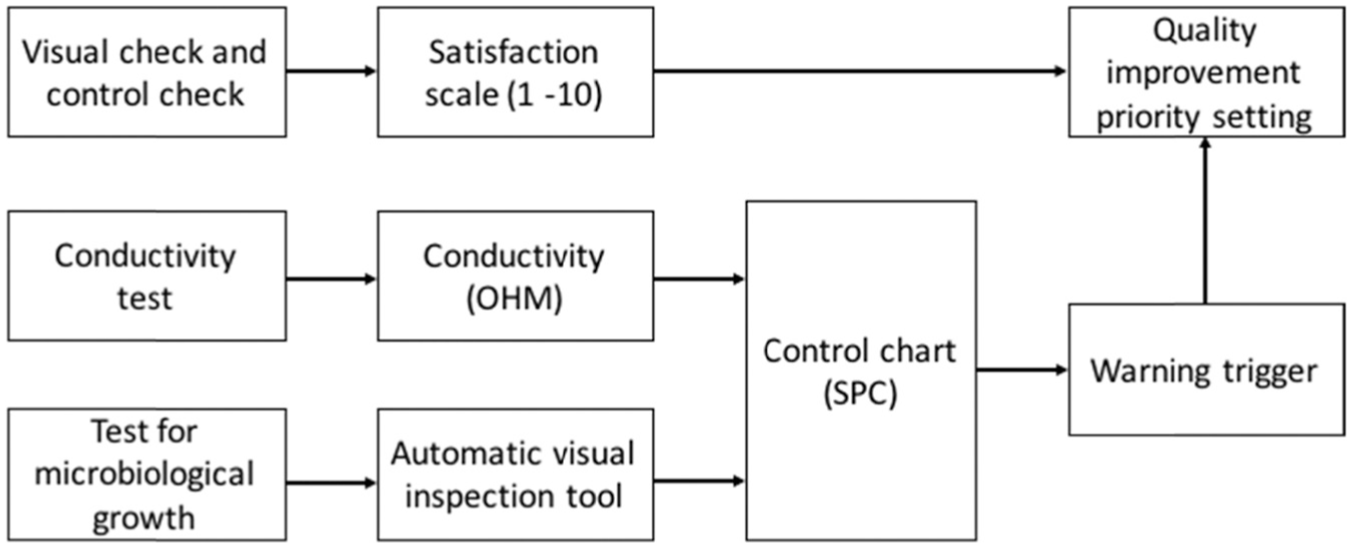
Proposed method of quality assessment and process control for refuelling service at airport.
Automatic visual inspection tool for microbiological growth assessment
In general, a routine monitoring of aviation fuels in supply and distribution facilities, airport depots and into-plane operations with MicrobMonitor2 (ECHA Microbiology, Cardiff, United Kingdom) are conducted. MicrobMonitor2 enables on-site or laboratory testing for microbial growth wherever any water accumulates in aviation fuel tanks and systems. The sample fuel of 0.5 mL is filled in the bottle, then shaken vigorously for 30 s and stored in a warm dark place at 25°C for 4 days with daily examination. To examine the test, the bottle is held against a light background and all the red purple colonies are counted. There are two categories of sample: category A are samples from vehicle tanks and category B are samples from the low point of the storage tank of the depot. There are three levels of data interpretation: acceptable (less than 2 and 5 colonies counted for categories A and B), moderate (2–10 and 5–50 colonies counted for categories A and B) and heavy (more than 10 and 50 colonies counted for categories A and B). This visual inspection measurement has potential disadvantages that rely on the assessor. Therefore, we developed an in-house software to automatically count the colonies and percentage of colony area and then display the data interpretation using MATLAB (MathWorks, Natick, MA, USA) shown in Figure 6. This software uses image processing techniques to automatically identify the red dots, contouring, and calculates the area of colonies in pixel 2 and then converts this to a percentage.
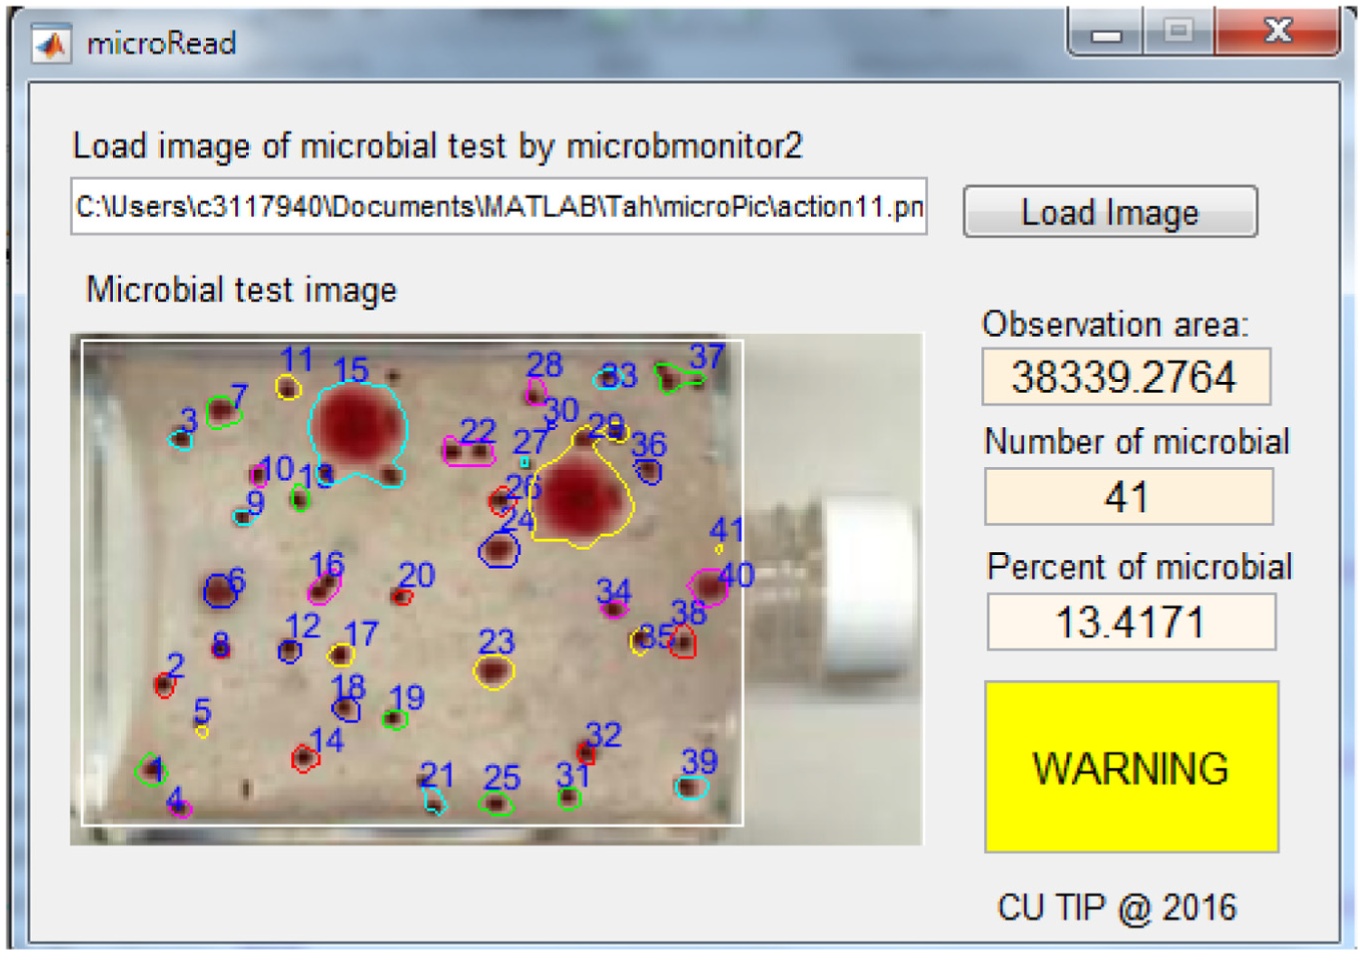
GUI for automatic visual inspection of microbiological growth; counting number of microbial spots and percentage of microbial in bottle.
SPC and process capability index
SPC requires prior data collection to determine the control limits. Setting appropriate control limits based on ‘good historical data’ can exclude acceptable variability and focuses the detection on errors such as high conductivity at the refueller truck and unaccepted levels of microbiological contamination at the refueller truck and depot. The data were collected for a month to conduct the upper control limit (UCL), the central line (CL) and lower control limit (LCL). There are five principle steps of implementing SPC:
Assessing conductivity tests and microbiological tests based on JIG standards. The assessors ensure the refueller and depot are regularly maintained.
Characterizing the distribution of the data and analyse the descriptive statistics and estimating an initial control limit.
Removing data outside the initial control limit due to any unnatural patterns.
Update the control limit for a moving range (MR) control chart (constructed from step 4) to detect the assignable variation. Our pilot study selected three refueller trucks and two depots have been applied for evaluating the refuelling service performance.
Process monitoring using SPC allows us to determine the process output (verification results) and process variability (dispersion of results) that will help to differentiate between normal and assignable (special) causes of variation. 37 The limits that are used to classify variation are set by calculating the mean, standard deviation and range of the set of process data collected when the process is under stable operation. Then, subsequent data can be compared to these limits to determine whether the new data fall within acceptable bounds and therefore whether the process is in control.
The control chart contains two statistical control limits: UCL and LCL. 38 In this study, an MR chart was used for the quality assessment in aviation refuelling service. In addition, MR control charts are designed to detect large and rapid drifts in a process and are recommended for quality assurance and control in aviation maintenance management. The statistical control limit for the MR control chart is defined as
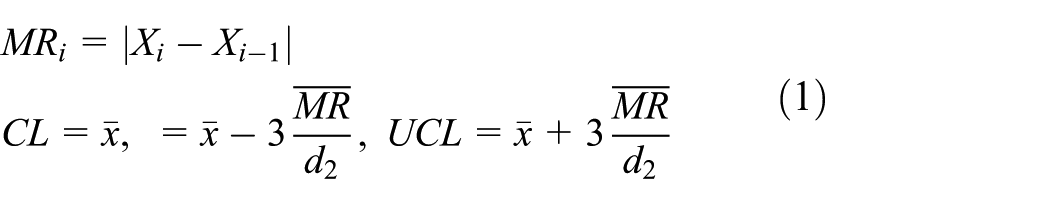
where X is the result of each conductivity test and microbiological test of each refueller truck and depot, and MR is the absolute difference between two consecutive tests. When two consecutive measurements are used to calculate the MR, d2 = 1.128. CL is the centre line defined as the mean. Moreover, the conductivity tests and microbiological tests must follow the guideline from JIG standards that defines the limits of an acceptable level of these tests. The defined range of tolerance levels are set as a lower specification limit (LSL) and upper specification limit (USL). Figure 7 presents the use of SPC for conductivity tests in refueller track number R22-1303, which contains two bounds.
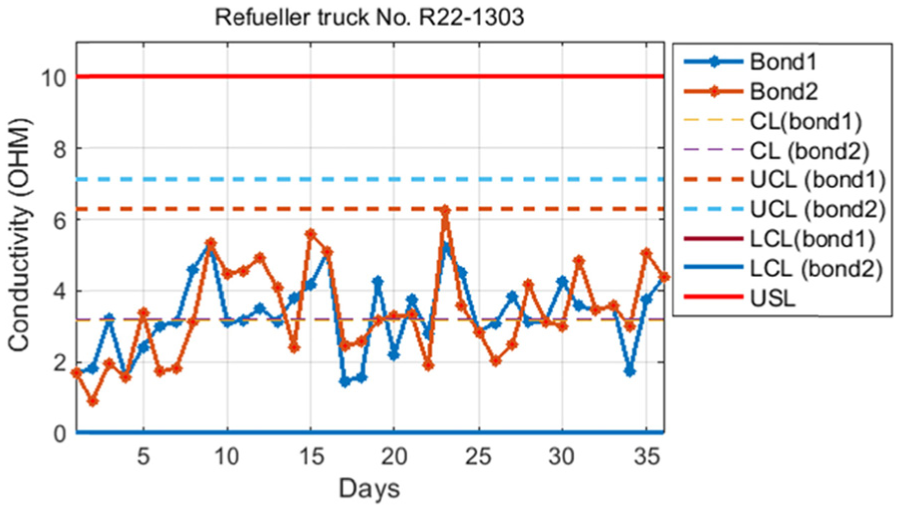
Example SPC of conductivity in refueller truck No. R22-1303 (daily measurement of 36 days), the specification conductivity should not exceed 10 ohm.
The MR control chart can be used to identify significant deviation at particular equipment based on the test observation. If the data exceeds either the UCL or LCL, the system alerts as a warning trigger to warrant further investigation on that equipment. Moreover, if the data exceeds either USL or LSL, immediate action must be taken to prevent the incidents and following accidents to occur.
Long-term quality evaluation can be analysed using a capability index (Cpk), which represents the ability of a process to produce data that is within the control limit. We monitored the aviation refuelling service for 3 months (September 2016–November 2016) with a total of 3216 services. The results were evaluated using Cpk (see Table 2). This long-term monitoring used separate data from the data that were used for the control limit calculation. The results of Cpk are able to assist the department to identify quality gaps required to improve the process, such as improved quality assurance best practice or introducing new and more effective equipment for providing the refuelling service. The process capability index is defined as follows

Long-term quality evaluation using process capability index.

QIP setting
A quality improvement is considered one of the most important stages that should be managed properly. However, the need for better management and control by giving a reasonable prioritization for quality improvement becomes essential based on how labour intensive and cost effective it is. 39 A combination between satisfaction scale (SS) and output of capability index (Cpk) is applied to set the QIP as shown in equation (3)
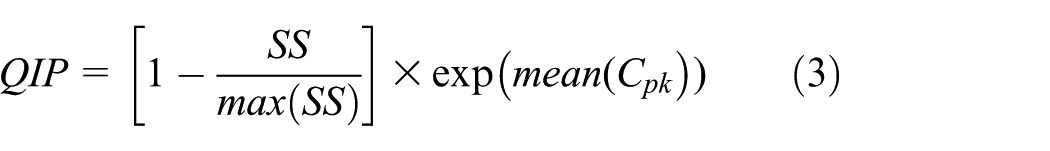
To set the priority order, all QIP calculations are sorted from largest number to smaller number. The larger number of QIP means higher improvement priority (see example in Table 3).
Example of quality improvement priority of refueller truck 1 (assessment by the end of November 2016).

To quantify the performance of the proposed QIP method against the traditional safety management using JIG standard alone, three randomly selected airports located in Thailand that have been implementing this method were investigated. The indicators of performance evaluation contain two key matrices: (1) number of incidents before and after the proposed method was implemented and (2) feedback from an internal auditor. These performance evaluations were assessed by the end of December 2016 (a month after refuelling quality improvement using our proposed method) after the airport improved their quality based on the recommendation from the QIP. The selected airports were picked due to different sizes and types of services, including domestic and international airport (Airport 1), local airport with military aircraft (Airport 2) and pilot training airport (Airport 3). The number of incidents before and after the QIP implementation was used for key performance evaluation of QIP.
It found that all airports reduced the number of incidents related to refuelling service after QIP was implemented on-site, with an average of 46.2% reduction. Airport 1 showed the highest incident reduction, with an incident reduction of 62.3%. This is due to the higher number of operators (and hence a smaller workload per operator) in Airport 1. The internal auditor’s feedback showed all airports have improved their refuelling quality after QIP implementation with scores of 3.8/5.0 on average. We can conclude from these performance evaluations that QIP can assist quality improvement in the refuelling service at the airport.
Research limitation and future direction
Even though the proposed QIP method has potential to reduce the number of incidents in refuelling services at airports (see Table 4), this work presents the limitation that it is dependent on other safety and quality management procedures acquired on-site. The aim of the proposed QIP is to integrate the JIG standard with other quality assessment tools; changing from Pass/Fail criteria to be a scaling from 1 to 10, applies SPC and control charts to monitor processes, process capability index to evaluate the long-term refuelling performance, replacing visual assessments with automatic assessments using image processing tools and prioritization for rearranging the opportunity for improvement. QIP alone cannot lead to zero incident in refuelling service at the airport. It should use alongside the SMS and the QMS. However, QIP is the measurement tool to identify the gap in accountable safety improvement in the process of refuelling. The quality audit and refuelling servicer will not miss signals of problems in safety and miss the opportunity for improvement. Therefore, integrating QIP with current safety standards and quality amendment systems would lead to the zero incident. Future studies can be taken into different aspects, such as using QIP for other industries such as medical services, 40 radiation oncology 41 and manufacture. 42 However, it needs to observe and identify the significant parameters for measuring the QIP. Moreover, the QIP can be integrated for optimizing the budget to maximize the resources and expected quality of refuelling service simultaneously.
Performance evaluation of refuelling quality improvement after our proposed QIP applied on-site and quality improvement based on internal auditor’s perspective for three airports.

Conclusion
In this article, we proposed the refuelling service quality assessment tools and process controls to determine the quality improvement priorities of service processes, equipment and facilities. This quality assessment method was developed based on the JIG 1 and 2 issue 12 standards as we focused on refuelling service at the airport. To compensate the issue of high uncertainty of visual check or assessment, the automatic visual inspection tool for microbiological growth test software was developed and implemented to ensure the accuracy of data interpretation from microbiological growth test kit. In addition, the pass/fail criteria for control check, using a satisfaction scale (1–10), was applied to identify the level of personal inspection satisfaction. The use of control charts can potentially assist the operators to identify the likelihood towards the incidents as an alert indicator. The combination of process capability index (Cpk) and satisfaction scale can be used to set the QIP in the refuelling process and equipment. This quality improvement prioritization can benefit to the preventative maintenance strategy and align with the QMS of ISO 9001:2015, which focuses on continuous quality improvement and risk-based thinking. 43 Note that with our proposed method, the aviation refuelling service quality can be maximized to achieve the zero-accident objective.
Footnotes
Academic Editor: Kuei Hu Chang
Declaration of conflicting interests
The author(s) declared no potential conflicts of interest with respect to the research, authorship, and/or publication of this article.
Funding
The author(s) disclosed receipt of the following financial support for the research, authorship, and/or publication of this article: This research was supported by the 90th Anniversary of Chulalongkorn University, Rachadapisek Sompote Fund.