
Abstract
This study proposes a three-stage framework for real-time crash likelihood and severity prediction. Firstly, a real-time crash likelihood prediction model was developed. Secondly, a real-time crash severity clustering model was proposed to cluster the crashes into different severity levels. Thirdly, a severity clustering validation model was developed to assess the performance of the proposed severity clustering model. Extensive data processing techniques were employed to collect real-time features from State Road 408 in Orlando, Florida, and a total of 6,750,072 events (625 crash events and 6,749,447 non-crash events) along with 24 real-time features were used. To develop the crash likelihood prediction model, nine machine-learning techniques were attempted, and the convolutional neural network model was found to provide the best result with respect to the sensitivity (0.916), false alarm rate (0.111), and area under the receiver operating characteristic curve (0.967). Davies–Bouldin index criteria were used to find the detector location that generated the most accurate traffic information to cluster the crashes into severity levels, and based on this traffic information, k-means clustering was applied to develop the severity clustering model. Finally, a severity clustering validation model was developed after investigating nine machine-learning techniques to validate the developed severity clustering model, and the decision tree model provided the best results based on three levels of sensitivity and specificity values. The developed framework has the potential to help traffic management centers to warn road users or develop transportation systems management and operations strategies in real time to avoid crashes or minimize the severity and, thus, can significantly contribute to improving road safety.
Crashes on roads have been a global problem for a long while, and this problem causes approximately 1.35 million deaths and 50 million injuries each year, thus placing a high socio-economic toll and heavy burden on health and economics around the world ( 1 – 5 ). These alarming statistics indicate the inefficiencies of reactive safety research, and thus urge researchers to explore proactive safety approaches to improve road safety. Accurate and reliable estimation and prediction of a crash before it occurs is the most challenging task in proactive safety research ( 6 ). The advancement of intelligent transportation system technologies enables researchers to obtain real-time traffic, events, weather, and other relevant parameter information related to crashes from different sources ( 7 , 8 ), and thus eases this challenge by paving the way to advance this road safety research direction.
The basic methodology to conduct crash likelihood prediction research is to collect real-time information from different sources, fuse them to assess their viability for crash likelihood prediction, and investigate the relationship among different contributing factors ( 9 – 12 ). Most of the literature on proactive road safety research has mainly focused on real-time crash prediction using statistical or machine-learning methods ( 6 , 13 , 14 ), finding the contributing factors, or assessing the relationship among these contributing factors. However, advanced research demands traffic management centers to inform road users about the possible crash likelihood and apply transportation systems management and operations (TSM&O) strategies based on the real-time crash severity level. There is also a need for a validation technique for this warning system to verify that the predicted crash severity level is accurate enough; otherwise, the TSM&O strategies might reduce the mobility, throughput, and overall efficiency of the network ( 15 , 16 ). These research gaps have motivated the authors to conduct this study. To minimize these gaps, the authors developed a real-time crash likelihood prediction and severity clustering framework to predict the crash likelihood, classify the crash events into different severity levels, and validate the classified crash severity level. The proposed methodology utilizes extensive data processing techniques and focuses on methods that are applicable in real time.
This research work first focused on developing a model to predict the crash likelihood using suitable machine-learning algorithms. Then it developed a severity clustering model to define different severity levels associated with each crash and predict the crash events to fall into a particular predefined severity level. Finally, a severity clustering validation model was developed to assess the performance of the proposed severity clustering model. This framework has the potential to guide the traffic management center and associated stakeholders to take appropriate actions to avoid any unnecessary crashes or minimize the level of crash severity in real time, and thus improve safety on roads.
Literature Review
Crash Likelihood
Numerous studies have been conducted to predict the likelihood of crash occurrences and identify crash events around the world. These studies encompassed both freeways and arterials considering the real-time parameters. The description of those studies, including the country/region, road type, year of the study, time period of the data considered in those studies, and key findings are summarized in Table 1. Table 1 indicates that those studies particularly developed and suggested different models for identifying crash and non-crash events (crash prediction models) under different scenarios, assessed the condition when the safety warning should be given, and proposed different variable selection methods. These studies also identified the key contributors or features in real-time crash prediction, investigated the relationship among different real-time parameters with crash occurrences, and compared the performances of different classification models. They also tried to identify traffic states during the crash condition, identified real-time crash characteristics under different time periods, that is, weekday and weekend, and developed time series dependency crash predictions models. These methods were all involved in developing a real-time crash prediction model. There were few attempts to develop a complete crash likelihood framework where it will simultaneously develop a crash prediction model in real time with high accuracy, classify the crashes based on different crash severity levels, and finally propose a severity clustering validation model to show the performance and accuracy of the developed crash severity model. One study that was conducted by Cheng et al. ( 17 ) attempted to propose a crash risk evaluation workflow through crash risk prediction, crash risk quantification, and crash risk classification. The study had several drawbacks, that is, only 2 weeks of data from six segments of an unknown Chinese road, 95 crashes, and a limited number of real-time parameters ( 17 ). Therefore, the current study is an attempt to minimize the gap by proposing a complete proactive crash likelihood prediction and crash severity clustering framework.
Key Details of the Real-Time Crash Likelihood Study
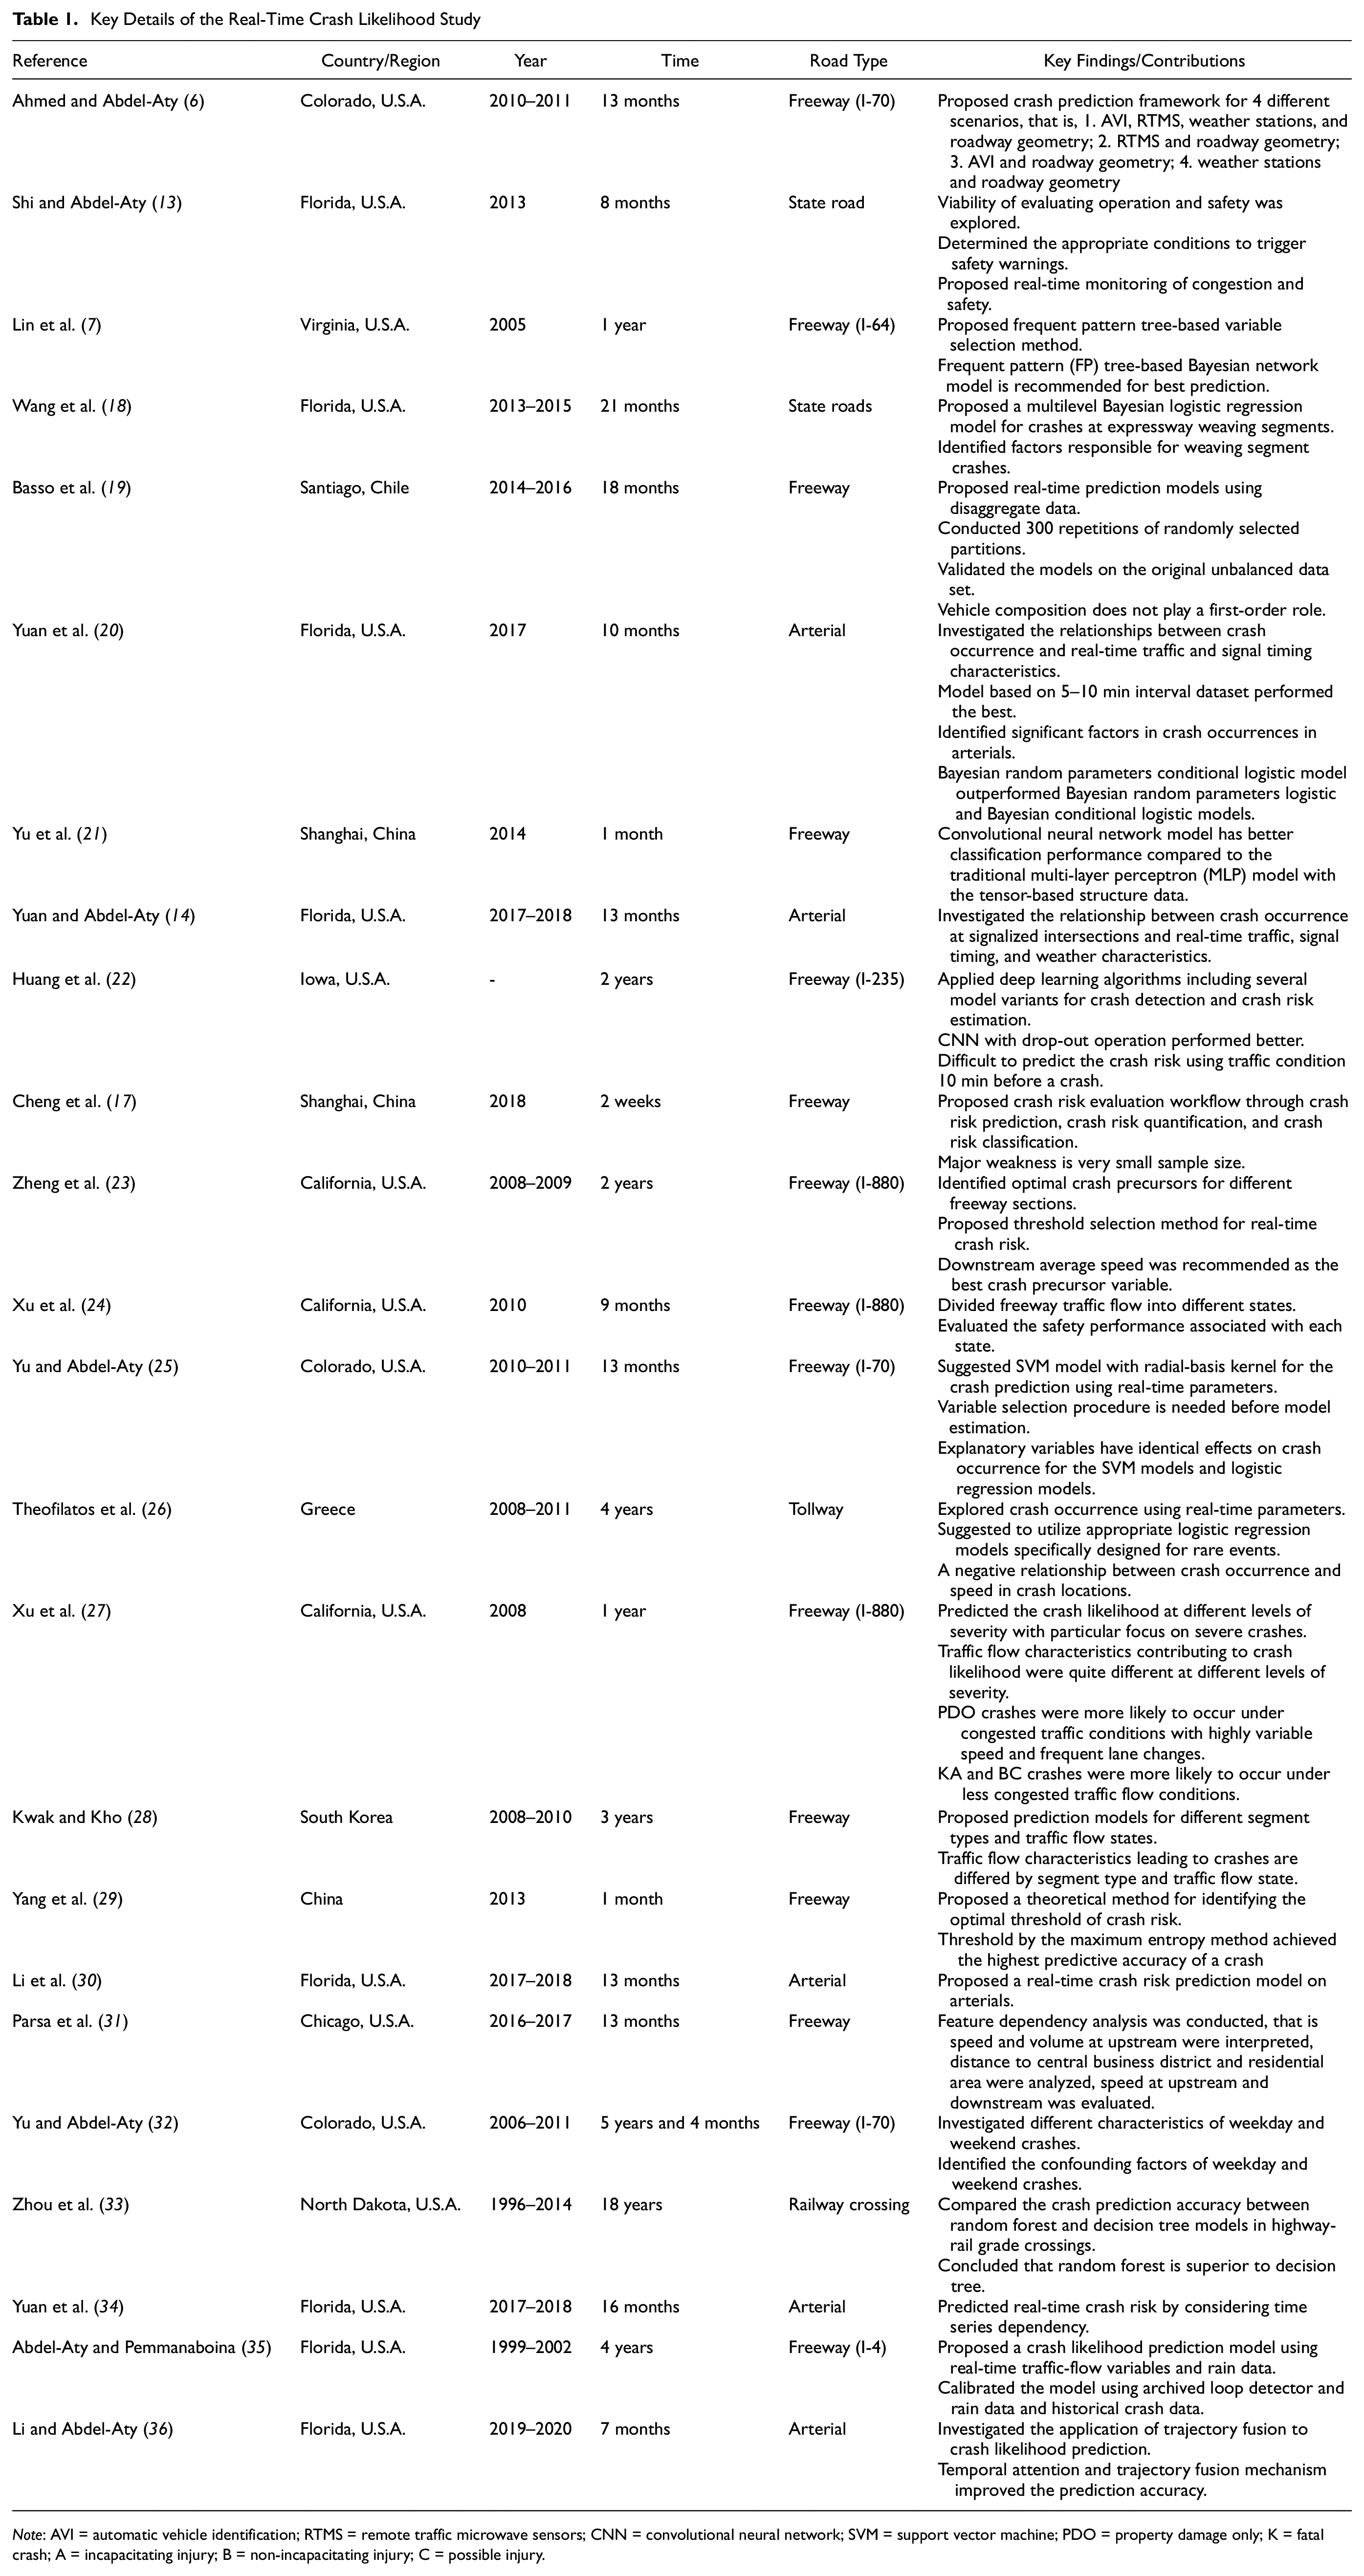
Note: AVI = automatic vehicle identification; RTMS = remote traffic microwave sensors; CNN = convolutional neural network; SVM = support vector machine; PDO = property damage only; K = fatal crash; A = incapacitating injury; B = non-incapacitating injury; C = possible injury.
Non-Crash Sample Selection
Because of the scarcity of crash-related traffic conditions compared to normal traffic conditions, crash-related traffic data suffers from a data imbalance problem. To solve this issue, previous researchers employed various resampling techniques. Most of the earlier studies selected/generated non-crash samples using the well-accepted 1:4 ( 6 ) crash:non-crash sample ratio to identify the crash events in real-time crash prediction models. A few studies used some other ratios, that is, 1:10 ( 18 ), 1:5 ( 37 ), and so on. However, there is a recent trend of generating non-crash samples using the synthetic minority over-sampling technique (SMOTE) ( 19 , 30 , 38 ). Since the SMOTE has the potential to improve the prediction accuracy of a real-time crash prediction model compared to earlier techniques ( 39 ), the current study used the SMOTE to generate non-crash samples.
Real-Time Traffic Parameter Duration Selection
Many of the earlier studies suggested that the 5–10 min traffic state before a crash is most suitable as a real-time crash precursor ( 23 , 34 , 36 ). However, many studies considered more periods, that is, 20 min ( 20 ) and 30 min ( 17 ), to explore which prior traffic state showed the most accurate performance as a real-time crash indicator. Moreover, most of these studies collected traffic information in around 30 s intervals and aggregated them to 5 min intervals to obtain the extended prior traffic state of a crash. Based on previous related work, this study uses the 5–10 min traffic data before a crash occurrence for the proposed crash likelihood framework.
Data Preprocessing and Feature Selection
Very few of the earlier proactive safety research used extensive data preprocessing and feature selection techniques. Common preprocessing techniques include removing unrealistic values, such as occupancy > 100, speed = 0 or speed > 100, flow > 25/30 s, and flow = 0 with speed > 0 ( 35 ). Some recent studies used the random forest ( 13 ), frequent pattern tree ( 7 ), k-nearest neighbor ( 7 ), graphical analysis ( 19 ), Pearson correlation ( 30 ), variable importance ( 6 ), classification and regression tree ( 25 ), Shapley additive explanation ( 31 ), principal component analysis ( 35 ), scree plot ( 35 ), conditional logistic regression (LR) ( 28 ), and extra-tree classifier ( 30 ) for preprocessing the real-time features and selecting the final important features for the models. This study used systematic and extensive data processing techniques to achieve the objectives.
Crash Prediction Models
To predict the real-time crash likelihood, investigate the relationship among different features, and separate crash events from non-crash events, different statistical or machine-learning models have been used so far. Table 2 summarizes the models previously used for predicting real-time crashes. From Table 2, it is evident that machine-learning techniques outperformed statistical techniques with respect to accuracy. The study tried nine machine-learning techniques that are popular for the classification problem and were recommended in the earlier literature for real-time crash likelihood prediction (10, 21, 25, 31, 40–49) and proposed the most suitable one based on the model evaluation measures used in the current study.
Crash Prediction Models
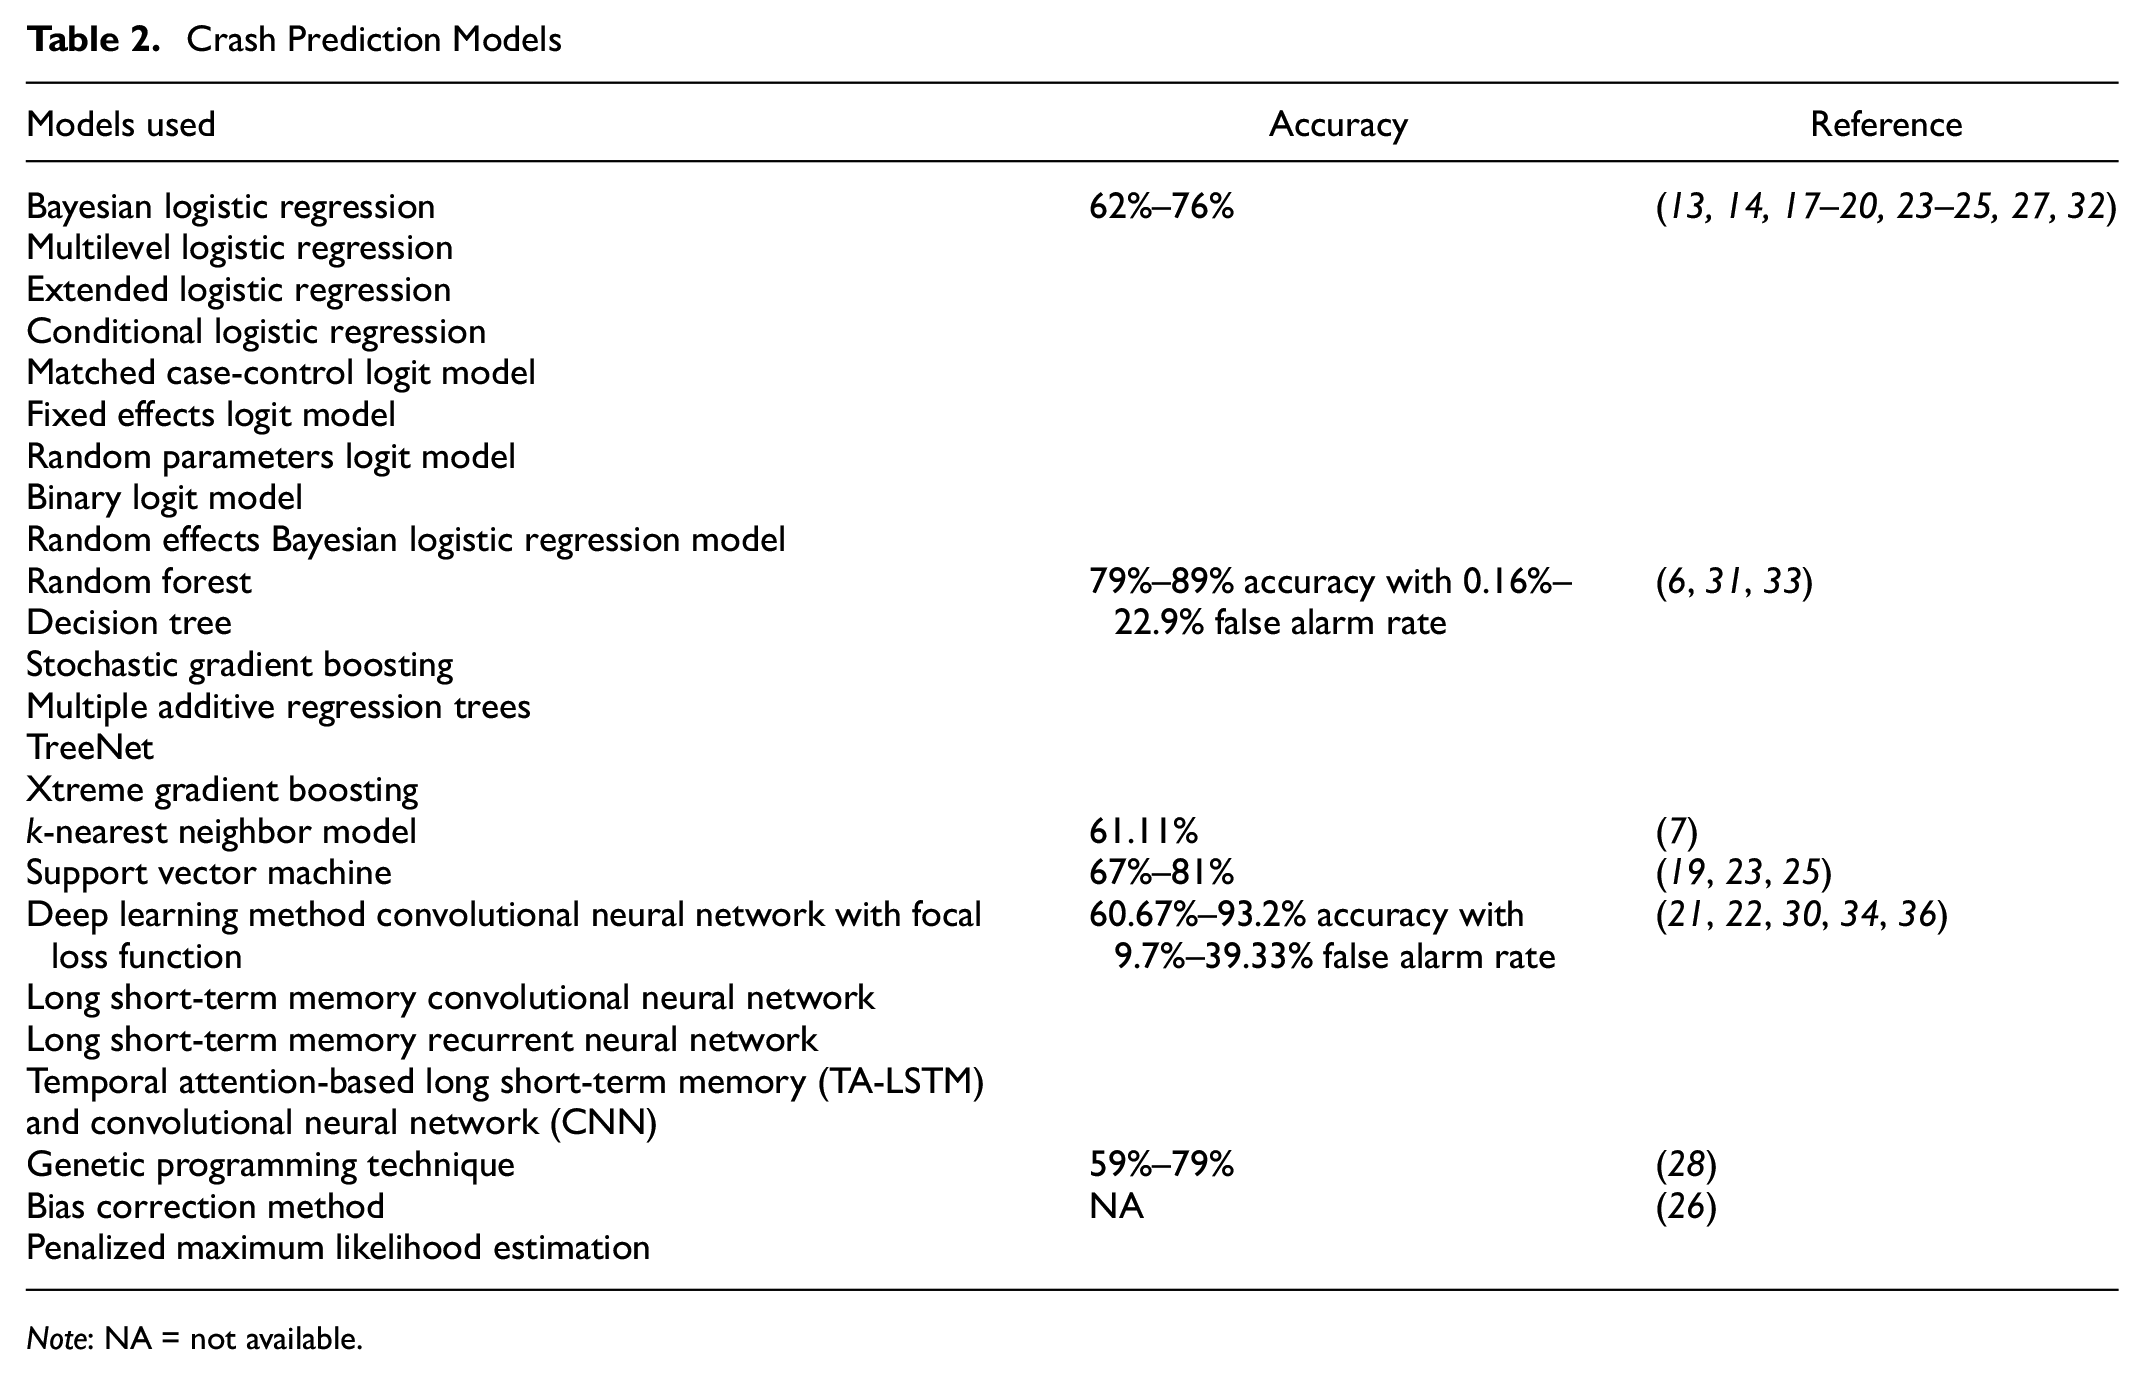
Note: NA = not available.
Nine machine-learning techniques that were used in the current study as crash prediction model are extreme gradient boosting (XGBoosting) ( 31 ), the artificial neural network ( 40 , 41 ), the random forest ( 42 ), LR ( 10 , 43 ) k-nearest neighbors ( 44 ), the decision tree (DT) ( 45 ), naive Bayes ( 41 , 46 ), gradient boosting (GB) ( 47 ), and the convolutional neural network (CNN) ( 21 , 48 ). As the current study focused on developing a three-stage framework for real-time crash likelihood and severity prediction, we recommend readers to go through the cited articles to learn the theoretical aspects of the used machine-learning algorithms.
Crash Severity Clustering
So far, k-means clustering is the only used method to classify crash likelihood severity in the literature ( 17 , 24 ). The current study attempted this method to cluster the crashes into different severity levels in real time, given a crash is likely to occur.
Severity Clustering Validation
k-means clustering is an unsupervised machine-learning technique that relies on distance functions to group datapoints together. This entails that the data used for training the clustering model does not have a concrete label and is thus difficult to validate. To the best of the knowledge of the authors, this is the first attempt to develop a severity clustering validation model to predict that a particular crash will fall into the classified crash severity levels. The study examined nine machine-learning techniques and finally proposed the best one based on performance measures.
Proposed Contributions
The study developed a real-time crash likelihood prediction and crash severity clustering framework. The proposed framework predicts crash likelihood in real time with high accuracy, classifies the crashes into different severity levels, and validates the generated severity classes to confirm the accuracy of the developed crash severity clustering model.
Methodology
Study Area
To achieve the objective of this study, a 21.4 mi segment in each direction of State Road 408 (SR-408) was selected. The purpose of selecting this road was that it is one of the major expressways for commuter travel in the downtown area of Orlando, Florida ( 38 , 50 ). Another reason to select this was its availability of real-time data sources. In particular, this road has 110 microwave vehicle detection systems (MVDSs), which are spaced around 0.5 mi apart. These MVDSs provide the speed, volume, and lane occupancy information for each lane in real time ( 51 ). SR-408 passes through major population centers and generates a reliable source of real-time information, perfectly serving the purpose of this study.
Data Preparation
Firstly, the crash data for the year 2017 was collected from Signal Four Analytics (S4A) and State Safety Office Geographic Information System (SSOGIS) on SR-408. The reason for using two crash data sources was to extract the most accurate and complete information with respect to the crashes that occurred within the study period. Then the traffic data was collected mainly from the MVDSs.
After initial data collection from the sources, a basemap was prepared for processing all the crash data. To match detector and crash data to the corresponding segments, The National Performance Management Research Data Set (NPMRDS) map was utilized as a primary route shape file. The NPMRDS map follows the Traffic Message Channel (TMC) standard to identify unique segments. Initially, the routes were divided into sub-segments using the TMC standard. However, with the TMC standard, some segments had multiple detectors in a single segment. Therefore, to measure the traffic features that can present the condition of a segment by using data from adjacent detectors, this study separated each segment based on the location of the detectors. Through basemap processing, detector data and crash data can be matched to each road segment. After preparing the basemap, traffic features, that is, speed, volume, and occupancy, were extracted from the detector information. The deployed MVDS traffic detectors update traffic features every 30 s. These 30 s data were aggregated over 5 min and 5–10 min before crash data was collected ( 9 , 10 ) from the two upstream (u/s) and two downstream (d/s) detectors for each crash, as shown in Figure 1.
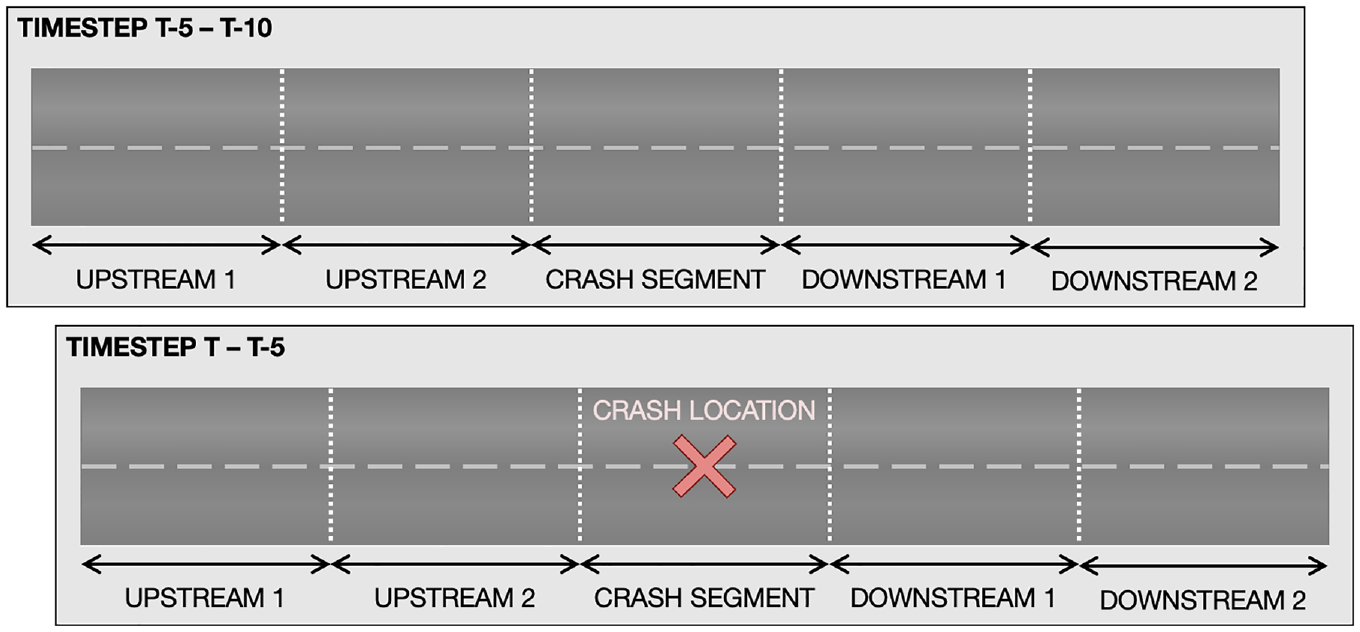
Data extraction from detectors.
To develop a classification model, we need to distinguish between crash and non-crash events; therefore, we need non-crash samples to train the prediction model. To extract the non-crash events, the SMOTE was used as suggested by the literature ( 38 , 52 , 53 ). After collecting all the required features, major data preprocessing was done following the methodology as shown in Figure 2. Firstly, the traffic data were imported and merged for each crash and non-crash events. Next, some new traffic features, that is, the average, standard deviation (SD), and coefficient of variation (CV), of the speed and volume were generated. The CV is defined as the ratio of the SD to the average and indicates the relative variation among traffic parameters ( 28 ). Moreover, the differences in speed (DS) between the inner and outer lanes for each detector position were calculated and added to the feature list. In addition, the congestion index (CI), a measure to reflect the congestion intensity ( 50 ), was also calculated and added to the feature list. A detector location file was subsequently created and used to filter all the data that did not have any detectors within 2 mi from the crash location. Then, the unreasonable detector values were removed, and rigorous cleaning was performed, that is, 6 h before and after events, the data of a crash were removed to avoid unstable traffic state information ( 8 ). Finally, all the processed data were merged and prepared to be used for the models.
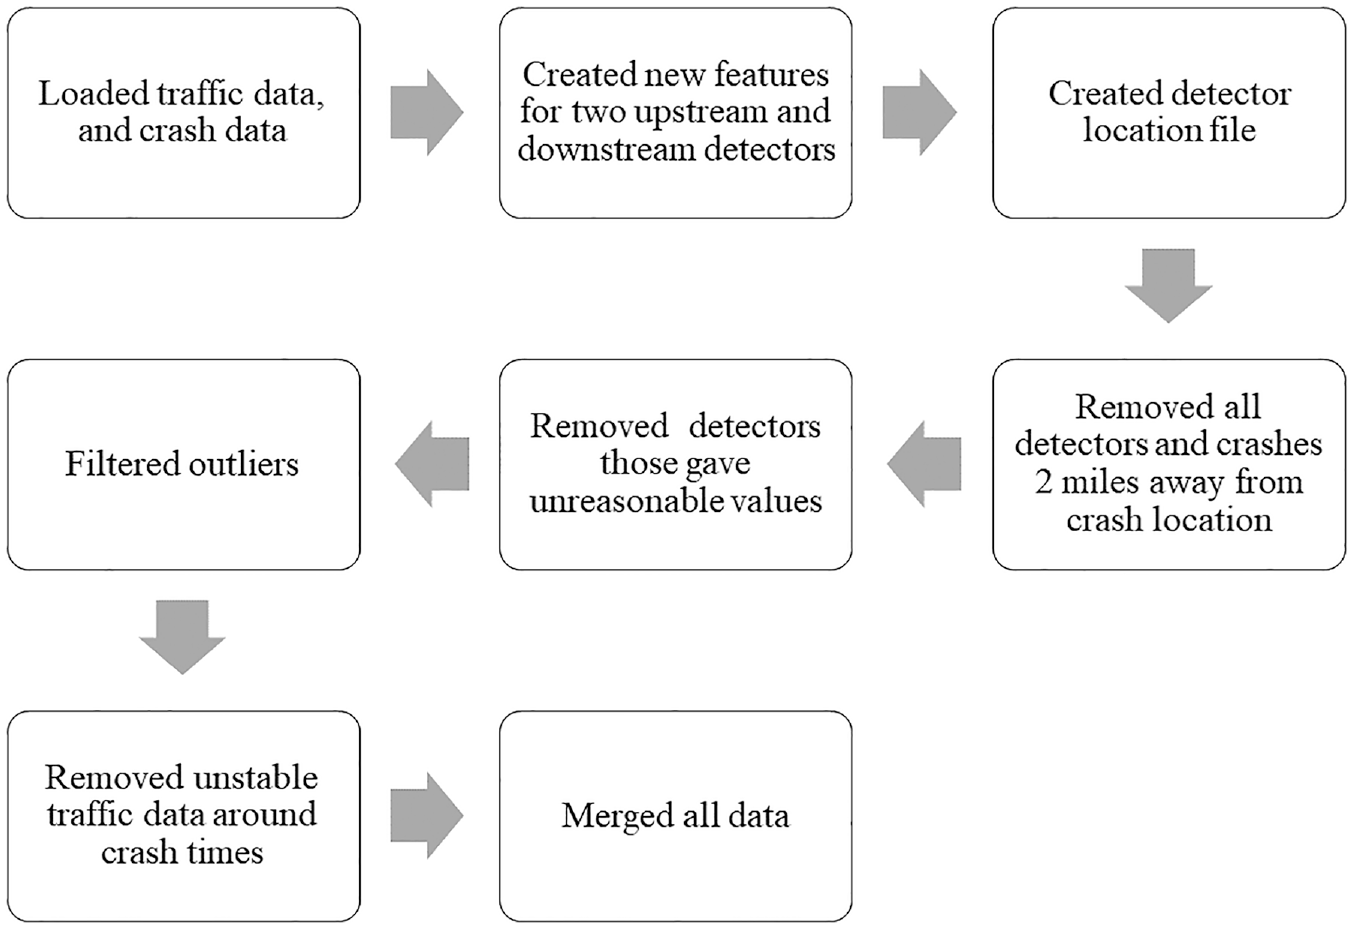
Major data preprocessing steps.
Framework Development
After the data processing steps, the crash likelihood prediction model, severity clustering model, and cluster validation model were developed. Figure 3 depicts the full framework flowchart.
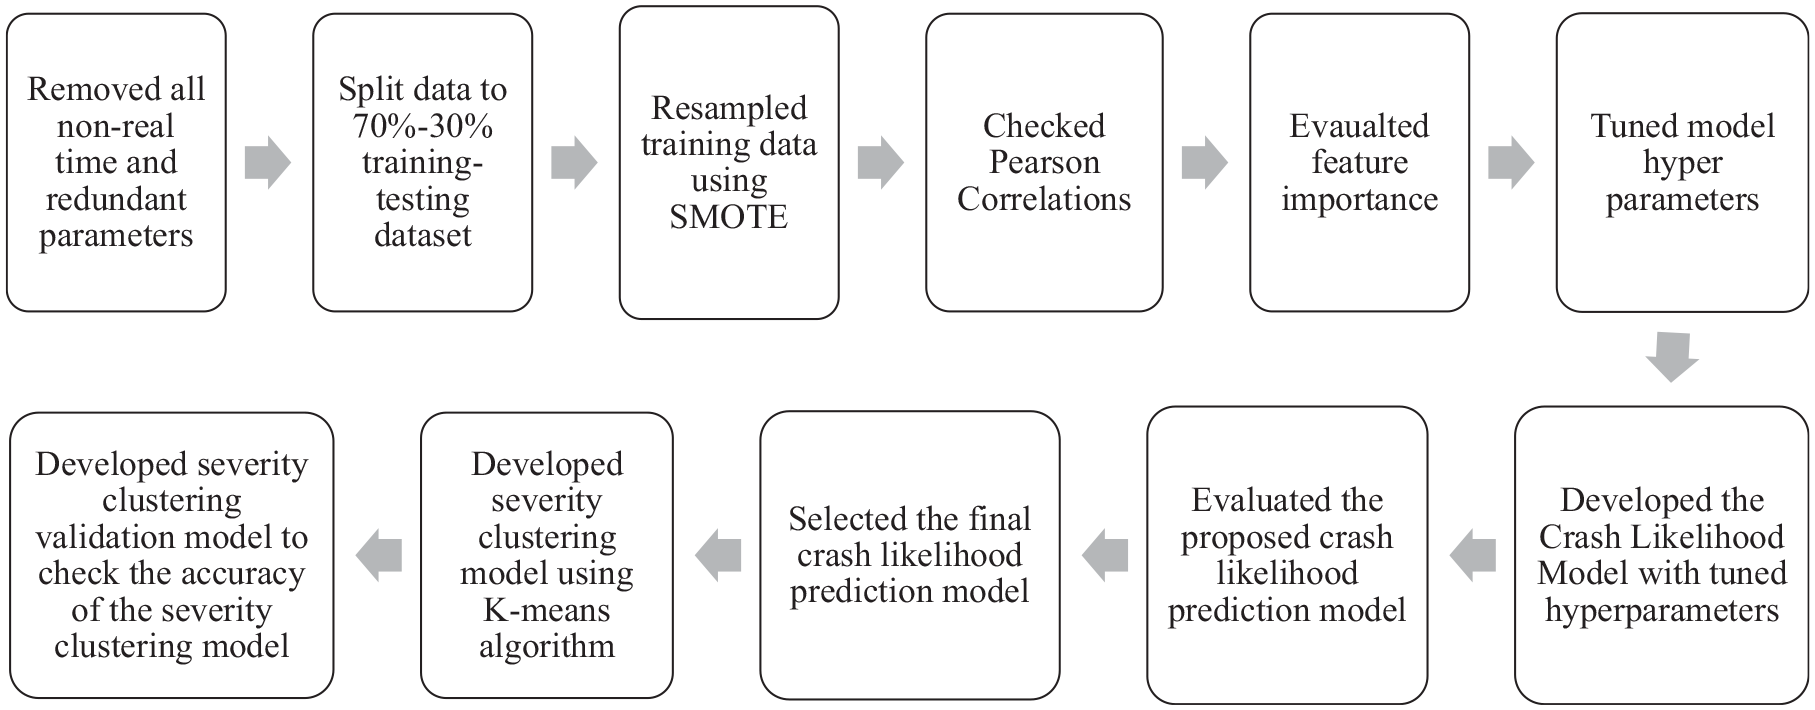
Methodological approach to developing the framework.
Crash Likelihood Prediction Model
Firstly, all the features that cannot be obtained in real time were removed using subject matter knowledge and data availability in real time. The dataset was split into training–testing datasets using a 70%:30% split, respectively. Since the traffic-related crash data was highly imbalanced, SMOTE resampling was applied to the training dataset. The Pearson correlation coefficients among the features were checked to avoid the multi-collinearity issue. Independent variables that had coefficient values greater than 0.5 were disregarded in the model ( 54 ). In addition, the feature importance of the variables was calculated using the random forest classifier ( 55 ). Then, the model hyperparameters were tuned to obtain the optimized results using the grid search algorithm ( 56 ). Finally, models were fitted with the optimized parameters and evaluation metrics were obtained. For the CNN model, we used the two-dimensional (2D) tensor with input shape (3780039, 4, 6, 1). The output is the same crash likelihood as the other models. Sensitivity, specificity, and the area under the receiver operating characteristic curve (ROC curve) were used as the evaluation metrics to select the final model.
Crash Severity Clustering Model
After selecting the final crash likelihood prediction model, an investigation was made to observe the severity likelihood given a crash is likely to occur. The severity levels of crashes were assessed based on the speed and volume relationship. Firstly, models were developed for all detector locations to cluster the crashes into different severity levels based on the speed–volume relationship using the k-means clustering algorithm. Here, speed and volume for a particular detector location were used as the input, and the severity level was obtained as the output. Then the detector giving the most accurate speed and volume parameters to develop the severity clustering model was chosen based on the Davies–Bouldin index (DBI) criteria. Finally, the severity clustering model was developed using the speed and volume information from the best detector location. The output of this model was different levels of severity based on the speed–volume relationship considered in this study and is further described in the Results and Discussion section. The purpose of this crash severity clustering model is not only to enable the traffic management center to inform users about the crash likelihood, but also the traffic management center can implement TSM&O strategies in real time based on the level of severity to avoid a crash or minimize the crash severity level.
Severity Clustering Validation Model
Finally, a severity clustering validation model was developed to check the accuracy of the developed severity clustering model. The purpose of this severity clustering validation model is to ensure how accurately the developed severity clustering model is in assessing the likelihood of a crash event to be severe. A total of nine machine-learning models were developed following the same methodology used to develop the crash likelihood prediction models. Here, the input variables were the same as the crash likelihood prediction models, and the output was the severity level. The final severity clustering validation model was selected based on the sensitivity and specificity values from each level of the developed severity clustering model.
Results and Discussion
Data Statistics
The final processed dataset had 6,750,072 events (625 crash events and 6,749,447 non-crash events) before resampling, and a total of 24 features. After the 70%:30% data split, the training dataset had 4,725,049 events (437 crash events and 4,724,612 non-crash events), and the testing dataset had 2,025,023 events (188 crash events and 2,024,835 non-crash events). After applying the SMOTE, the training dataset had 9,449,224 events. As shown in Table 3, the resampling step did not alter the statistical property of the data.
Descriptive Statistical Features of Real and Synthetic Data
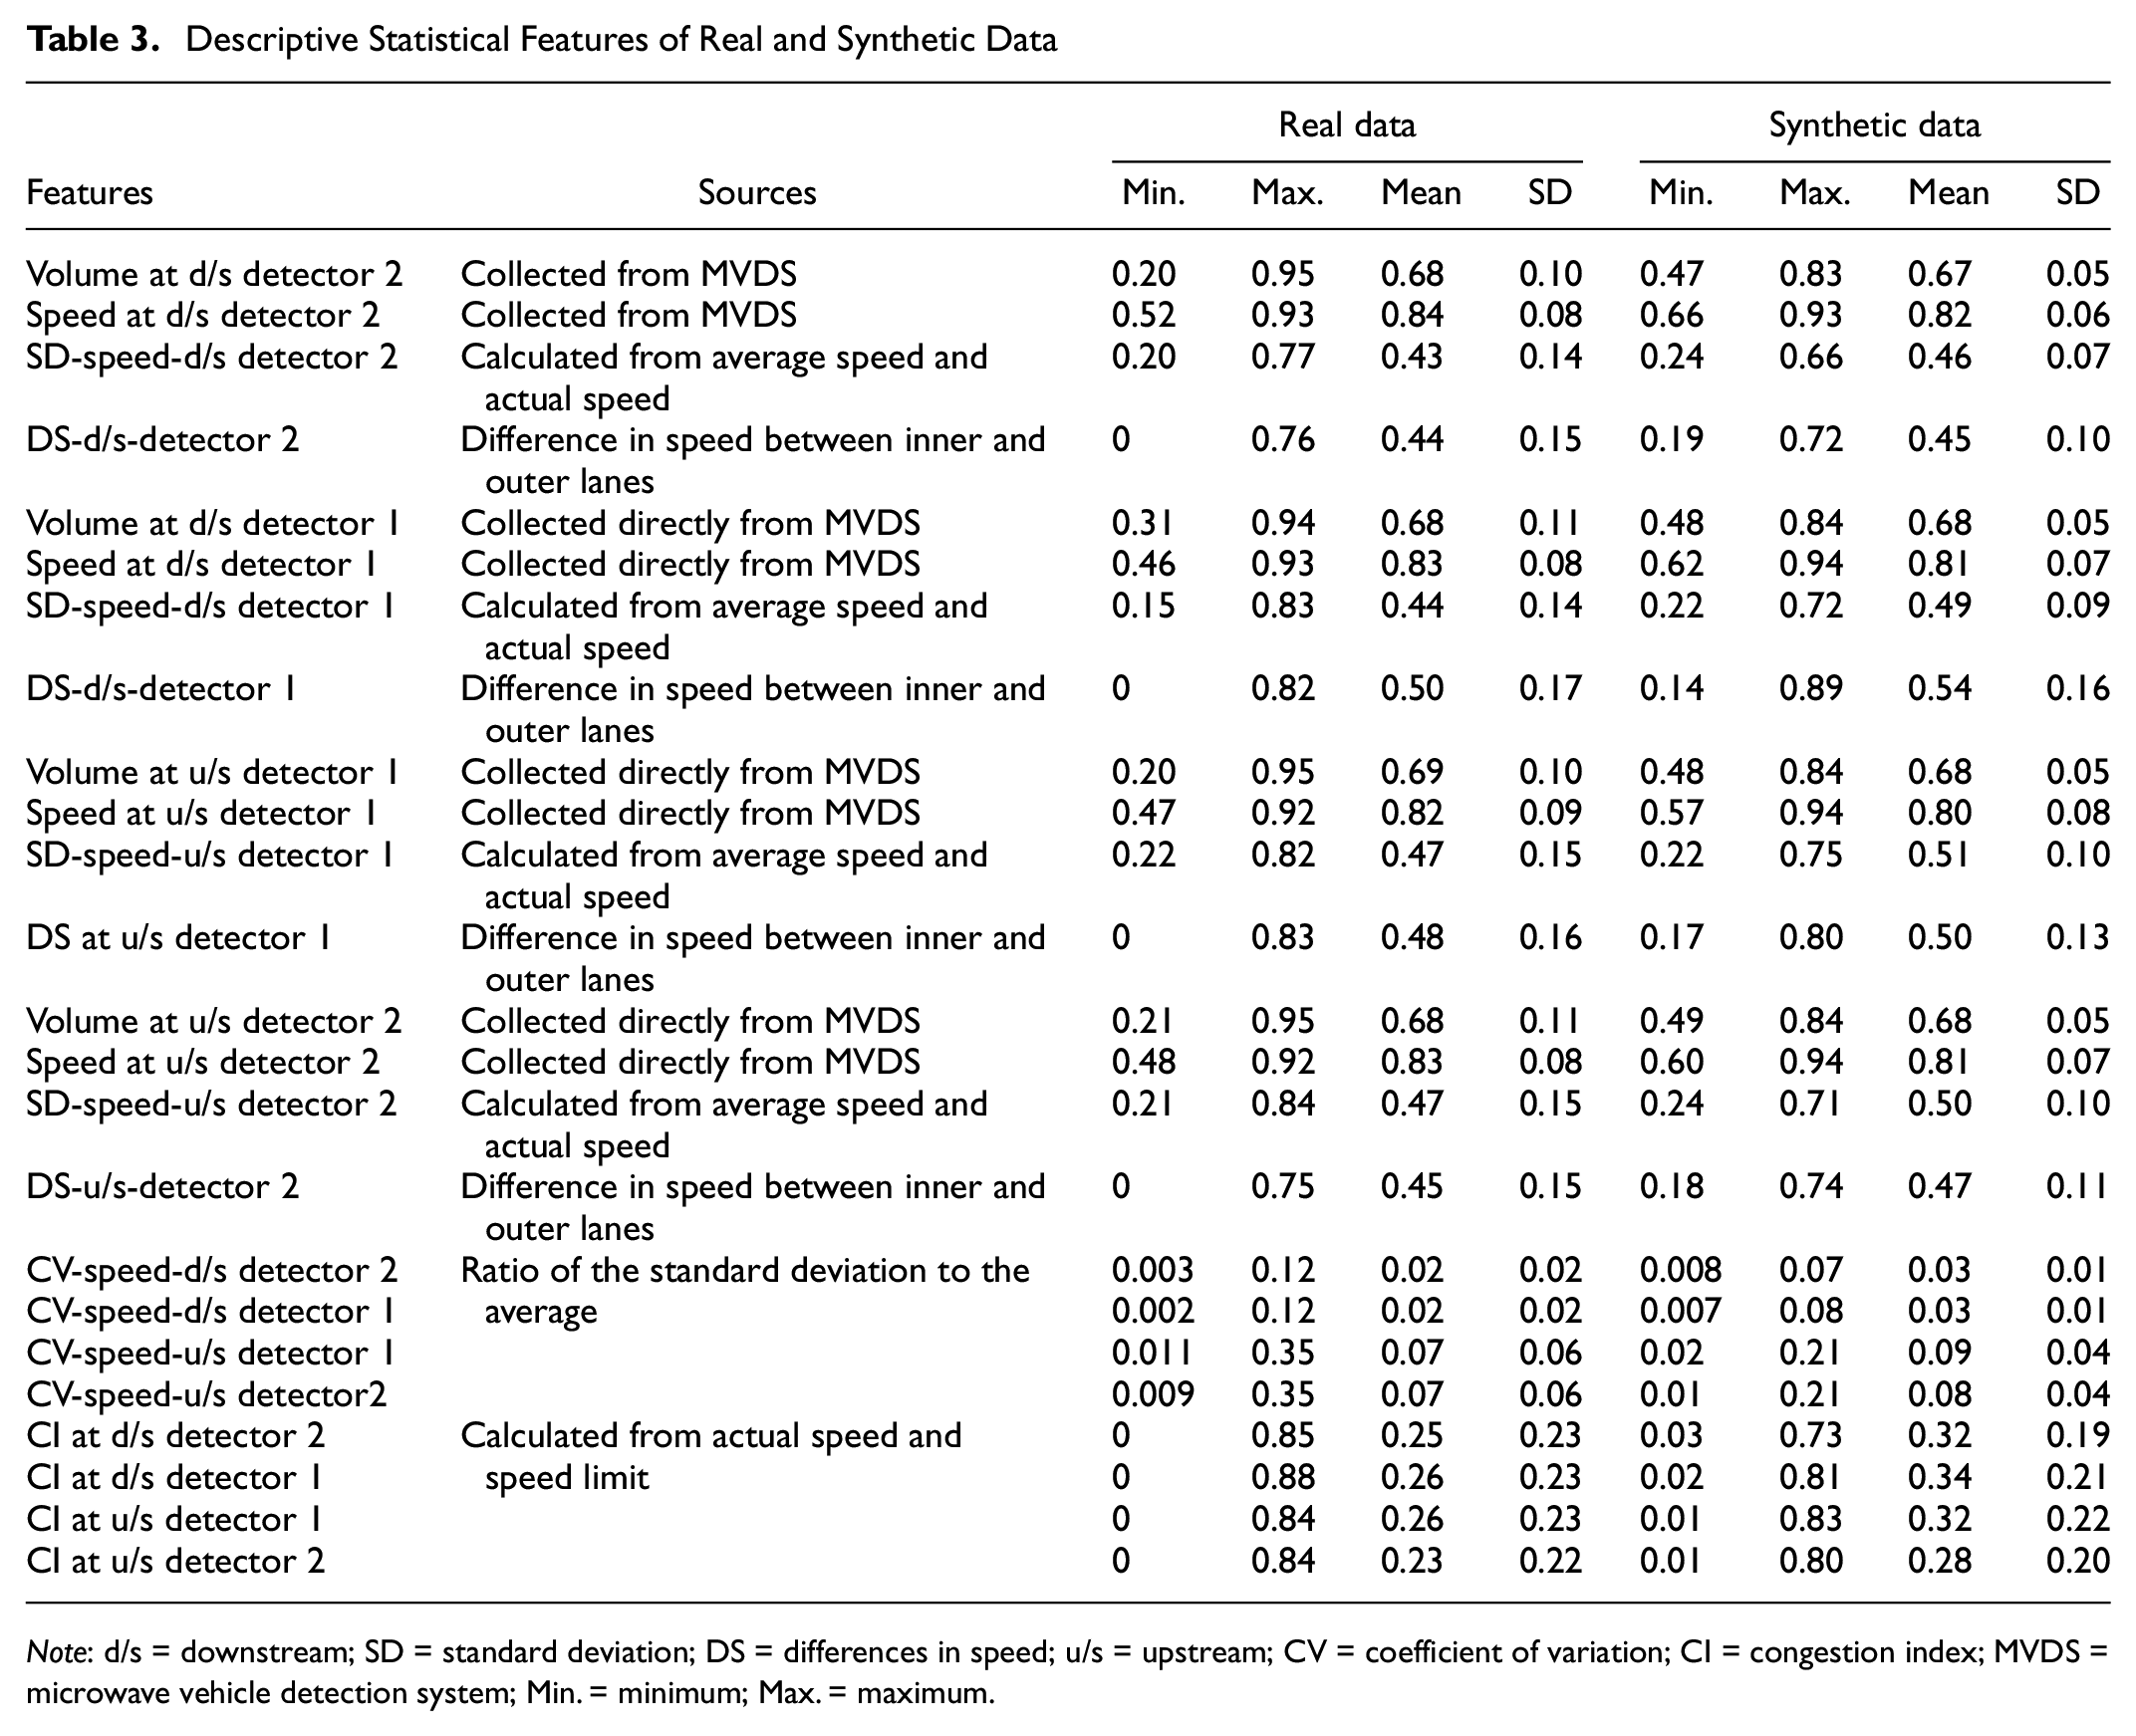
Note: d/s = downstream; SD = standard deviation; DS = differences in speed; u/s = upstream; CV = coefficient of variation; CI = congestion index; MVDS = microwave vehicle detection system; Min. = minimum; Max. = maximum.
Next, the Pearson correlation coefficient of all these 24 features were checked, as shown in Figure 4a, and variables with coefficient values greater than 0.5 were disregarded. This reduced the total number of features to 10. Then, the random forest classifier was used to observe the feature importance to understand the most important feature to predict the crash likelihood. Figure 4b shows that the speed difference between the inner lane and outer lane at all the four detector locations was found to be the strongest predictor of crash likelihood. The speed, volume, and SDs of speed in the u/s detectors were found to be important. Also, the SD of speed and CI in the d/s detectors make contributions to crash likelihood prediction.
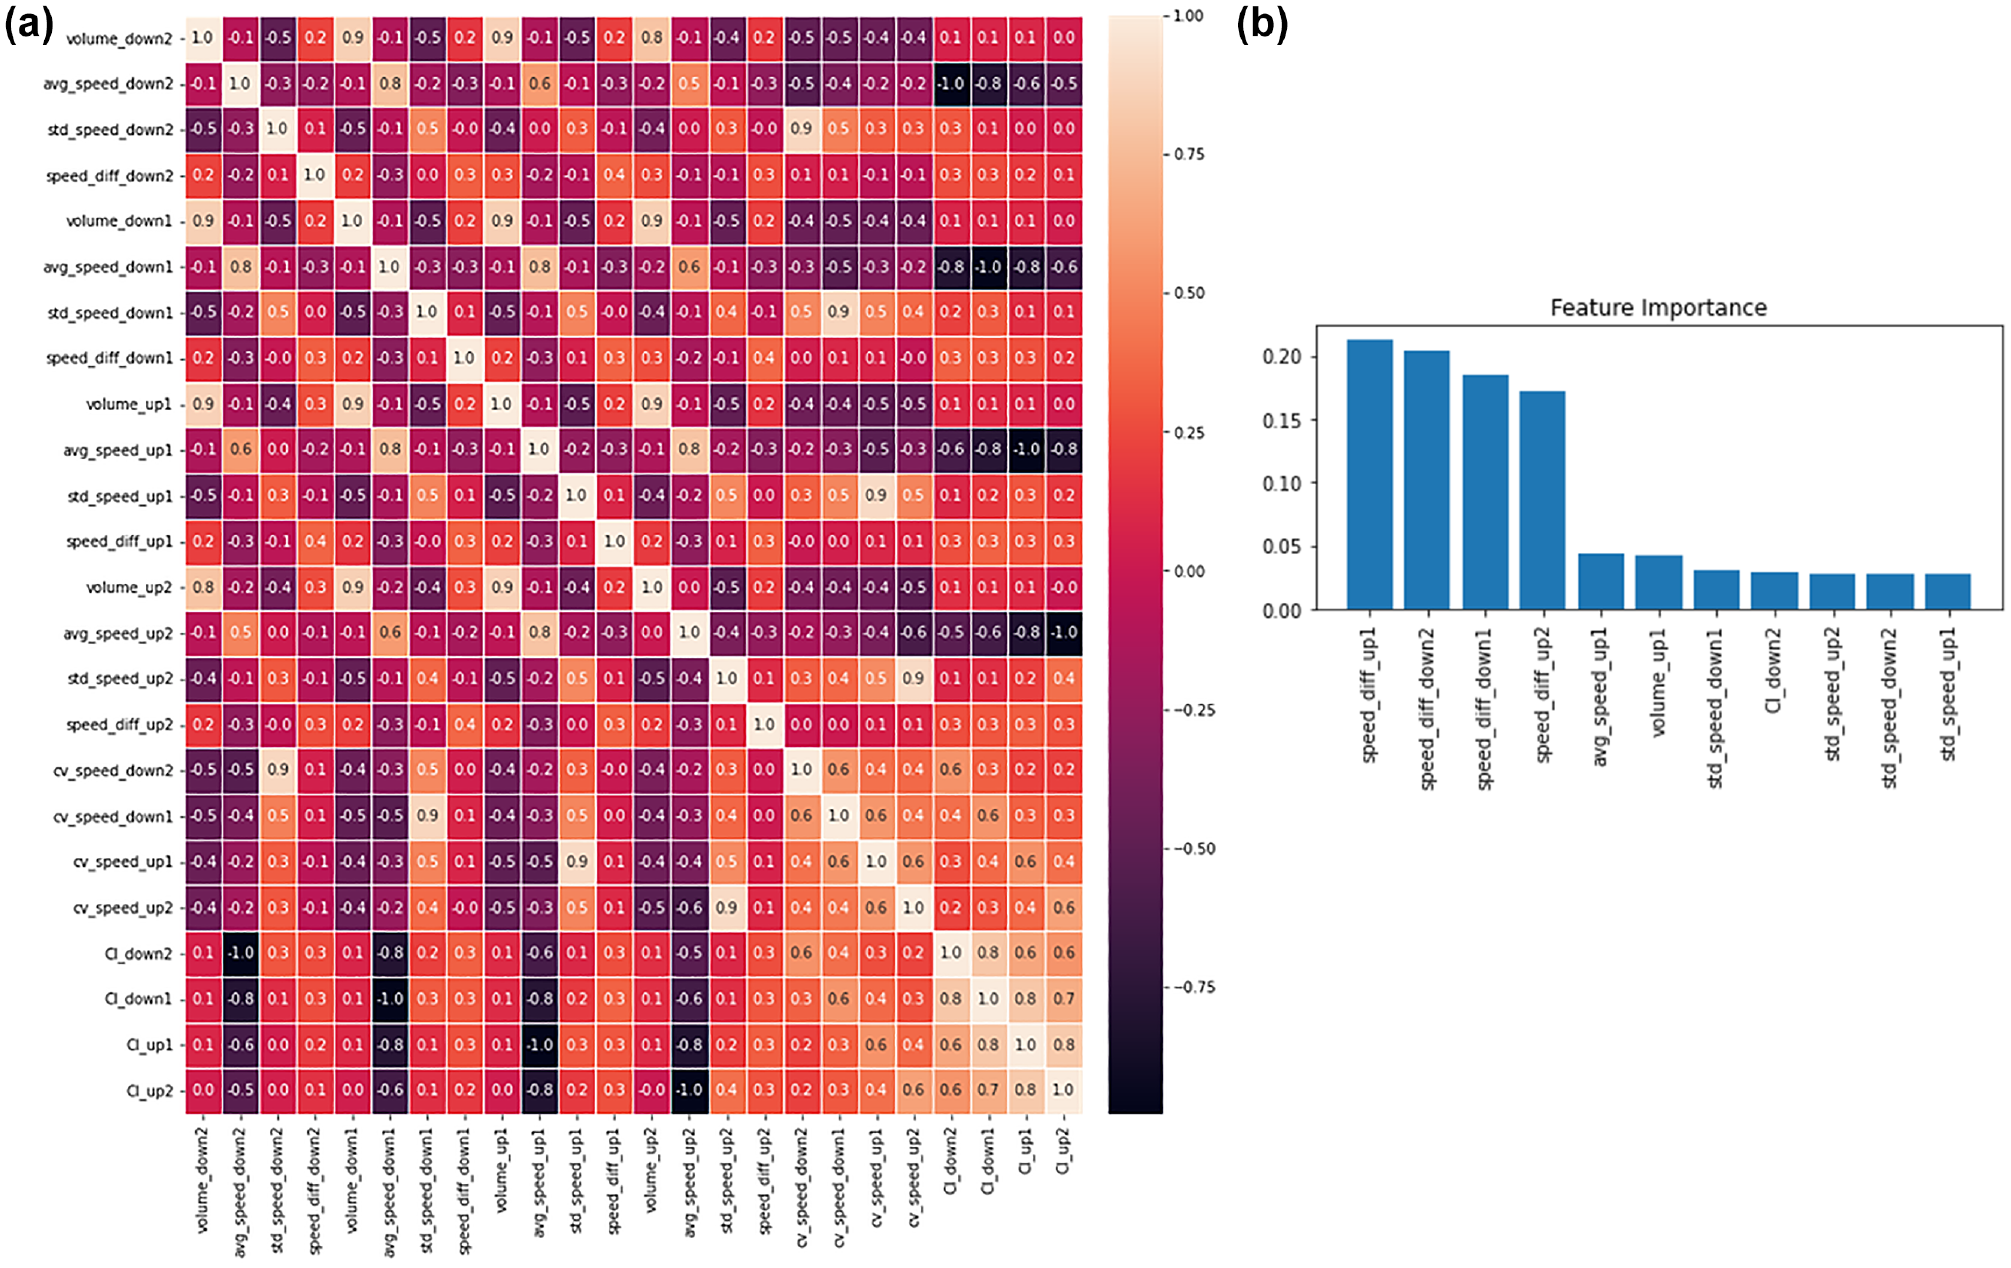
Correlation and feature importance: (a) Pearson correlation coefficients and (b) feature importance.
Crash Likelihood Prediction
Nine machine-learning classification models were used to attempt to find the most suitable techniques to predict the crash likelihood of a particular event. The most suitable model was selected based on four evaluation criteria: the sensitivity, specificity, false alarm rate, and area under the ROC curve. In this study, sensitivity represents how accurate a model is in predicting an actual crash event as a crash event. The specificity value represents how accurately a model is in predicting an actual non-crash as a non-crash event. The false alarm rate indicates the percentage of wrong non-crash events predicted as crash events. The area under the ROC curve represents how effectively a particular model distinguishes between crash and non-crash events. Table 4 shows the results of the models attempted. Most of the models had good specificity values, which indicate that they are predicting the non-crash events accurately. However, the aim of this paper is to predict crash events more accurately, and sensitivity value gives us that measure. LR, GB, and the CNN produced reasonable sensitivity values. Among these three, the CNN had the highest sensitivity values. In addition, the CNN generated competitive specificity, false alarm rate, and area under the ROC curve values. Furthermore, these evaluation results are competitive with the earlier real-time crash likelihood prediction studies shown in Table 2. Therefore, the CNN model was selected to accurately predict the crash likelihood from crash and non-crash events.
Results of Machine-Learning Algorithms Applied to Select the Crash Likelihood Model
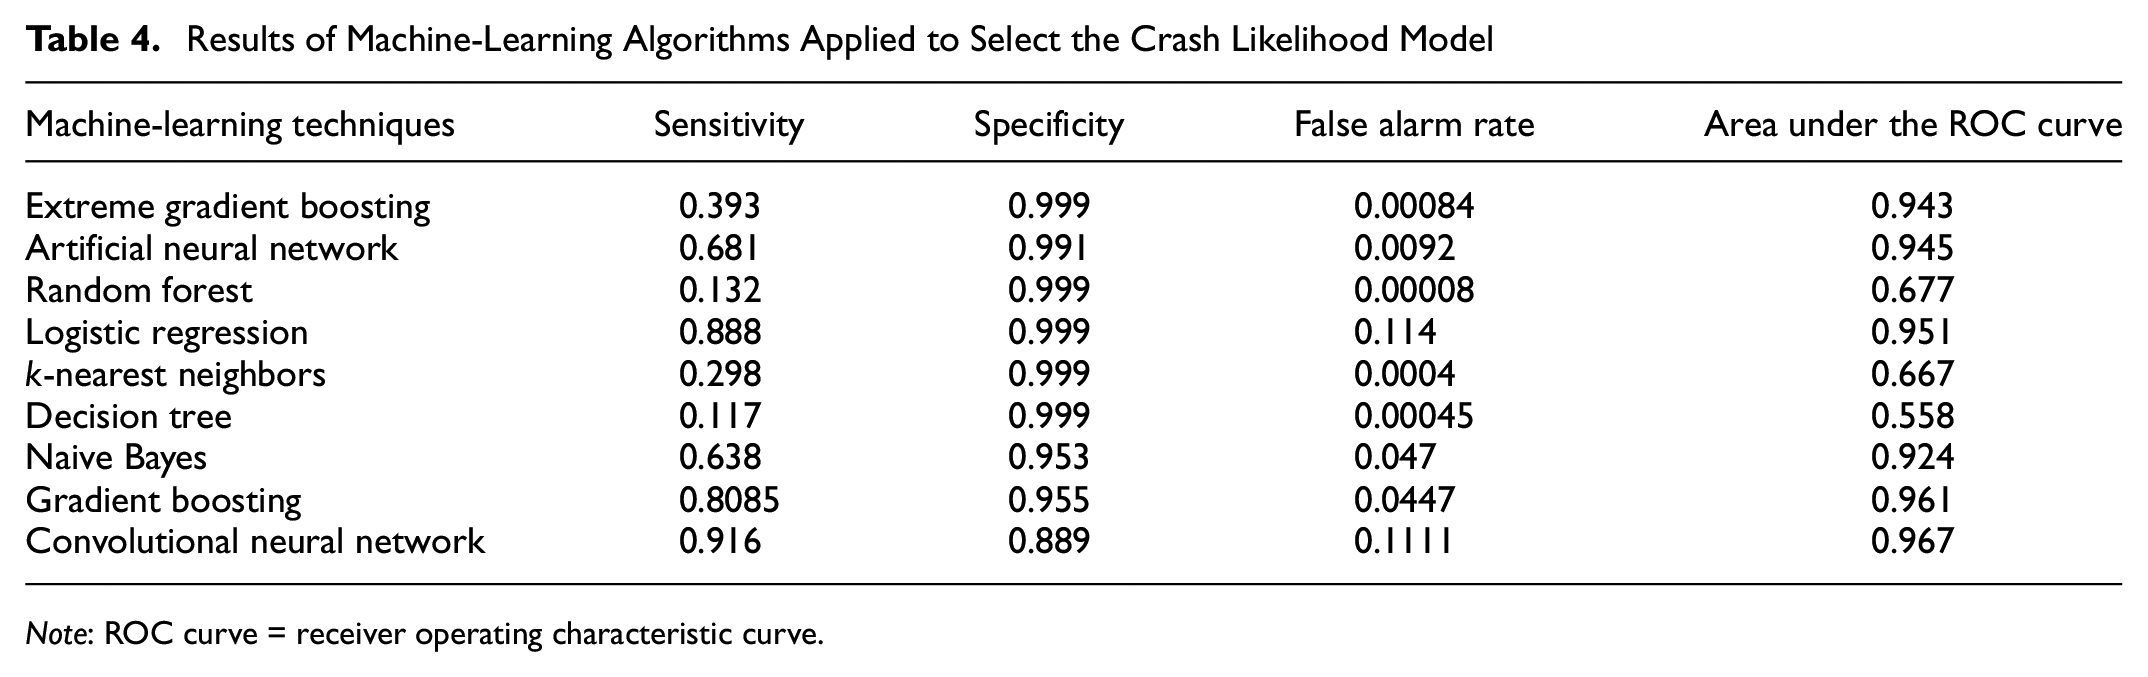
Note: ROC curve = receiver operating characteristic curve.
Crash Severity Clustering
The frequently used k-means clustering technique was utilized to develop the severity clustering model given a crash is likely to occur. Since there is a direct relationship between speed and volume with the crash severity ( 57 ) and the current study collected traffic information from two u/s and two d/s detectors, the speed and volume relationship was investigated for all four detectors. The initial investigation of the speed–volume relationship for the crash events revealed that there were almost no crash cases in the low-speed and low-volume conditions. Therefore, crashes were divided into three clusters in the speed–volume relationship curve, that is, high-speed and low-volume, high-speed and high-volume, low-speed and high-volume. Based on this observation, the clustering algorithm was applied to classify the crash events into these three clusters for all four detectors to identify which crash falls into which cluster. Then the DBI was estimated for each detector location using the clustered crash events. The DBI is a well-accepted measure to evaluate clustering algorithms, and it evaluates the goodness of split by the k-means algorithm for a given number of clusters. A lower DBI value indicates better separation of the clusters ( 57 , 58 ). Figure 5 shows the results from clustering at the detector locations, and it is evident that u/s detector location 2 gave the best results based on the lowest DBI value. Therefore, speed and volume information from the u/s detector at location 2 was used to define distinct levels of crash severity. For clarification, in our study, on average the detectors are spaced around 0.5 mi apart, and the study did not consider any detector information that is 2 mi away from the crash location. Further, the study defined these three speed–volume clusters as follows: the high-speed and low-volume cluster was defined as high-severity level, the high-speed and high-volume cluster was defined as medium-severity level, and the low-speed and high-volume cluster was defined as low-severity level. The rationale for such definitions is that crashes are more likely to be severe and fatal in the high-speed and low-volume condition, incapacitating and non-incapacitating injuries are expected in the high-speed and high-volume condition, and property damage and low injury are expected to occur in the low-speed and high-volume condition (3, 59–61). Here, the crash severity levels are as per the KABCO scale, where K refers to a fatal crash, A refers to an incapacitating injury, B refers to a non-incapacitating injury, C refers to a possible injury, and O refers to property damage only ( 3 , 62 ). Finally, we proposed this crash severity clustering model to identify the severity level of a crash based on the speed and volume information collected from u/s detector location 2. The developed severity clustering model has the potential to help the traffic management center to apply TSM&O strategies based on the predicted severity level to avoid the crash or reduce the severity of the crash in real time.
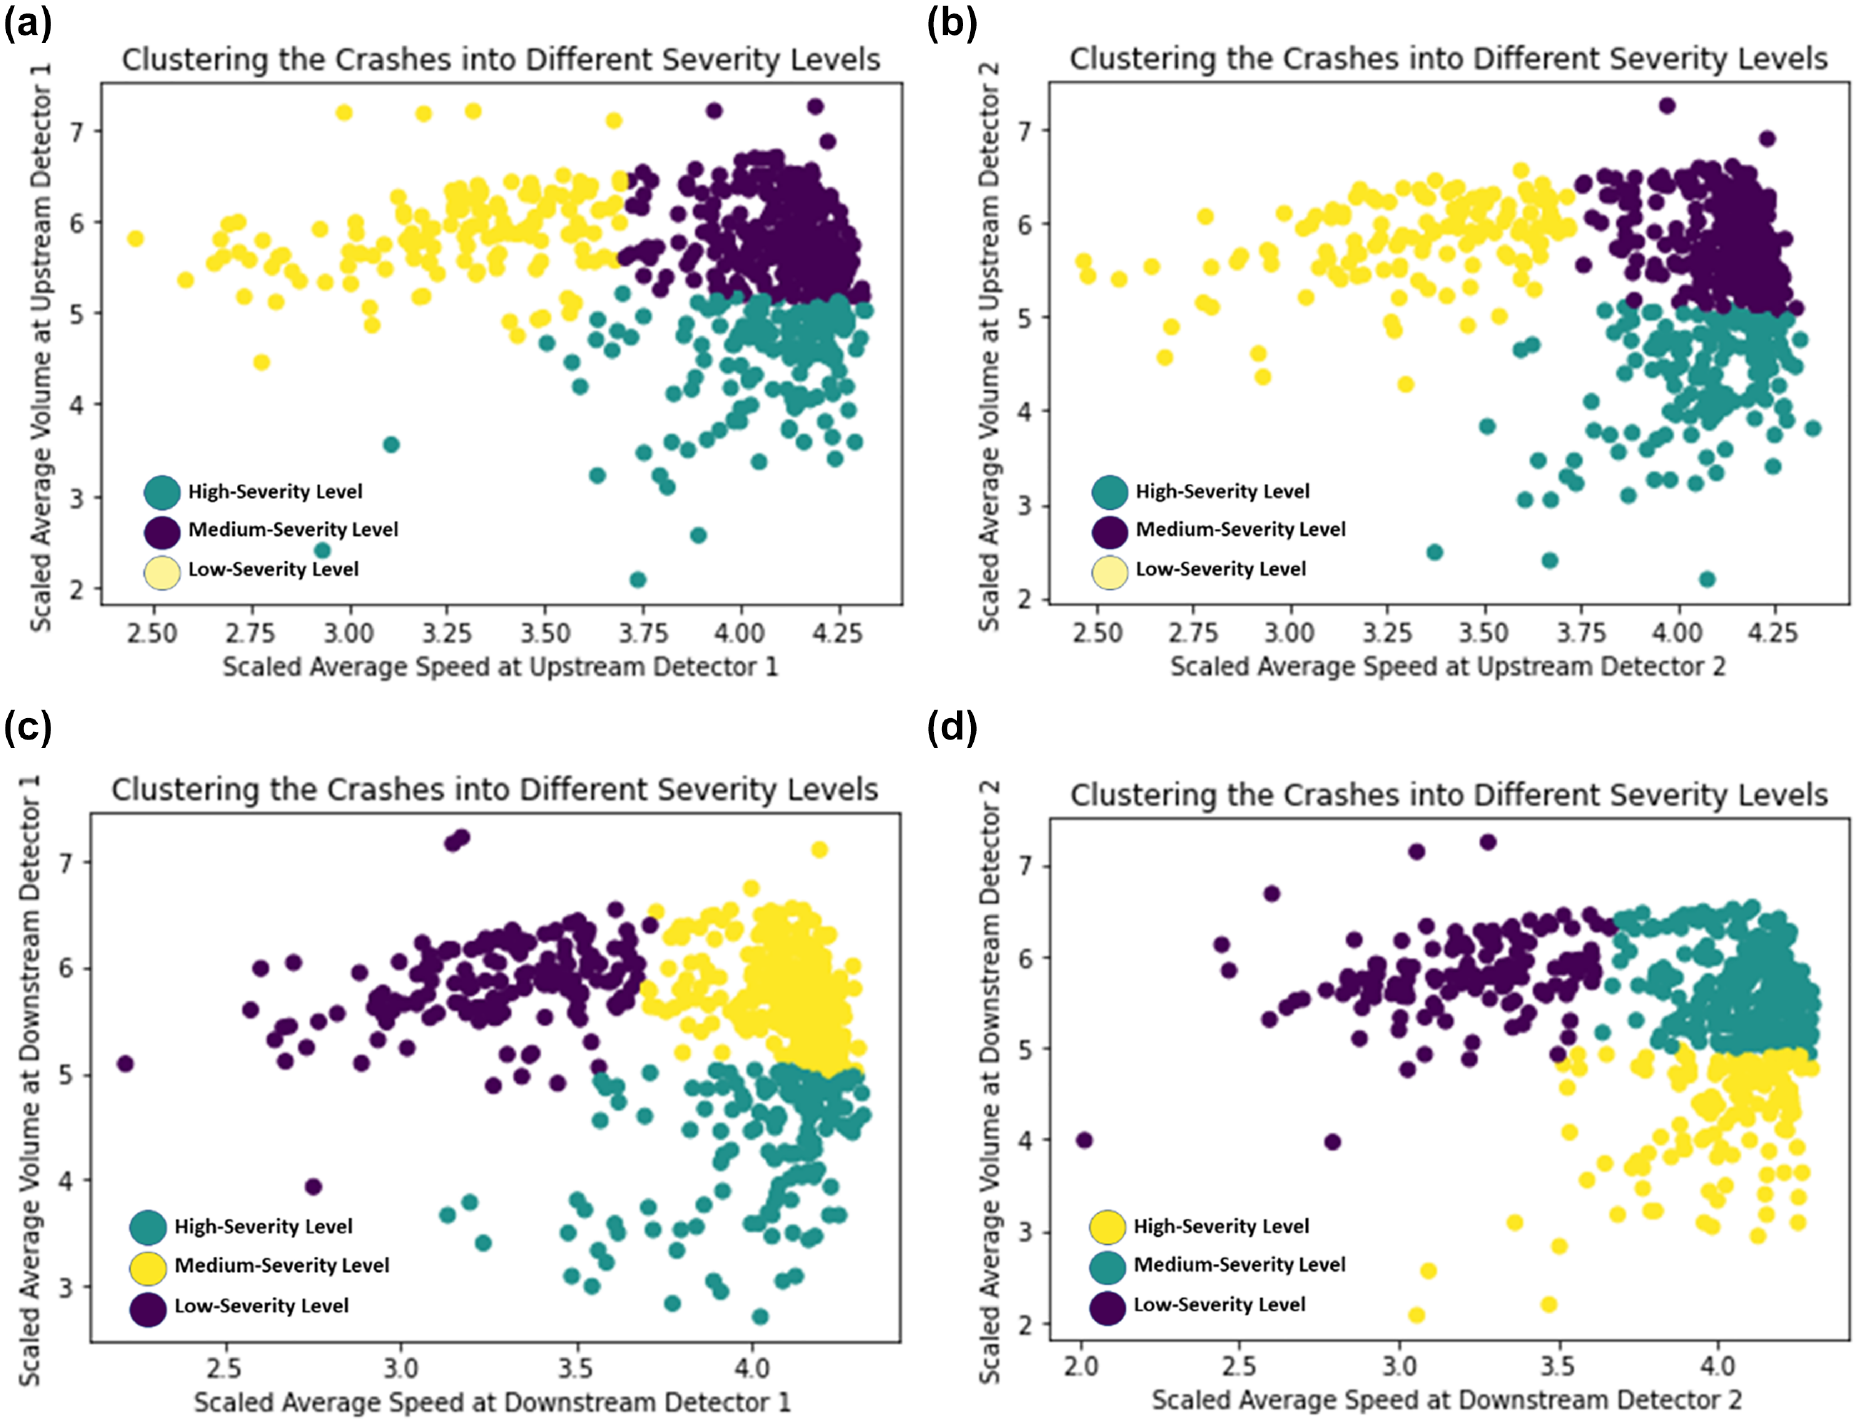
k-means clustering to identify crash severity levels at different detector locations: (a) upstream detector location 1 (Davies–Bouldin index [DBI] = 0.7254), (b) upstream detector location 2 (DBI = 0.6769), (c) downstream detector location 1 (DBI = 0.7244), and (d) downstream detector location 2 (DBI = 0.7157).
Severity Clustering Validation
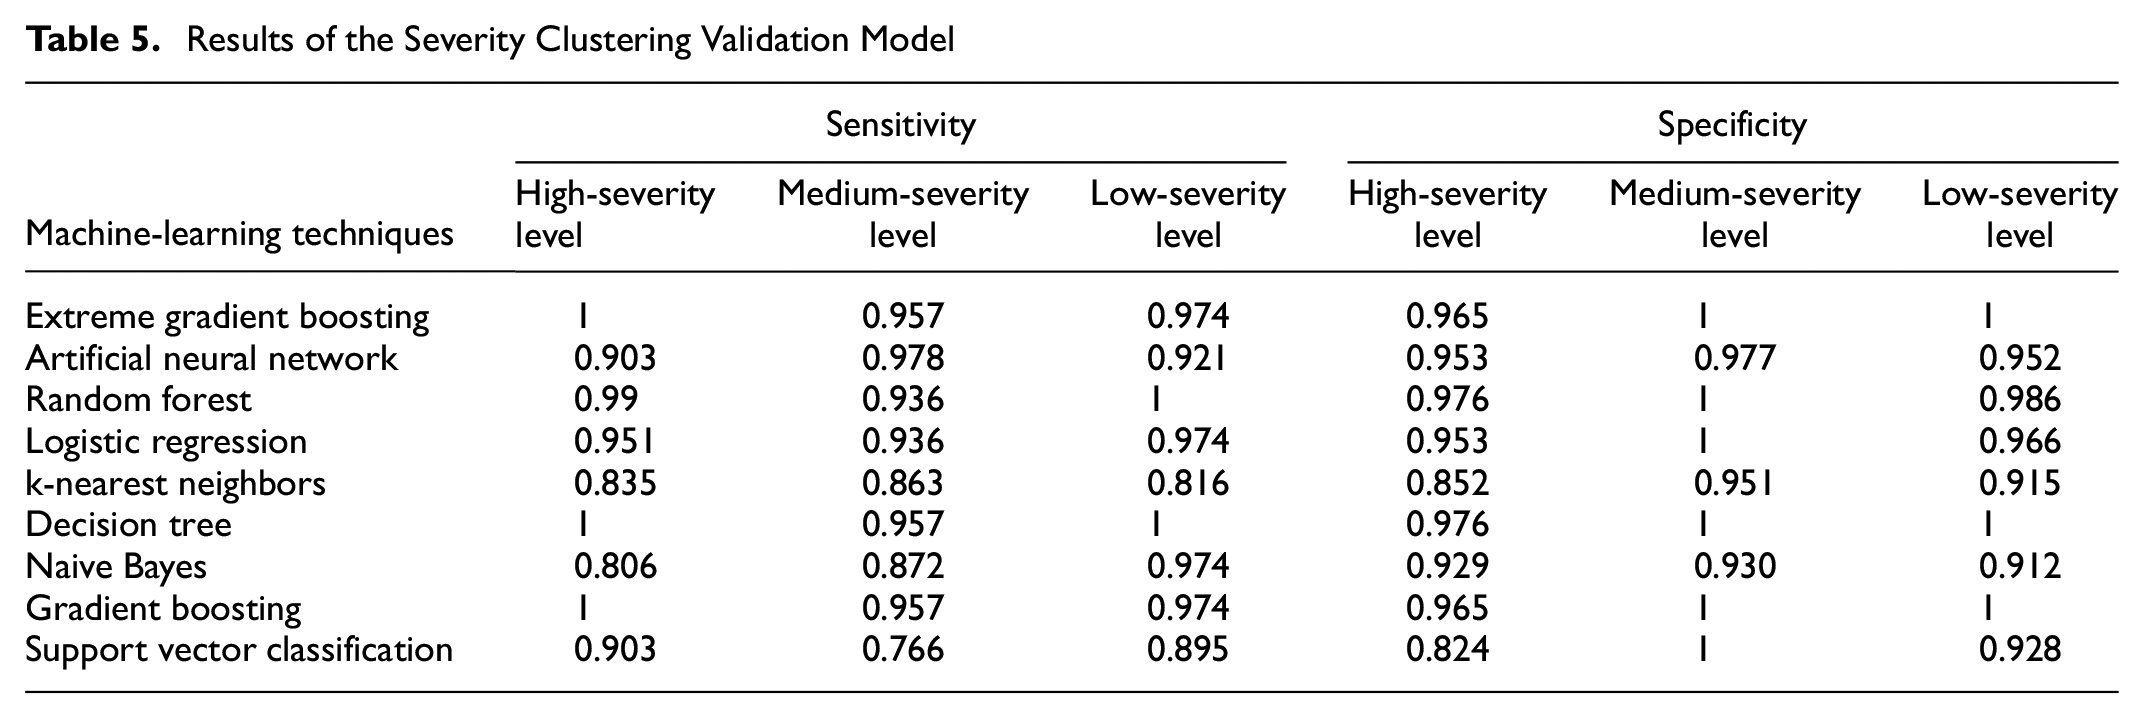
Finally, a severity clustering validation model was further developed to check the accuracy of the proposed severity clustering model. The purpose of this severity clustering validation model is to check whether a certain crash falls into a particular severity level that is predicted by the severity clustering model. To check that accuracy, we attempted nine machine-learning techniques and proposed the most suitable techniques for this severity clustering validation model. Table 5 shows the results from the different techniques. Since there are three severity levels predicted by the severity clustering model, we evaluated the model performance for all three levels based on the sensitivity values and specificity values. Since the priority should be to avoid crashes at the high-severity level, we first checked the sensitivity values. Based on the sensitivity values, XGBoosting, the DT, and GB were found to be competitive. These three models have the same sensitivity value in the medium-severity level; however, the DT has higher values in the low-severity level. Also, the highest specificity value was found in all three levels for the DT model. Therefore, the DT model was selected as the most suitable for this severity clustering validation model. Thus, the severity clustering validation model showed that our proposed severity clustering model was performing with high accuracy to assign the crashes into particular severity levels in real time, given a crash is likely to occur.
Results of the Severity Clustering Validation Model
Conclusions and Future Research
This study was an attempt to minimize the research gaps in real-time safety research by proposing a framework to help traffic management centers to alert road users in real time to avoid crash likelihood or minimize crash severity. In this work, data was collected from SR-408 in Orlando, Florida, and data features with real-time measurability were selected. Several important features for crash analyses were generated, and the dataset was processed in a systematic way to remove unreasonable values and make real-time features applicable to the models. The final processed dataset had 6,750,072 events (625 crash events and 6,749,447 non-crash events) and 24 features. Then SMOTE sampling was applied to the training dataset to minimize the imbalanced impacts, and the final training dataset contained 9,449,224 events. To achieve the main objectives of this study, firstly a crash likelihood prediction model was developed to predict the likelihood of a crash occurrence in real time. Nine machine-learning techniques were attempted and, finally, the CNN was selected based on the sensitivity (0.916), specificity (0.889), area under the ROC curve (0.967), and false alarm rate (0.111) evaluation criteria. Then a severity clustering model was developed to assign the crash events into three severity levels, that is, the high-severity level, medium-severity level, and low-severity level using the k-means clustering algorithm. All four u/s and d/s detector locations were checked, and based on the DBI criteria, speed and volume information from the u/s detector at location 2 was used to develop this severity clustering model. The purpose of this model was to help the traffic management authority to warn road users about the crash severity level they are going to encounter in real time, given a crash is likely to occur. Finally, a severity clustering validation model was developed to check the accuracy of the developed severity clustering model. More specifically, this severity clustering validation model checked how accurately the crashes that are predicted to fall into a certain severity level by the severity clustering model were falling into the anticipated severity level. Nine machine-learning techniques were attempted to develop this severity clustering validation model and, based on the sensitivity and specificity value at three severity levels, the DT model was found to perform best. The sensitivity values for the high, medium, and low severity levels were found to be 1, 0.957, and 1, respectively. This validated that our proposed severity clustering model was performing with high accuracy.
The proposed framework has the potential to minimize the number of crashes on roads and improve road safety by enabling the traffic management authority to alert users in real time about the crash likelihood along with the crash severity level associated with that crash. Future studies can extend this framework and attempt to improve the accuracy of the current framework by incorporating more micro-level variables and using advanced modeling techniques.
Footnotes
Author Contributions
The authors confirm contribution to the paper as follows: study conception and design: M.R. Islam, M. Abdel-Aty, Z. Islam; data collection: M.R. Islam, Z. Islam; analysis and interpretation of results: M.R. Islam, M. Abdel-Aty, Z. Islam, A. Abdelraouf; draft manuscript preparation: M.R. Islam, M. Abdel-Aty, Z. Islam, A. Abdelraouf. All authors reviewed the results and approved the final version of the manuscript.
Declaration of Conflicting Interests
The author(s) declared no potential conflicts of interest with respect to the research, authorship, and/or publication of this article.
Funding
The author(s) received no financial support for the research, authorship, and/or publication of this article.