
Abstract
The mechanical system applied in industry and manufacturing fields is generally a complex multi-stage isolation system, which contains a lot of connection parts. In order to better analyze the effect of the connection parts, the transfer path model of a two-stage serial system is developed in this article using frequency response function based substructuring method. To verify the proposed transfer path model, a finite element model that simulates a two-stage serial vibration isolation system is built. By comparing the predicted results and exact values, the model proves to be correct. Furthermore, the random noise is introduced into the system-level frequency response functions for error sensitivity analysis and the influence on the substructure frequency response functions is quantified through comparison. Since the possible errors are unknown in the experimental measurement, 5%, 25%, and 50% random errors are introduced into all the input frequency response functions individually to analyze the influence of different noise levels on the prediction accuracy. In order to solve the ill-conditioned inverse problem involved in the model, the truncated singular value decomposition is also applied. The simulation results show that compared with the direct-inverse method, truncated singular value decomposition can decrease the prediction error caused by the introduced noise more effectively.
Keywords
Introduction
Nowadays, since more focus is placed on the environmental noise problem, government noise regulation is becoming stricter and stricter. Customers also lay more emphasis on acoustic comfort when they buy any products. So a large amount of effort has been invested into the improvement of technology of noise and vibration reduction and containment. 1
A mechanical structure is generally a complicated multi-stage system involving many sub-assemblies. Therefore, it is of value to study the connection parts between a vibration source and the final location experienced by an observer or a vibro-acoustic sensation.
Transfer path analysis (TPA) is an established tool that can be used to determine path contributions from vibration and noise sources. With the development of this method, a frequency response function (FRF)-based substructuring approach is widely used in TPA to set up the relationship between excitation and response.
In the end of 1980s, the FRF-based substructure synthesis method began to be studied. 2 Later, researchers3–7 summed up the difficulties of substructure method in experimental part and a further study was made. Lee and Hwang, 8 Zhen, 9 and Liu 10 applied a developed FRF-based substructuring method to deal with various vehicle system noise, vibration, and harshness (NVH) responses. Wang and Chuang, 11 Sjövall and Abrahamsson, 12 and Pradhan and Modak 13 identified the substructures from a coupled system through different updating formulation based on this method. Damjan and Miha 14 established a theoretical model of a joint from the substructures and assembly FRF data. Wang and colleagues15–20 used the inverse substructuring method to investigate the dynamic vibration characteristics of a product transport system. Mayes et al. 21 presented two new metrics that could be used by the analyst to determine the cause of indefinite mass or stiffness matrices after substructure uncoupling. Law and Yong 22 proposed the substructural identification methods with the structure divided into substructures and with one substructure assessed at one time. D’Ambrogio and Fregolent 23 verified that rotational degrees of freedom (DOFs) are not essential in the decoupling problem. Tol 24 used FRF decoupling method in the identification of joint stiffness and damping and the identified parameters were significantly improved through an optimization algorithm.
When studying the dynamic modeling of the two-stage serial isolation system using the FRF-based inverse substructuring method, we have to confront some ill-conditioned inverse problems due to the introduced noise. Hence, we need the help of truncated singular value decomposition (TSVD) to address the inverse problem involved in the model, which is advocated by many researchers. Lim and Steyer25–28 used the singular value decomposition (SVD) to overcome the ill-conditioned matrix inversion problem successfully, when studying the FRF-based component synthesis technique. Liu and colleagues10,29 found that the TSVD proved to be useful to decrease the distortion of the final results due to numerical instabilities introduced by the use of the classical, direct inversion algorithm. Brandi et al. 30 used the TSVD to regularize the Hessian matrix in the convection heat transfer coefficient estimation. Shirangi and Alexandre 31 improved TSVD-based randomized maximum likelihood (RML) method for reservoir history matching and uncertainty assessment. The proposed algorithm gradually resolves the important features of the model.
According to present literatures, when inverse substructuring approach is applied to analyze the mechanical vibration, the mechanical system is usually treated as a single-stage vibration isolation system composed of two substructures. So the effect of connection parts cannot be analyzed. Although the inverse substructuring method for a multi-stage product system has already been studied, the model is still different from the actual structure since the random noise is not avoidable in the actual measurement of FRFs. Therefore, error sensitivity should be taken into consideration.
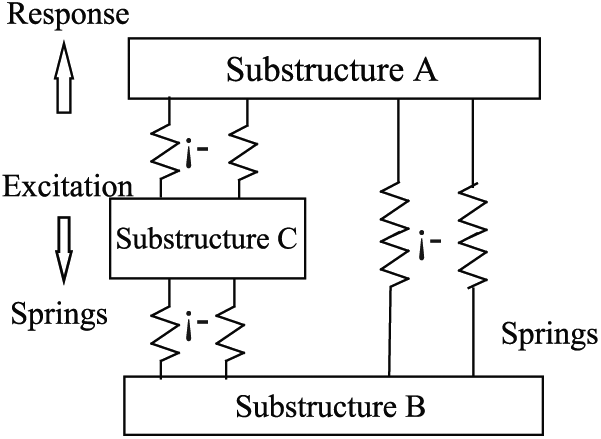
In this article, we simplify a complex structure to a two-stage vibration isolation system with multi-coordinate to carry out a more detailed dynamic analysis, in which all connection parts between the vibration source and the final response area are considered as one part, as substructure B shown in Figures 1 and 2. Generally, there are two kinds of two-stage vibration isolation systems: a serial connection form as shown in Figure 1 and a series-parallel connection form as shown in Figure 2. Moreover, the TSVD method, which is already widely used by many researchers, is also applied in this article to solve the ill-conditioned inverse problem involved in the model.

Two-stage serial isolation system.
Two-stage series-parallel isolation system.
Here, we focus on a serial connection form of a two-stage system. Using FRF-based substructuring method, the source-path-receiver model and substructure property identification model of a two-stage serial vibration isolation system are developed. By comparing the predicted results and direct modal response based on finite element model (FEM), the transfer path models will be verified. Moreover, the random noise is introduced into the system-level FRFs for error sensitivity analysis and the influence on the substructure FRFs is then quantified through comparison. Moreover, random errors at different levels are introduced into all the input FRFs individually to analyze their influence on the prediction accuracy. The direct-inverse method and the TSVD are both applied.
Modeling of coupled two-stage serial isolation system
According to the FRF-based substructuring method, a system can be divided into several independent substructures, which are coupled by springs and damping elements. Each substructure can be represented by its FRF matrix corresponding to specific coordinates. 10 A two-stage serial system is partitioned into three substructures as shown in Figure 1. The three substructures are connected by several scalar springs (Figure 3).

General substructure representation.
Source-path-receiver model
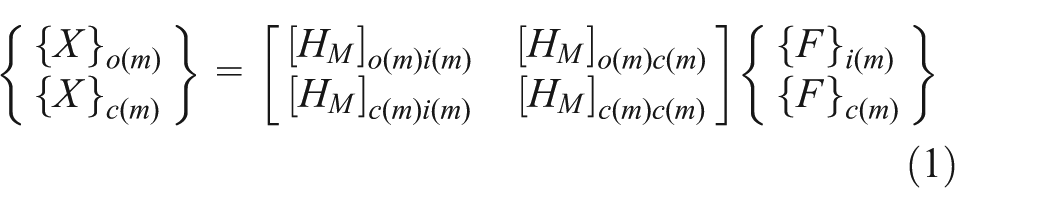
The relationship between the excitation and the response can be represented by a transfer function matrix.
For a multiple DOFs substructure M shown above, the coordinates of interest can be divided into a set of coupling DOFs (denoted by subscript c), a set of excitation coordinates (subscript i), and a set of response coordinates (subscript o). 10 So the relationship can be expressed as follows
As shown in Figure 4, the two-stage serial isolation system S is composed of three substructures with multi-coordinate, where Substructures A and B are connected via a set of flexible springs

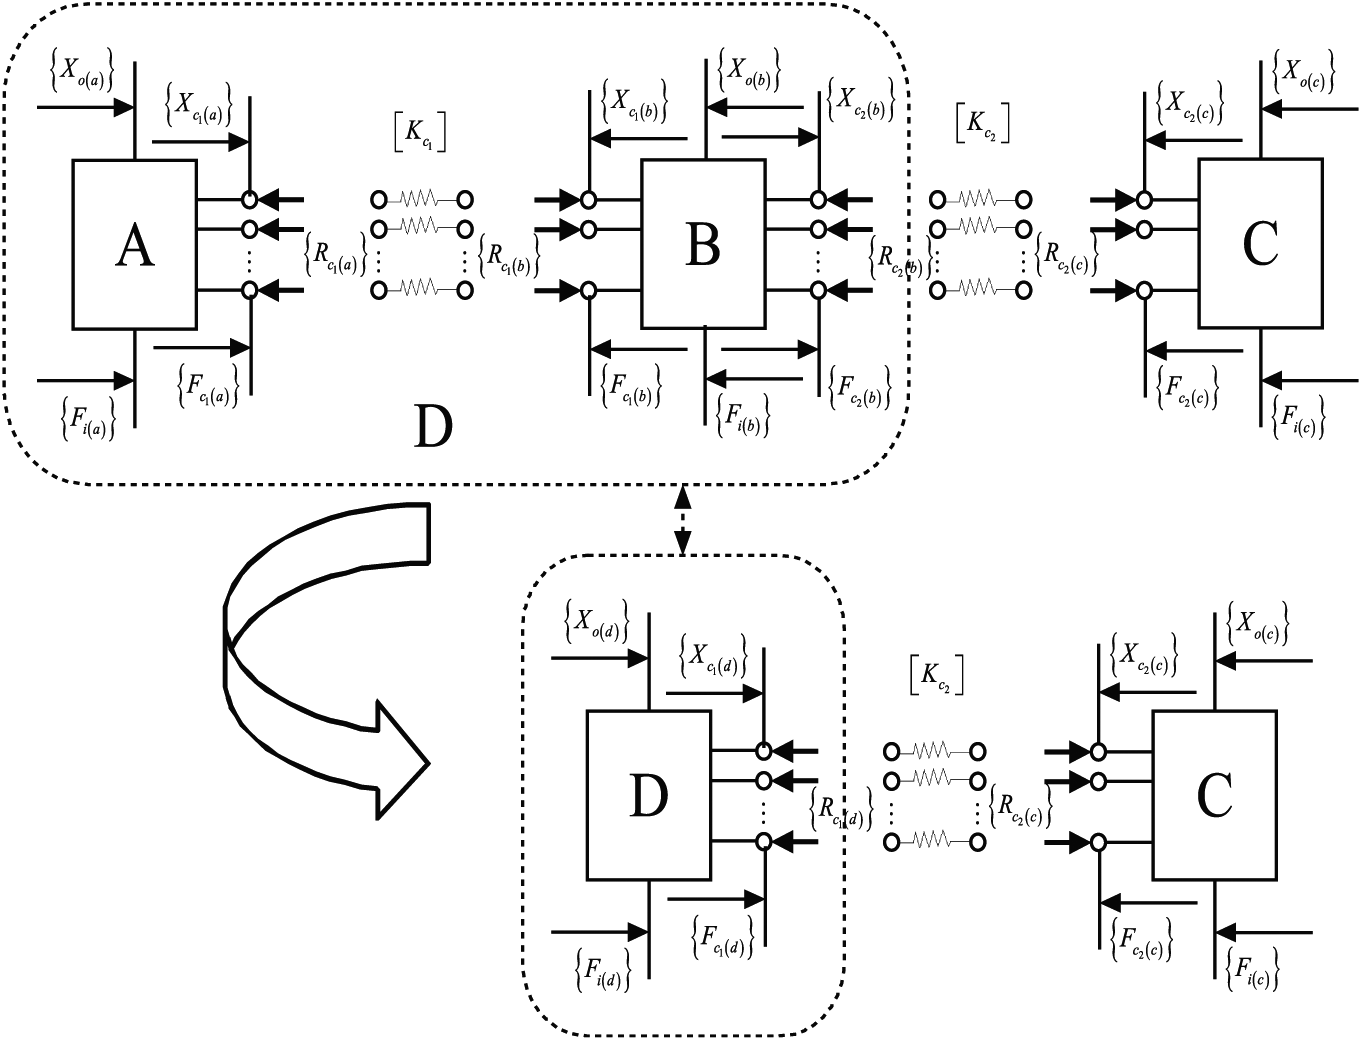
A two-stage serial isolation system.
After further expansion, the system FRF
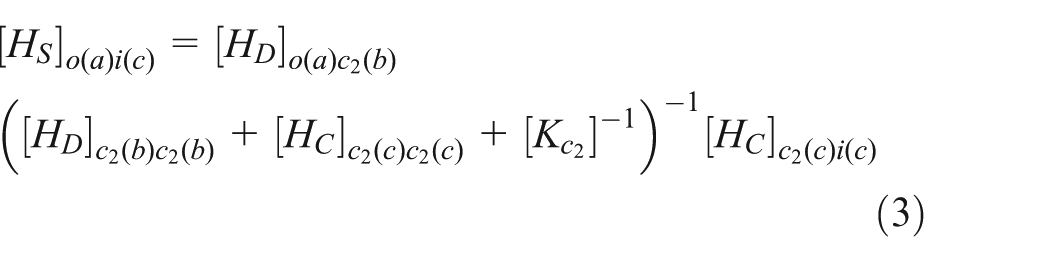
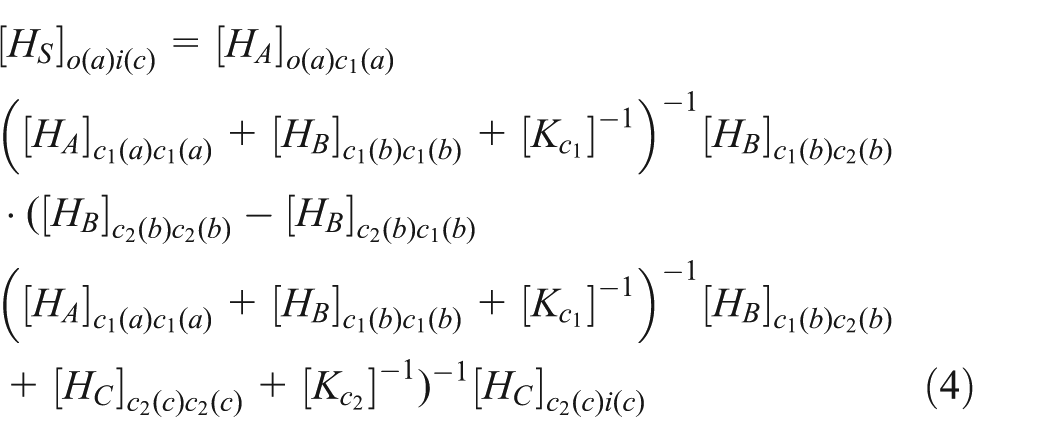
Since the structure D consists of substructures A and B, the FRFs of structure S can be finally expressed by the FRFs of substructures A, B, and C
From the derivation above, the source-path-receiver model of two-stage serial vibration isolation system is developed. The system-level FRFs of coupled structure can be predicted by the calculated FRFs of substructures and dynamic stiffness of the joints through the source-path-receiver model.
Substructure property identification model
In order to obtain the FRFs of substructures, the coupled structure needs to be decoupled. However, this process usually costs quite a lot of time and labor. Therefore, it is better to identify substructure property in coupling condition. In this section, the FRFs of substructures and the dynamic stiffness of the joints of the two-stage serial vibration isolation system will be predicted in accordance with the system-level FRFs.
and substructure A
In order to get the FRFs of the substructure A and the coupling dynamic stiffness


and substructure C
In the same way, we can also treat substructures A and B as a new substructure to get the FRFs of the substructure C and the expression of the coupling dynamic stiffness


Substructure B
The FRFs of substructure B need to be derived step by step. First, we let

According to the derivation of inverse substructuring method 32


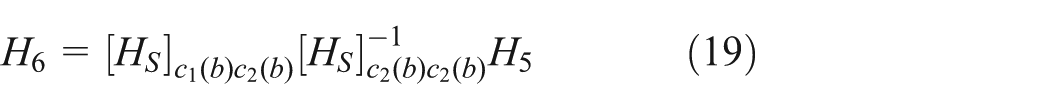
Here, H1, H2, and H3 can be expressed as


Applying the inverse substructuring method to two-stage vibration isolation systems, we obtain


Up to this point, the substructure property identification model of the two-stage serial system is developed (equations (5)–(22)). The FRFs of substructure and dynamic stiffness of the joints can be predicted by the system-level FRFs of coupled structure. To sum up, the source-path-receiver model and the substructure property identification model make up the transfer path model of the two-stage serial vibration isolation system.
FEM-based validation
In previous chapter, the transfer path model of a two-stage serial vibration isolation system is developed. To validate the model, a FEM simulating the system is built.
Validation process
A two-stage serial isolation system model can be validated by the following steps. First, a simplified two-stage serial isolation system model is set up by CATIA and then the FEM of both the substructures and coupled system can be obtained. The structural FRFs can be obtained by MSC Patran/Nastran and the acoustic FRFs by LMS Virtual.lab. Then, the system-level and substructure FRFs matrix can be built by MATLAB program. Then, we substitute the system-level FRFs into substructure property identification model. The substructure FRFs matrix and coupling stiffness can be predicted using MATLAB program. By comparing the substructure FRFs from the inverse formulation and exact values, the substructure property identification model is thus verified. Then, we substitute the calculated FRFs of substructures and coupling stiffness into the source-path-receiver model. The system-level FRFs of coupled structure can be predicted using MATLAB program. By comparing the system FRFs from the direct FRF substructuring formulation and the direct response calculations, the source-path-receiver model is verified as well.
Frequency response analysis based on FEM
The finite element modeling
Since a vehicle system is a typical two-stage serial vibration isolation system, a simulation model is set up here to validate the transfer path model proposed above as shown in Figure 5. Substructures A, B, and C represent the vehicle body, the subframe, and the powertrain, respectively. Substructures A and B are connected via four bushings simulating the subframe mounts; substructures B and C are connected via three bushings simulating the powertrain mounts.

The two-stage serial system model simulating a vehicle system.
Then, the entity models of substructures A, B, and C from CATIA are imported into Hypermesh to generate the FEMs. The FEM of the coupled system can be obtained by assembling FEMs of three substructures through seven bushings.
In the FEM, each bushing is represented as a set of three orthogonal scalar springs and damping elements. They located at the coupling coordinates between the substructures. According to dynamic stiffness of the bushing measured by tests, the spring and damping value is set to (a) axial stiffness: 709 N/mm, axial damping: 0.48 Ns/mm; (b) radial stiffness: 7650 N/mm, radial damping: 3.8 N s/mm.
FRF analysis
The structural and acoustic FRFs of substructures A, B, and C and coupled structure S can be obtained by MSC Patran/Nastran and LMS Virtual.lab. The system target response includes the vibration acceleration at point o(a) in X-, Y-, and Z-directions and the sound pressure at point os(a). The coupled structure S in Figure 5 shows that the excitation points of coupled structure S include A1, A2, A3, A4, B1, B2, B3, B4, B5, B6, B7, C5, C6, C7, and i(c); its response points include the vibration acceleration response point o(a), A1, A2, A3, A4, B1, B2, B3, B4, B5, B6, B7, C5, C6, C7, and i(c), and the sound pressure response point os(a). According to Figure 5, the excitation points of substructure A includes A1, A2, A3, and A4; and the response points include the vibration acceleration response point o(a), A1, A2, A3, and A4 and the sound pressure response point os(a). The excitation points and the response points of substructure B both include B1, B2, B3, B4, B5, B6, and B7. And the excitation points and the response points of substructure C include C5, C6, C7, and i(c). After every excitation point has been exerted in X-, Y- and Z-direction individually, the responses at vibration acceleration response points and sound pressure response points can be obtained. Moreover, the coupling point Ki (i = 1, 2,…, 7) is defined as follows.
As shown in Figure 5, Ki (i = 1, 2, 3, 4) represents the dynamic stiffness of the bushing between point Ai and point Bi, while Kj (j = 5, 6, 7) represents the dynamic stiffness of the bushing between point Bj and point Cj.
Comparison of predicted results and exact values
Validation of the substructure property identification model
According to the validation process mentioned above, the validation of the substructure property identification model of the two-stage serial isolation system is carried out. The predictions of the following FRFs will be verified:
Free substructure FRFs of substructure A:
Free substructure FRFs of substructure B:
Free substructure FRFs of substructure C:
Dynamic stiffness at coupling point K1 and K7:
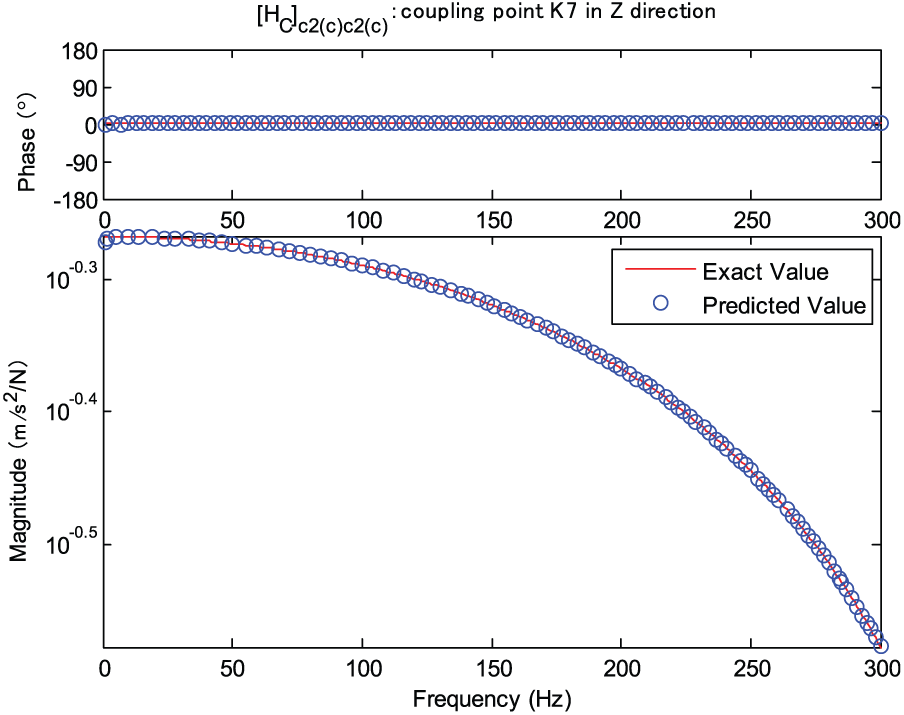
The validation process is described in the previous section. Due to the length limitation, only a part of the figures are shown here. Figures 6–10 show the comparison of the substructure-level FRFs from the inverse formulation and the direct frequency response. It can be seen that the predicted results match very well with the exact values. Thereby, we can come to the conclusion that the FRFs of substructures and coupling stiffness can be predicted by the system-level FRFs through the substructure property identification model of the two-stage serial isolation system.


FRFs of substructure A.

FRFs of substructure C.

FRFs of substructure B.
Validation of the source-path-receiver model
As mentioned in the previous section, the calculated FRFs of substructures and coupling stiffness are substituted into the source-path-receiver model to predict the system response

System response: (a) response point o(a) to excitation point i(c) in Z direction; (b) response point os(a) to excitation point i(c) in Z direction.
Error sensitivity analysis
The measurement in the FEM is carried out in an ideal condition. Actually, random noise is unavoidable in the actual measurement of FRFs. Random noise may reduce the accuracy of the predicted FRFs and lead to unperfected respond of the estimated FRF to the true transfer function between the input and output. 10 Hence, the random noise is introduced into the system-level FRFs for error sensitivity analysis and then the influence on the substructure FRFs is quantified by comparison. Additional care should be taken, when acquiring the system-level FRFs which are most sensitive to the random error.
In this section, in order to improve the analysis, the relative Frobenius norm error is used to represent the relative error at any frequency 10

where
The overall error level within the frequency analysis range is represented in the form of the root mean square (RMS)
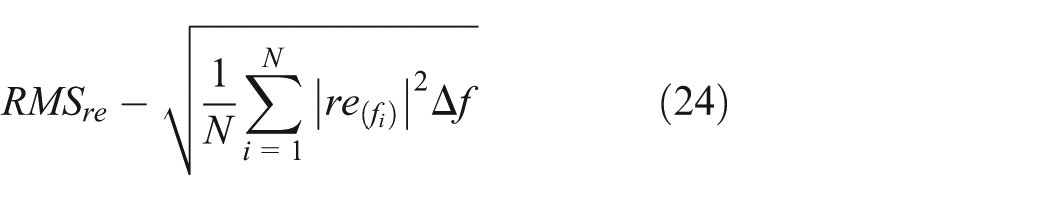
where
Inputs and outputs of error sensitivity analysis
According to the transfer path model of the coupled serial two-stage isolation system, the detailed calculation process of the system response can be obtained. On the basis of the calculation process, the system-level FRFs as the inputs of the analysis are as follows:
Sensitivity analysis of different input FRFs
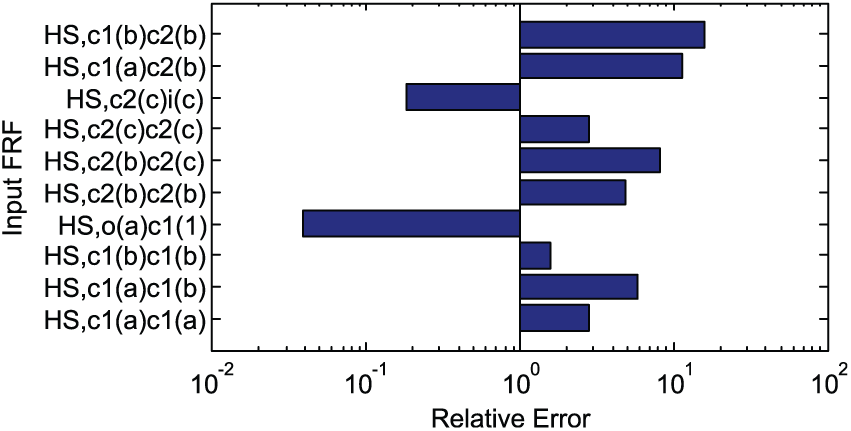
When substructure property identification model is used to calculate the substructure transfer functions, each of them will be influenced by several system transfer functions. Therefore, these input transfer functions should be carefully measured in the test. In order to find out that which input transfer functions are most sensitive to the output one, we introduce, for example, 5% random error of the same magnitude into the system-level FRFs. Then, the error sensitivity analysis for the nine independent outputs of the substructure property identification model and the system response FRF can be carried out. Due to length limitation, only part of the figures is shown, but all the results can be found in Table 1.
Figure 12 shows the effect of 5% input error on the prediction error of
Figure 13 shows the effect of 5% input error on the prediction error of substructure A. It is obvious that additional care should be taken, when acquiring the system-level FRFs
Figure 14 shows the effect of 5% input error on the prediction error of substructure C. Obviously, the prediction error is mainly determined by system-level FRF
Figure 15 shows the effect of 5% input error on the prediction error of substructure B. It can be seen that the prediction error is more sensitive to the random error added to
Figure 16 shows the effect of 5% input error on the prediction error of system target FRF
Error sensitivity analysis of different system-level FRFs.

FRF: frequency response function.


The results of error sensitivity analysis of different system-level FRFs are shown in Table 1.
Application of TSVD
From the error analysis above, it can be seen that the transfer path model is very sensitive to the random noise. This is because the ill-conditioned inverse problem involved in the model may magnify the introduced error. Here, the TSVD is applied to address this problem.
Possible errors in the experiment are unknown, so 5%, 25%, and 50% random errors are introduced into all the input FRFs as shown in Table 1 to analyze the influence of different noise levels on the prediction accuracy. Here due to the length limitation, only part of the comparison between the relative error of the predicted FRFs using the direct-inverse method and TSVD is shown in Figure 17. Figure 18 can be obtained through both results using root mean square relative error. The conclusions are as follows:
The direct-inverse method is very sensitive to errors from the input FRFs. Even if only 5% error is introduced, the prediction errors increase by the range of the 10–1000 times within the frequency band. However, when the magnitude random error from input FRFs increases, the prediction errors do not increase obviously.
The prediction errors have something to do with the inverse times of input FRFs. So the prediction error of the dynamic stiffness at coupling interface is smallest due to the most simplified calculation process and the least inverse times. On the contrary, the prediction error of
It can be seen in Figure 18 that TSVD can effectively reduce the relative error of the predicted results. In general, it is especially obvious when compared to direct-inverse method with bigger relative error. As shown in the predicted FRFs of substructures A and B, when the input noise level is higher, its effect is stronger.

Error analysis at different noise levels using direct-inverse method and TSVD (left: by direct-inverse method; right: by TSVD): (a)

Comparisons of direct-inverse method and TSVD.
Conclusion
The two-stage serial vibration isolation system has been already widely used in various mechanical systems; however, such a system has not been further studied by the researchers. In this article, transfer path model of the two-stage serial system that consists of the substructure property identification model and the source-path-receiver model is first developed using FRF-based substructuring method. The model is programmed by MATLAB. Next, the transfer path model is validated through FEM. The structural FRFs are obtained by MSC Patran/Nastran and the acoustic FRFs by LMS Virtual.lab. Then, the system-level and substructure-level FRFs are built by MATLAB program. The FRFs of substructures and the joint stiffness are predicted by the system-level FRFs through the substructure property identification model; the system response of coupled structure is predicted by the calculated FRFs of substructures and joint stiffness through the source-path-receiver model. The results of the simulation reveal that the predicted system response and substructural FRFs match quite well with the exact values, which verified the proposed transfer path model.
To further address the issue, random noise is introduced into several system-level FRFs for error sensitivity analysis. By comparing its influence on the substructure FRFs, the most sensitive input FRFs are found. Therefore, special care should be taken when acquiring these FRFs. In addition, random noise at different levels is introduced into all the input FRFs to analyze their influence on the prediction accuracy. The direct-inverse method and the TSVD are both applied. The analysis results show that using the direct-inverse method, the transfer path model is very sensitive to the errors from input FRFs, while the prediction errors of the substructural FRFs and system response can be effectively reduced by TSVD.
In general, an example of a detailed acoustics and vibration TPA process is provided in this article. The proposed model further studies the dynamic theory of the multi-stage vibration isolation system through TSVD and FEM. Furthermore, it is worth noting that this transfer path model can be applied in any mechanical systems.
Footnotes
Appendix 1
Academic Editor: Rahmi Guclu
Declaration of conflicting interests
The author(s) declared no potential conflicts of interest with respect to the research, authorship, and/or publication of this article.
Funding
The author(s) disclosed receipt of the following financial support for the research, authorship, and/or publication of this article: This work was supported by the National Natural Science Foundation of China (grant number 51205290) and the Fundamental Research Funds for the Central Universities (grant number 1700219118).