
Abstract
Cooling after the implementation of a high-density integrated circuit manufacturing process using internal air flow within the object to be cooled is often performed in the industry. In this study, the cooling performance is predicted using a numerical simulation model and examined by the experiment when the flow rate is within 30 L/min (ANR). Three types of flow passage shapes are made with the plate size of 13.4 mm × 13.1 mm and cooling performances are compared with each other. As a result, it was confirmed that the cooling time reduced when the number of turns in the flow passage was increased and the cooling efficiency reduced when the number of turns in the flow passage was increased. It is considered that the cooling system using a flow passage with four turns is the optimal system for practical use.
Introduction
Cooling is a process that lowers the temperature of an object by releasing heat to another location and absorbing heat from the object. Cooling can be performed by various methods. One cooling method entails using a phase transition to absorb heat from the object by the melting and evaporation of another substance;1,2 in today’s modern times, this is often done using laser irradiation. 3 The most common cooling method uses heat exchange to bring fluid at a lower temperature into contact with the object. Several kinds of fluids are used for cooling, such as water, oil, and air. 4 For the air cooling, most researches are achieved on low pressure region and the research on the short flow passage with the bending part in the pneumatic system with pressure of several hundred kilopascals is not found so much.
In the cooling of electrical goods, air is often used because of its cleanliness. Cooling methods using internal air flow in the object, as shown in Figure 1, are often used for high-density integrated circuit (IC) manufacturing cooling processes after mounting because there is a need to cool the object locally. To reduce the thermal load during product manufacturing, it is necessary to cool the object within tens of seconds during mounting.

Cooling system using internal air flow.
Cooling time is shortened by increasing the flow rate during cooling. However, when assuming an actual production line, the flow rate that can be used for cooling is fixed in order to use compressed air for other pneumatic equipment in the factory. Inside the cooling target, a flow passage for flowing air is usually made. When the flow rate is constant, cooling performance differs depending on the shape of the flow passage.
In this study, the cooling performance is predicted using a numerical simulation model and examined by the experiment as flow passage shape varies when maximum supply pressure is 0.5 MPa (gage) or below.
Cooling system using internal air flow
Cooling system
The picture of pulse heater is shown in Figure 2. The mounting procedure is as follows. First, solder is used to mount the IC chips on the printed circuit board. The solder is melted by heating the apparatus. After melting, the solder is cooled and solidified by passing air in the flow passage between the heater and the base.
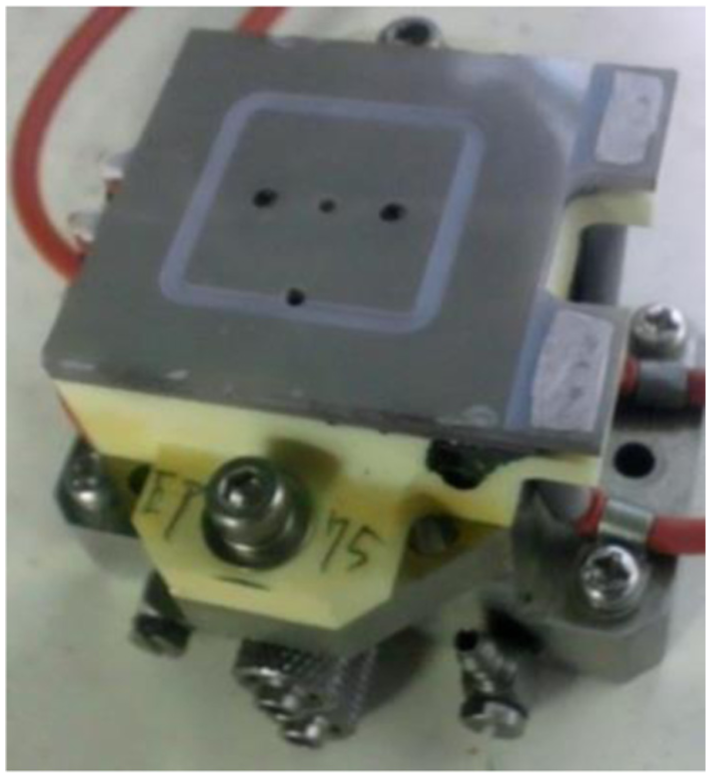
Pulse heater.
As mentioned in the previous section, the flow rate that can be used for cooling is fixed. When the flow rate is constant, cooling performance depends on the shape of the flow passage. In this study, a simulation model is constructed to design the shape of the flow passage so that cooling performance is improved and the cooling performance in the flow passage is predicted using the simulation model. After predicting the performance, the result is experimentally confirmed.
Design parameters of the flow passage
Design guidelines for the shape of the flow passage examined in this study are as follows:
The area of plate is 13.4 mm × 13.1 mm;
Number of turns is two to four;
The distance between adjacent passages is 1 mm;
The depth of the flow passage is 0.6 mm.
Figure 3 shows the shape of the flow passages based on the above design guidelines. With an increase in the number of turns in the flow passage, the width of the channel and the curvature radius of the turned parts decrease. In section “Simulation,” the cooling performance of the cooling system using the flow passage shown in Figure 3 is compared using the simulation model.

Shape of flow passage: (a) two turns, (b) three turns, and (c) four turns.
Simulation
Numerical analysis method
Figure 4 shows the flowchart of the simulation model. First, the flow field inside the flow passage is calculated. Additionally, the temperature change of the cooling object is calculated by the heat exchange obtained from the flow field.
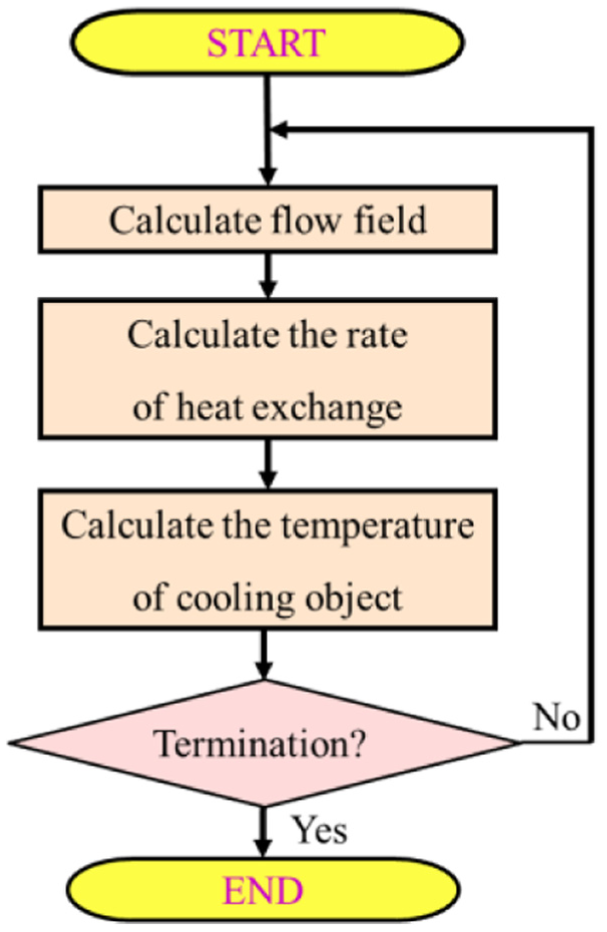
Flowchart of simulation.
This calculation assumes a one-dimensional model. The flow field is calculated according to governing equations (1)–(4): 5
Continuity equation

State equation

Energy equation
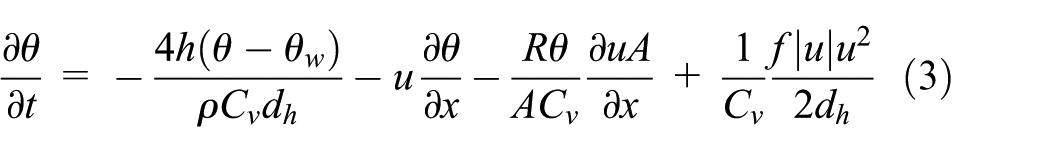
Momentum equation

The characteristic length is the hydraulic diameter of rectangular flow passage as equation (5)

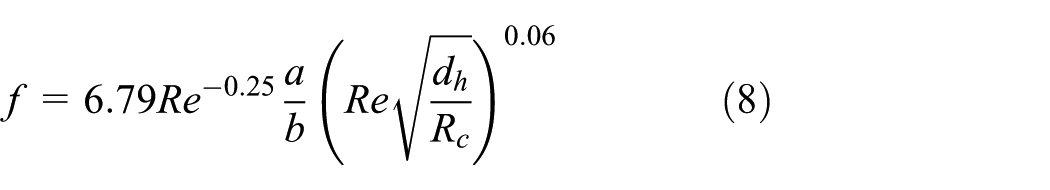
The flow passages of this study are created as a combination of straight parts and turned parts. The friction factor and Nusselt number of the straight parts are different from those of the turned parts. For the straight parts, the friction factor is given in equation (6). 6 The Nusselt number given in equation (7) is used because this equation was useful in the Prandtl number range of gases (0.5–1.0) and Re < 105. 7 In equation (6), the section coefficient is adjusted to 0.316/2 because the cross-section is a rectangle with a long side. 6 For the turned parts, the friction factor given in equation (8) and the Nusselt number given in equation (9) are used. 8
Straight parts


Turned parts

As the turned parts are continuously disposed, the total pressure loss is less than the pressure loss when using a turned part alone. Therefore, the friction factor of the turned parts (equation (10)) is given by factor c. c is calculated by equation (11) derived from the approximate curve of Figure 5. 9 The approximate curves are derived by least squares method with R2 = 0.999


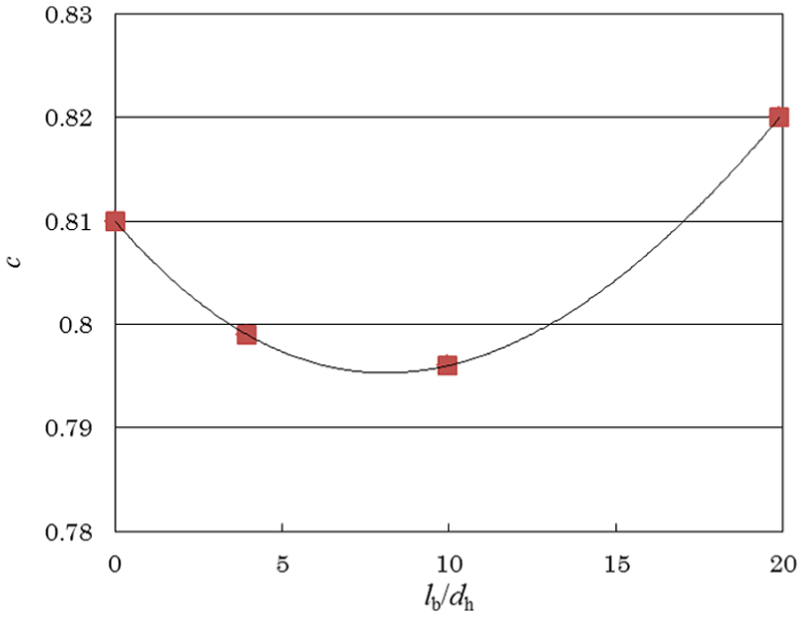
Interaction factor of Nusselt number.
The viscosity and thermal conductivity of the air as changed by the temperature are calculated by equations (12) and (13)


Next, heat exchange is discussed. Because the size of the flow passage considered in this study is very small, the thermal conductivity is ignored. Therefore, heat exchange takes into account the forced convection heat transfer, natural convective heat transfer, and radiation. The forced convection heat transfer is the heat exchange between the cooling object and the internal air. Heat exchange between the atmosphere and the surface of the cooling object occurs via radiation and natural convection heat transfer. The rate of heat exchange by forced convection heat transfer is calculated by equation (14) from the Nusselt number (8) and equation (7)

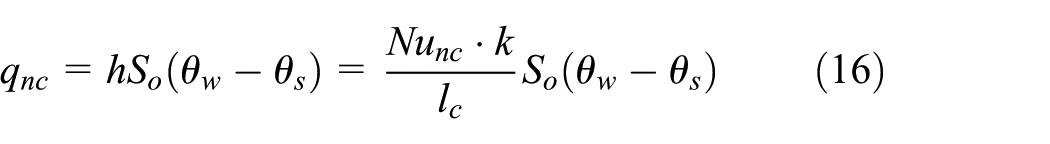
The Nusselt number for natural convection heat transfer is derived from equation (15), and the rate of heat exchange is calculated using equation (16)

Radiation is calculated as in equation (17)

The emissivity of SUS303 is assumed to be 0.15.
The temperature change of the cooling object is calculated from the total value of the rate of heat exchange that is the sum of equations (14), (16), and (17)

Simulation results and discussion
Figure 6 shows the rate of heat exchange when flow at the rate of 30 L/min (ANR) is circulated through the flow passage with two to four turns when the temperature of the cooling object is 373, 473, and 573 K. From this figure, it is seen that the rate of heat exchange becomes larger with an increase in the number of turns in the flow passage. The reason for this is the increase in the heat transfer coefficient; this increase, in turn, occurs for the following three reasons.

Rate of heat exchange: (a) θw = 573 K, (b) θw = 473 K, and (c) θw = 373 K.
The first reason is the increase in the Nusselt number due to an increase in the Reynolds number. The Reynolds number is shown in equation (19)

From equation (19), when the flow rate is constant, the Reynolds number is inversely proportional to the sum of the width and depth of the flow passage. The width of the flow path decreases with the increase in the number of turns in the flow passage. Therefore, the Nusselt number increases. Because the heat transfer coefficient is proportional to the Nusselt number, the heat transfer coefficient increases.
The second reason is the reduction in the characteristic length. Because the width of the flow path narrows with an increase in the number of turns in the flow passage, the characteristic length decreases. Because the heat transfer coefficient is inversely proportional to the characteristic length, it increases.
The third reason is the reduction in the curvature radius of the turned parts. The Nusselt number of the turned parts increases with a decrease in the curvature radius of those parts.
Because of the three above-mentioned reasons, the rate of heat exchange increases as the number of turns in the flow passage increases. Therefore, for the shape of the flow passage proposed in this study, we can predict that the cooling time of the cooling device with a flow passage with four turns is shortest and that the cooling time of the cooling device with a flow passage with two turns is longest. Section “Cooling experiment” presents cooling experiments carried out using the cooling system in order to validate the predictions by simulation.
Cooling experiment
Cooling system and experimental circuit
Figure 7 shows the three-dimensional drafts and photograph of the cooling system used in the cooling experiment. The material of flow passage is SUS303. The created flow passages are composed of two patterns: one pattern of four turns to show that its cooling time is shortest and one pattern of two turns to show that its cooling time is longest. The bases are set up at the bottom of the flow passage. This base is made of adiabatic material.
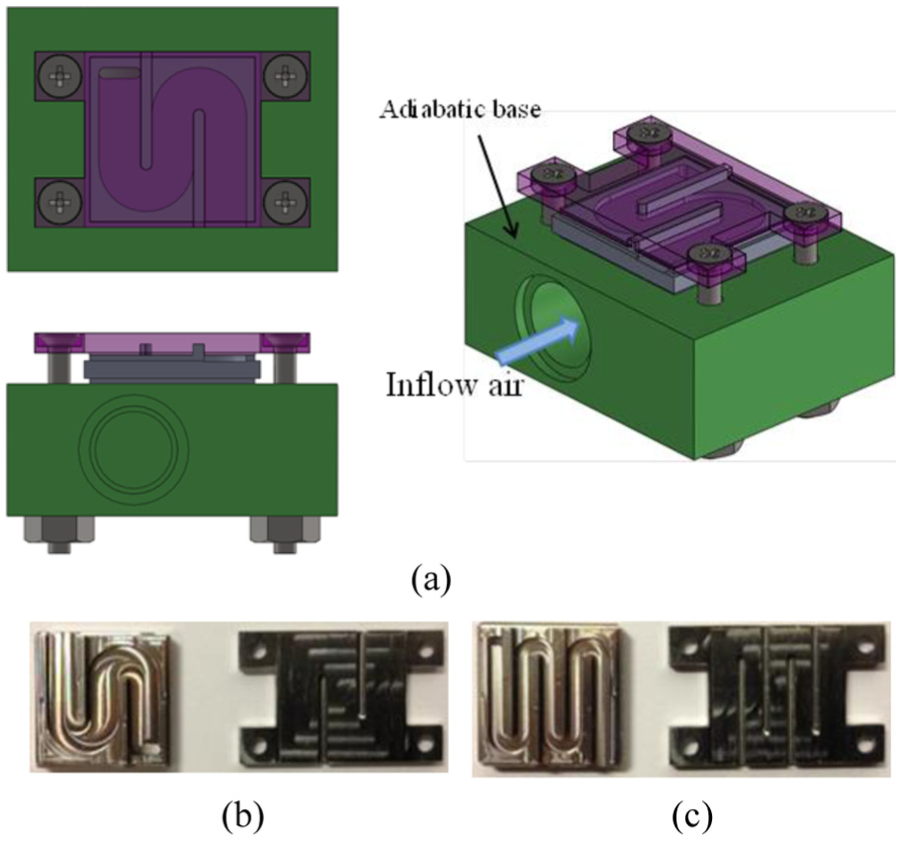
Cooling system: (a) three-dimensional draft, (b) two turns and (c) four turns.
Figure 8 shows the experiment circuit. The pressure upstream of the cooling device is adjusted using a regulator to set the value of the target flow rate. An isothermal chamber reduces the noise of the measured value by absorbing the air temperature change when the air flows to the cooling system. A flow meter is incorporated along with a temperature sensor and pressure sensor. The flow rate, upstream pressure, and temperature of air flowing of the cooling system are measured by these sensors. The model numbers of the sensors used in the experiment are shown in Table 1.
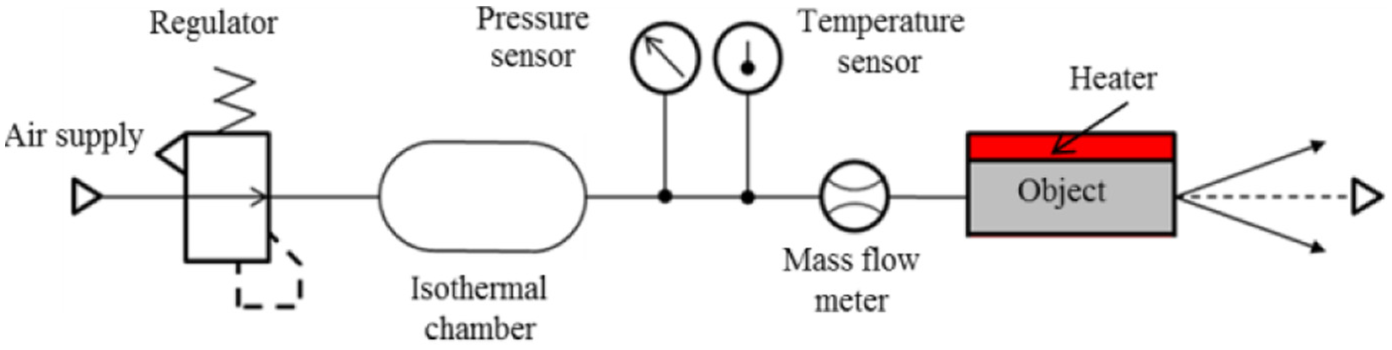
Experimental circuit.
Model number of sensors used in experiment.

Experimental procedure
The temperature change of the cooling system during the cooling process is measured under a variety of flow rates employed in the cooling system heated to 573 K. The experimental procedure is outlined below:
The cooling system is heated to 650 K using the heater.
Measurements are started using the sensors to measure upstream pressure, flow rate, and the temperature of the cooling system.
The temperature of the cooling system is made uniform by waiting for 3 s after releasing the heater from the cooling system.
After waiting for 3 s, the upstream pressure of the cooling system is adjusted by the regulator and the air flow.
Until the temperature of the cooling system reduces to 373 K, data are recorded by the sensor.
The upstream pressure is varied by the regulator, and steps (1)–(5) of the experimental procedure are repeated.
Experimental results and discussion
Figure 9 shows the simulation results and experimental results of the cooling process when a flow rate of approximately 30 L/min (ANR) is used in cooling systems with four turns and two turns. The solid line shows the experimental results of the temperature change of the cooling object, the dashed line shows the simulation results, and the dotted line shows the time variation of the flow rate.

Cooling process: (a) two turns and (b) four turns.
This figure shows that the flow rate increases as the time passes. Because the viscosity of air reduces as the cooling object temperature decreases, the flow rate increases.
Maximum error of temperature between the experiment and simulation is about 14 K. The base for the flowing air in the flow passage is made of adiabatic material. Therefore, in this simulation, it is assumed that the temperature of the base does not increase during heating. Thus, the effect of heat conduction between the cooling system and the base is ignored. However, because the temperature of this base becomes approximately 420 K during heating, the effect of heat conduction cannot be ignored. This is the reason for the above-mentioned error.
Figure 10 shows the relationship between the cooling time and the average flow rate used for cooling. The cooling time is the time required for cooling the system from 573 to 373 K.

Cooling time.
Because the flow rate used for cooling is limited, it is necessary to compare the cooling using a constant flow rate. As shown in the approximated curve of this figure, the cooling time of the cooling system using four turns is less than that of the system using two turns. These results are consistent with the predictions made from the simulation.
As shown in Figure 10, the cooling time is not halved when the flow rate is doubled. Because the Nusselt number reduces with the flow rate, the cooling time is not halved when the flow rate is doubled.
Next, we discuss about the cooling efficiency for two and four turns. The cooling efficiency proposed in this article is given by equation (20)
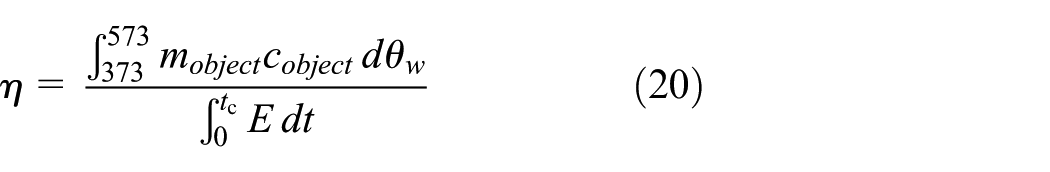
This efficiency is expressed as the ratio of the energy used for circulating air to cool the system to the amount of heat removed from the system. The energy used for circulating air is obtained by integrating the air power given by equation (21) over time. Air power is the power required to circulate compressed air 10

Figure 11 shows the relationship between the average flow rate used in the cooling and the cooling efficiency given by equation (21).

Cooling efficiency.
In the approximated curve of this figure, the cooling efficiency of the system using four turns is less than that using two turns. The flow path elongates with an increase in the number of turns in the flow passage. Therefore, the air power is high because the upstream pressure of the system required for circulating air at the same flow rate increases. Because of this, the cooling efficiency of the system using four turns is less than that using two turns.
When the flow rate is low, the difference in efficiency between the system using two turns and that using four turns is large. However, the efficiency is nearly constant when a flow rate of 30 L/min (ANR) is used in the actual cooling. Therefore, because the cooling time is shortest, the cooling system using a flow passage with four turns is the optimal system for practical use.
Conclusion
Using a simulation model, we predicted the cooling performance of a cooling system with a flow passage proposed in this article. After predicting the performance, we performed cooling experiments. From the measurement and simulation results, the following conclusions for the proposed flow passage were drawn:
The cooling time reduces when the number of turns in the flow passage is increased.
The cooling efficiency reduces when the number of turns in the flow passage is increased.
The cooling system using a flow passage with four turns is the optimal system when maximum supply pressure is 0.5 MPa (gage) or below.
Footnotes
Appendix 1
Academic Editor: Bo Yu
Declaration of conflicting interests
The author(s) declared no potential conflicts of interest with respect to the research, authorship, and/or publication of this article.
Funding
The author(s) received no financial support for the research, authorship, and/or publication of this article.