
Abstract
Pathological tremor is an approximately rhythmic movement and considerably affects patients’ daily living activities. Biomechanical loading and functional electrical stimulation are proposed as potential alternatives for canceling the pathological tremor. However, the performance of suppression methods is associated with the separation of tremor from the recorded signals. In this literature, an algorithm incorporating a fast Fourier transform augmented with a sliding convolution window, an interpolation procedure, and a damping module of the frequency is presented to isolate tremulous components from the measured signals and estimate the instantaneous tremor frequency. Meanwhile, a mechanism platform is designed to provide the simulation tremor signals with different degrees of voluntary movements. The performance of the proposed algorithm and existing procedures is compared with simulated signals and experimental signals collected from patients. The results demonstrate that the proposed solution could detect the unknown dominant frequency and distinguish the tremor components with higher accuracy. Therefore, this algorithm is useful for actively compensating tremor by functional electrical stimulation without affecting the voluntary movement.
Introduction
Pathological tremor may be induced by the neurological disorders such as Parkinson disease and essential tremor. It usually occurs in the upper limb of patients with a roughly sinusoidal profile and high frequency (>2 Hz). 1 Moreover, the frequency of the tremulous motion is non-stationary and slowly varies within the range of ±1.5 Hz around the modal frequency. 2 The disability induced by the pathological tremor impacts the individual activities of daily living, for example, eating or writing, and even brings social embarrassments.
The treatments of tremor based on pharmacology, deep brain stimulation (DBS) 3 are proposed. However, the side-effect and the high cost limit their application. Therefore, the biomechanical loading4,5 and several novel human-machine interface devices, for example, joysticks 6 and hand-held surgical device, 7 were also developed to cancel the involuntary motions. Meanwhile, the mechanical simulation systems were developed to provide mimicked tremor signals and to evaluate the performance of tremor suppression methods. A shaker force 8 or a direct current (DC) motor incorporated with an unbalanced mass 9 is used to provide excitation force for inducing the tremor. Besides, two pairs of springs are also employed as the antagonistic muscles around the joint in the later system in the later system. Recently, functional electrical stimulation (FES) is also proposed to excite the motor neurons by stimulating sensory nerve fibers of the antagonistic muscles.10,11 The sufficient stimulation pattern, for example, the adaptable frequency, amplitude, and pulse width of electric pulse, is important to effectively attenuate tremor. Meanwhile, the electric pulse is usually modulated by the control system with tremor signals as the activations or feedbacks. Therefore, the separation of tremor from measured signals and the estimation of instantaneous tremor parameters are essential to cancel tremor without affecting the voluntary motions.
The inherent phase lag and amplitude attenuation of the traditional digital low-pass or band-pass filters limit their application for distinguishing the tremor. Therefore, an adaptive band-pass filter (ABPF) was proposed to decrease the phase lag by modulating the center frequency of filters to match the dominant frequency of the input signals in real time. 12 However, the tremor frequency component is usually a range rather than a single frequency in the spectrum of recorded signals. Therefore, parts of the tremor signals around the dominant frequency will be attenuated through ABPF. Other widespread adaptive combined methods for tremor frequency/amplitude estimation with zero-phase lag are developed based on the gradient descent algorithm (least mean square (LMS)). The weighted Fourier linear combiner (WFLC) algorithm models any quasiperiodic signal as a modulating sinusoidal signal and tracks its frequency, amplitude, and phase by incorporating frequency adaptation procedure into FLC. 13 However, WFLC only adapts to the input signals with a single dominant frequency and the performance of WFLC would degrade in the case of tremor signals with two close frequencies. 14 The performance of bandlimited multiple Fourier linear combiner (BMFLC) comprising several FLCs in tracking the input signals is much better,14,15 Nevertheless, the frequency band of BMFLC is pre-defined, and BMFLC cannot adapt to the frequency of tremor signals in real time. Besides, a two-stage algorithm constituted by a critically dampened filter and WFLC and Kalman filter is also proposed to extract tremor patterns from raw data and to estimate the instantaneous tremor frequency and amplitude. 16 Recently, the empirical mode decomposition (EMD) and Hilbert spectrum (HS) are proposed to derive the time-varying frequency and to distinguish the tremulous and voluntary movements. 17 However, the end swing problem and the time-consuming limit its application in the tremor suppression.
Recently, the harmonic-analysis approaches based on the discrete Fourier transform (DFT) have been widely adopted in electric power systems due to low computation.18–21 Compared with the electric signals, the tremulous signals also have rough periodicity, sinusoidal profiles, and time-varying frequencies. Furthermore, the fundamental frequency instability and harmonic interference in the tremulous signals prevent the synchronous sampling. Therefore, a novel approach based on the fast Fourier transform (FFT) named sliding fast Fourier transform (SFFT) is developed to track the tremor frequency and extract the tremulous components from the recorded signals. In this method, a convolution window with good side-lobe behaviors 19 is employed to decrease the spectral leakage error and an interpolated FFT procedure with dual-spectrum line20,21 is also used to reduce the picket-fence effect.
Method
Description of the proposed algorithm
As shown in Figure 1, the frequency spectrum of the raw signal weighted with window is calculated by FFT and then the initial dominant frequency range of tremor is roughly determined with the frequency band (L) and the initial dominant frequency (fdom). Accordingly, the tremor signal is obtained by the inverse FFT. Meanwhile, a data vector is introduced to save the measured signal. Before that, the newly sampled tremor data are transmitted to the lowest element of a data vector; all elements shift to the right by a bit with the highest element being deserted. The frequency spectrum of the continuously updating data vector is obtained with a convolution window and then the peak of frequency spectrum is tracked by an interpolated procedure.
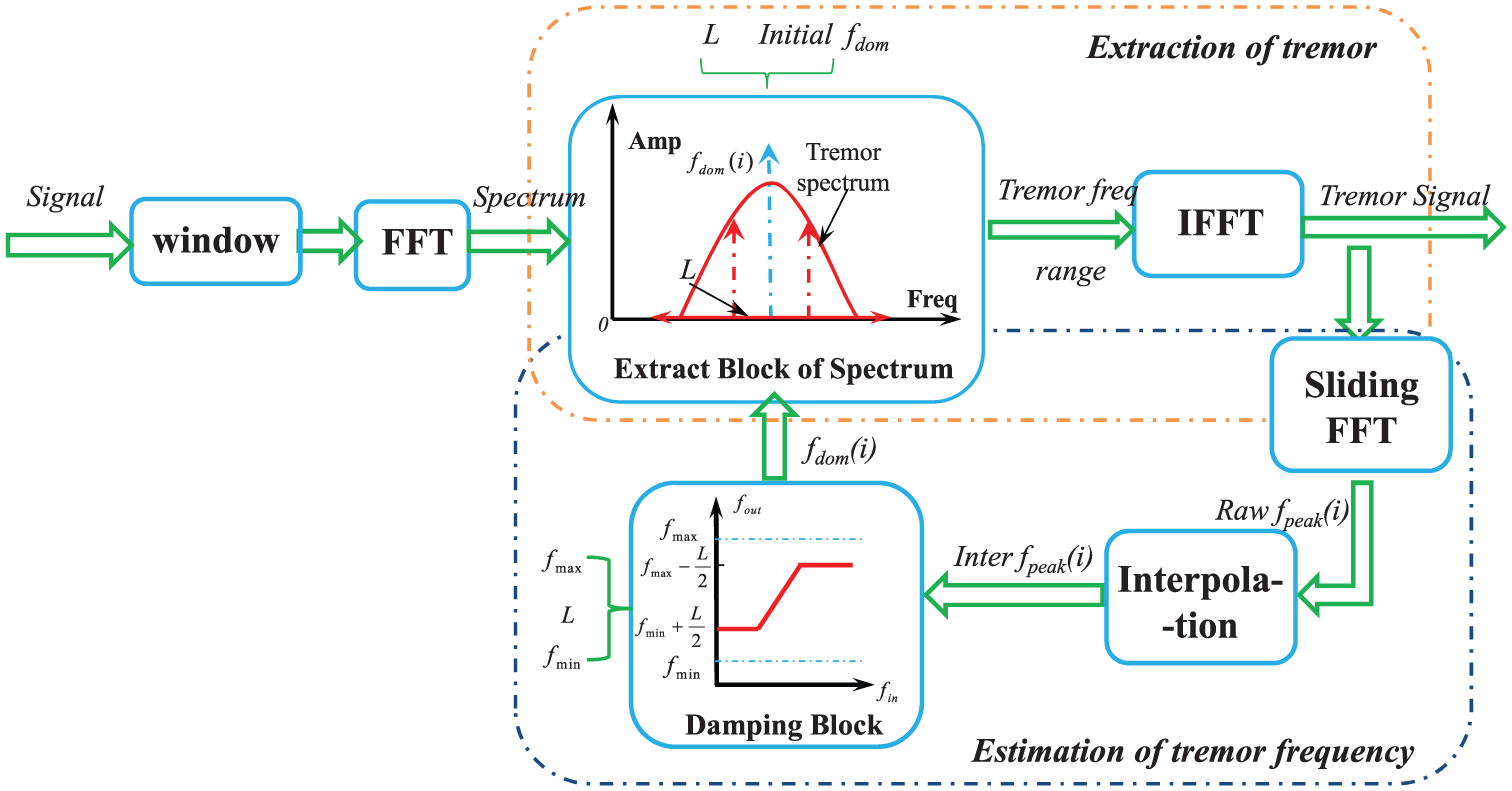
Block diagram of the proposed algorithm.
With the assumption that the calculated frequency is considered as the instantaneous frequency at the sampling time of the lowest element, the time-varying frequency is gradually derived and saved in the other vector initially defined as 0. Besides, the data vector is augmented with 0 for a more clear frequency spectrum. Moreover, the damping block is proposed to limit the frequency band within the maximum range avoiding the interference of high-frequency noises. Finally, the estimated dominant frequency (fdom(i)) is put forward to the extract block and to update the tremor frequency spectral. It is noted that the data vector is filled with 0 and the newly measured signals within the starting L sampling time. However, the data vector will be fully filled with the recorded data from (L + 1)th sampling time. Thereby, the estimated frequency in the starting period ([0, L]) may not match the actual frequency.
Implementation of the proposed algorithm
The tremor signals could be described by sinusoidal and cosine harmonics for its roughly periodic characteristic.18–21 The discrete form of tremor signal, x(n), at instant n is described by equation (1) with the sampled frequency of fs

where M is the total number and ki means higher order harmonics, respectively. fs is the sample frequency n = 0, 1, …, N − 1 is the sampled number, and f0 is the fundamental frequency. The relationship between fs and f0 is Nf = fs/f0. Ai and Bi are the amplitudes of the kith sinusoidal and cosine components. Ci (
Determination of the adapted window
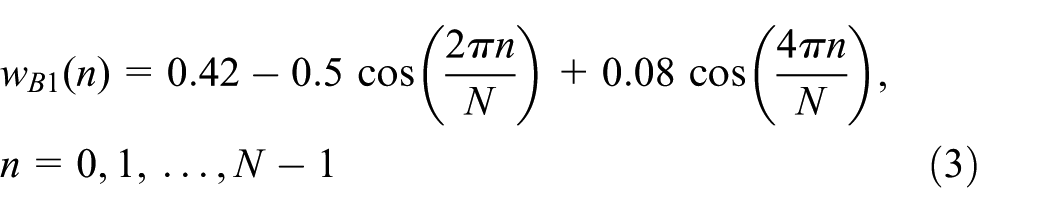
When the signals are weighted with windows, the estimation accuracy of harmonic parameters is related to the property of the adapted window. It is known that the frequency resolution is inversely related to the major lobe’s width of window’s spectrum. Meanwhile, the behaviors of side lobes impact the spectral leakage and the harmonic interference. 21 Therefore, the self-convolution of Blackman window shown in equation (2) is employed to improve the characteristic of side lobe for obtaining low amplitude and high roll off rate

where x is the number of Blackman window used for convolution and wB1(n) is indicated by equation (3)
When x Blackman windows with length of N are convoluted, a vector with length of xN − x + 1 is obtained and x − 1 zeroes are added to make the convolution sequence with length of L (L = xN). The discrete form of Blackman window’s spectrum function is shown as follows
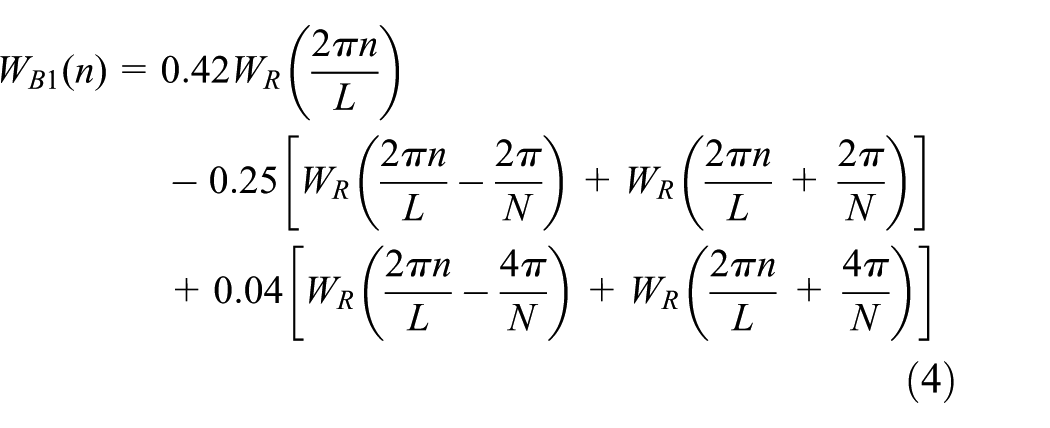
where n = 0, 1, 2, …, L − 1 represents the number of the spectrum lines and WR (·) is the spectrum of the rectangular window shown as equation (5)

Therefore, the responding FFT of the convoluted Blackman window could be derived as equation (6)

When the amplitude of the frequency response shown by equation (6) is set to 0, the width of the major lobe could be calculated as equation (7). If the value of L is fixed, it is found that the width of major lobe is inversely proportion to the length of Blackman window
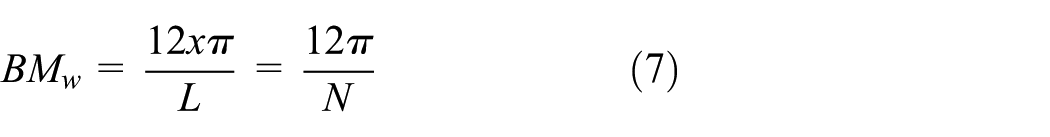
The amplitude–frequency diagram of the convoluted Blackman window with different orders is demonstrated in Figure 2 with the amplitude and roll off rate of side lobe being labeled. Compared with the results of the literatures,20,21 the amplitude is smaller and the side lobe rapidly decays with higher rate. Therefore, the trade-off between the major lobe width and the side-lobe roll off rate is necessary and the fourth-order convolution window is selected to explore the influence of window length.

Frequency responses of the adapted window with different orders.
Determination of the dominant frequency
The weighted signal xw(n) is obtained by multiplying the sampled signal x(n) with the adapted window w(n), namely, xw(n) = x(n)w(n). The DFT of x(n) is expressed as equation (8)

where k = 0, 1, …, M − 1 is the number of spectrum lines; ki defined as ki = fi/Δf is the number of the harmonic, where Δf = fs/M is the frequency resolution. If the minimum distance between spectral lines is larger than the main lobe width of the adopted window, the second part of equation (8), the imaginary part of the spectrum, can be ignored. 19 Moreover, the rapid decay of the side lobe also decreases the harmonic interference between adjacent components and the kith harmonic is selected for simplicity.20,21 Therefore, the approximation of formulation (9) is shown as follows

In the case of nonsynchronous sampling, it is assumed that the peak of spectrum represented by the kith spectral line locates between the maximum and second maximum amplitudes shown by k1th and k2th spectral lines (k1 ≤ ki ≤ k2), respectively. ki can be described as ki = λi + ξi, where λi means the integer and ξi is the fractional part (0 ≤ ξi < 1).Therefore, k1 and k2 can be demonstrated as k1 = λi and k2 = λi + 1, respectively. In addition, λi can be easily obtained by a peak search procedure, and an interpolation approach is employed to estimate the fractional part ξ.
For simplification, an asymmetric parameter (α) is defined as α = ξi − 0.5 for α ∈ [−0.5, 0.5]. The new relationships, k1 − ki = −α − 0.5 and k2 − ki = − α + 0.5, are derived. Meanwhile, the magnitudes of these spectral lines are calculated as

When the value of α changes between [0.5, 0.5], the responding values of β could be calculated following equation (10). Therefore, the inversed function of equation (10), α = f−1(β), can be derived by the fitting polynomial method. However, even if the values of βk and αk are given, where k = 0, 1, …, L − 1, L is the number of measured data, the estimated error γk = f−1(β) −αk is still inevitable. Therefore, the best-fitting polynomial is essential to minimize the mean square error between the fitting values and actual values as equation (11)
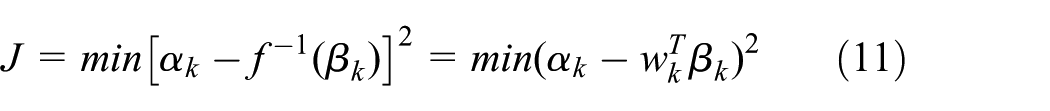
where

where M and µ are the degree of the polynomial and an adaptive gain parameter, respectively. Therefore, α is calculated by the calibrated fitting relationship. Once the value of α calculated, the frequency of the kith harmonic will be calculated by the improved equation (14)

In the limitation block, the dominant frequency is derived from the estimated peak frequency as expressed in equation (15)

where fmin and fmax are the minimum frequency and maximum frequency of all type pathological tremors, respectively. Thereby, the subject-specific tremulous frequency band slides following the estimated dominant frequency in a range limited by fmin and fmax in real time as shown in extraction block of Figure 1.
Extraction of the tremulous components
After determining the dominant frequency, the tremor components are separated from the measured signals based on the significant frequency difference between tremor and voluntary movement. The DFT of the sampled signal is shown in another form as in equation (16)

The real and imaginary parts of the DFT are demonstrated as equation (17)

From equation (17), it is concluded that the real part is the even function of k and imaginary part is the odd function of k. Meanwhile, they are the periodic function with the period of N shown in equation (18). Therefore, the amplitudes of the kth and (N − k)th frequency spectrum lines are equivalent

The frequency of DC component in signals is usually represented by the first spectrum line, and thus the frequencies starting from the second to the end are symmetric to the Nyquist frequency. For example, if a frequency range is defined as [k1, k2], and the symmetrical frequency band will be [N − k2 + 1, N − k1 + 1]. Therefore, the tremor frequency band could be separated by setting the spectrum lines outside of the band to 0. Finally, the tremor signals will be derived by the inverse FFT of the tremulous components in the spectrum.
Experiments and results
Simulated data and tremor patients’ data
The synthetic signals are generated based on MATLAB from the MathWorks, Inc. The different sudden frequency changes in tremor signals are mimicked by modulating the frequencies from 4 to 5, 6, 7, 8, 9, 10 Hz and back to 4 Hz, respectively. Meanwhile, a sinusoidal signal with constant frequency of 0.5 Hz is added to simulate the voluntary movement and a band-limited white noise (σ = 0.5) is used to imitate the interference. 2
The upper limb was commonly considered to be a second-order biomechanical system 4 with the input of the muscle force and the output of the movement (position, velocity, acceleration). For providing tremor signals, a mechanism system is designed to simulate the tremor at the elbow joint and wrist joint in the horizontal plane. The structure of the mechanical system is shown in Figure 3(a).

Structure and stress analysis of the mechanical system: (a) Structure of mechanical simulation system; (b) Characteristic parameters of the simulation system; (c); (d) and (e) Schematic diagram of the stress analysis of mechanical simulation system at three representative positions.
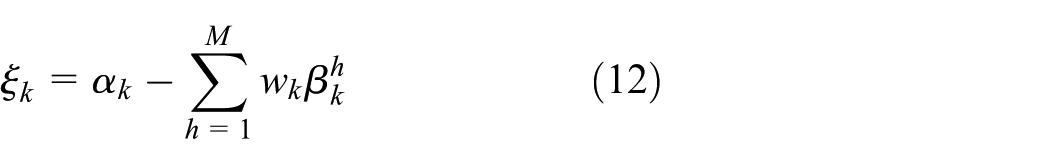
In this system, the motions of the upper limb and the forearm are both modeled as the vibration of the single pendulums around the first axis and the second axis, respectively. The rectangular cantilevers made from aluminum are employed to simulate the skeletons and the electric motors with synchronous belts are used to imitate the antagonistic muscles of joints. When the stepper motors start working, the circular plates will be activated to rotate through the synchronous belt and will generate the centrifugal force and the tangential force. Subsequently, the first cantilever and the second cantilever will vibrate with speeds ω1 and ω2, respectively. It is noted that the swing of the second cantilever also activates the vibration of the second axis by the flexible shaft for simulating tremor in the pronation/supination of the wrist joint. The voluntary movement is completed by artificially pulling the first cantilever with low-speed and high-amplitude force. The schematic diagram of stress analysis of the circular plate is shown in Figure 3(c)–(e), when the cantilevers are at three representative positions. The centrifugal force and the tangential force of the circular plate are derived as shown by equations (19) and (20), respectively

where fτ = mprαp, fr = mprωp2, mp and mc, ωp and ωc, and αp, and αc are the mass, angular velocity, and the angular acceleration of circular plates and cantilevers, respectively. l represents the length of the cantilevers and r is the radius of the plates. β and θ indicate the angle of the circular plate and the cantilevers between the initial position and the instantaneous position, respectively, as described in Figure 3(b). The parameters’ values of the simulated mechanism are tabulated in Table 1.
Values of mechanical system parameters.

In addition, the vibration angle of the cantilevers (θ) and the circular plates (β) could be derived from the integration of the angular velocity (ωp and ωc). Therefore, the relationship between the simulated tremor and the rotation of motor could be developed as shown in equation (21)

where θ0 means the initial angle of the cantilevers and is set as 0 in this study, γ = 180 − β is a parameter. Therefore, it is concluded that the tremor frequency could be modulated by the step motor’s rotation speed and the tremor amplitude could be tuned by the mass and radius of the circular plates and the cantilevers.
The simulated vibration angles are measured by the data acquisition system including self-designed acquisition card with LPC2124 and the photoelectric encoder, HEDSS ISC3806. Furthermore, the identify-direction circuit of joint movements is consisted of D-type positive-edge-triggered flip-flops (74HC74) and Nand gate chip (74HC00). Timing counters 1 and 2 are employed to record the forward and reverse joint angles with an interruption generated by the clock counter, respectively. Meanwhile, the recorded angles are sent to PC by RS232 and Joint Test Action Group (JTAG) is employed to test the LPC2124.
Seven representative groups of the mimicked rest tremor signals are selected to evaluate the performance of simulation system. The tremor amplitude and frequency provided by the mechanical platform simulating the elbow joint are summarized in Table 2. The frequencies of the simulation signals are in accord with the common tremor frequency range and the amplitudes are little higher by 4–5 dB. Moreover, the movements with low frequency for simulating the intentional motions could also be observed in the measured signals. For example, parts of the simulated tremor signals with large offset and low-frequency rhythmic voluntary movement are demonstrated in Figure 4. Therefore, this system could be used to verify the performance of the proposed algorithm.
Amplitude and frequency of simulation signals with different masses.


Simulated tremor signals by the mechanical system: (a) simulated tremor with large offset and (b) simulated tremor with low-frequency intend motion.
The tremulous signals are downloaded from the Motus Bioengineering., Inc., 22 and employed to further evaluate the proposed algorithm. The pathological subjects, including eight action tremulous patients and seven postural/rest tremor patients tremor, are selected to participate in the experiments. In addition, all the subjects signed the informed consent forms approved by the Ethics Committee of local hospital. The electromyography (EMG) signals of the wrist extensor/flexor and the angular velocity of wrist joint are synchronously recorded via the portable EMG system and the Motus System (gyroscope) arranged on patients’ hands. The joint angle is derived by integrating the angular velocity and a first-order Butterworth high-pass filter with cutoff frequency 15 Hz is used to decrease the drift.
Determination of the window length
The frequency resolution of FFT (Δf = fs/L) could be calculated by the sampling frequency and the data length determined by the adapted window. Therefore, the minimum length of the window is determined as Lmin = fs/Δf, where the frequency resolution is obtained from the input signals in advance.
During the record of signals, the new data are continuously taken in the lowest position and the old data in the highest position of the data vector are removed. Therefore, the time for starting adapting frequency is inherently delayed in the transition stage of frequency estimation. Besides, a zero vector with an adaptable length is added to the signal and then a vector with a constant size is obtained for a more clear frequency spectrum.
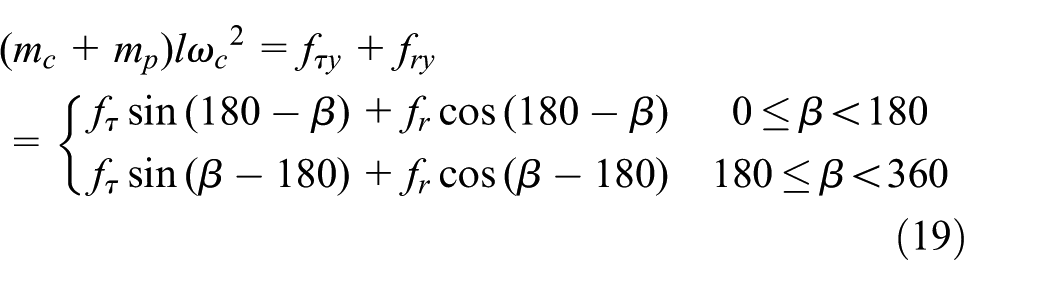
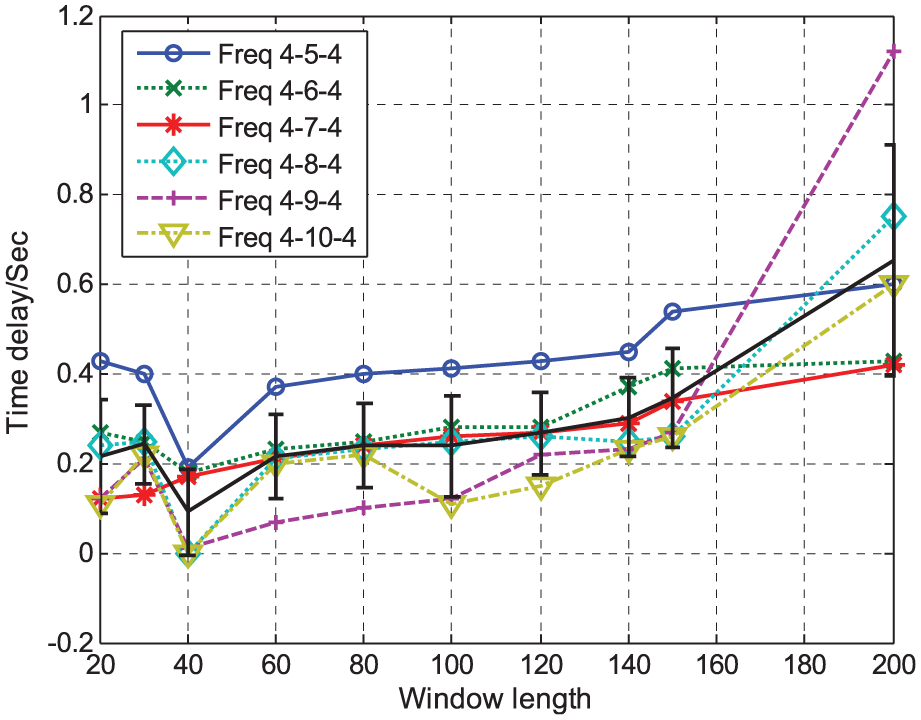
The delay time at the transition stage and the frequency estimated error at the stable stage with respect to different frequency steps and window lengths are plotted in Figures 5 and 6, respectively. It is found that the trade-off between the time delay (TD) and frequency estimation error is necessary to determine an optimal length. Therefore, the length of the fourth convolution Blackman window is set as 100 for the smaller TD and estimation error.
Effect of the window length on the time lag of the frequency adaption.
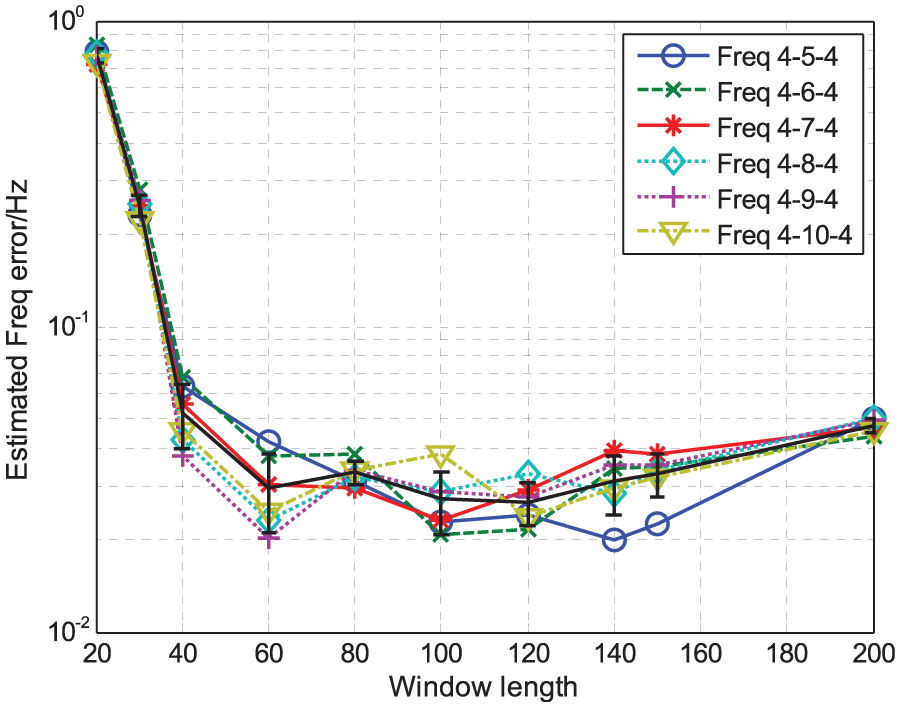
Effect of the window length on the error of the frequency estimation.
Evaluation of the developed algorithm
In this section, WFLC, ABPF, and the proposed method are used to estimate tremor frequency and track synthetic tremulous signals and patients’ data. The parameters of WFLC and ABPF are tuned to fit the signals as well as possible in order to fairly compare their performance with that of the proposed method. The sampling frequency is set as fs = 100 Hz. Finally, the initial values of these algorithms’ parameters are set as a trade-off between the adaption speed in the transition periods and the stability of frequency estimation and are shown as follows:
WFLC_FLC algorithm. ω 0WFLC = 1 Hz, W0WLFC = 0, µwflc = 0.01, µ0wflc = 0.0001, µflc = 0.015, W0LFC = 0, and M = 1
ABPF algorithm. fmod = 5 Hz and Δf = 0.25 Hz
The proposed algorithm. L = 100
where ω0WFLC is the fundamental frequency, W0WFLC denotes the initial value of weights vector, and µwflc and µ0wflc are the adaptive gain for weight and frequency of WFLC, respectively. µflc represents the adaptive gain of FLC. fmod and Δf are the modal frequency and the frequency step of ABPF, respectively. L represents the number of elements in the data vector.
Determination of the dominant frequency
The algorithms’ ability of tracking the dominant frequency is evaluated with the simulated signals shown in Figure 7. The constant frequencies of 4 and 6 Hz are accurately estimated, while the estimated frequencies do not well follow the actual frequency in the transition period. In addition, the frequency convergence behavior of three algorithms can be observed in the transition period between 0 and 1 s, 2 and 3 s, and 7 and 8 s of the synthetic signal. TD of the proposed method is between that of ABPF and WFLC (TDWFLC ≈ 0.08 s < TDSFFT ≈ 0.12 s < TDABPF ≈ 0.18 s). However, the adaptation time (AT), from starting adaption to obtain a stable frequency, of SFFT is middle compared with that of WFLC and ABPF (ATABPF ≈ 1.18 s < ATSFFT ≈ 1.10 s < ATWFLC ≈ 3.10 s).

Estimation of the dominant frequency of the simulated signal.
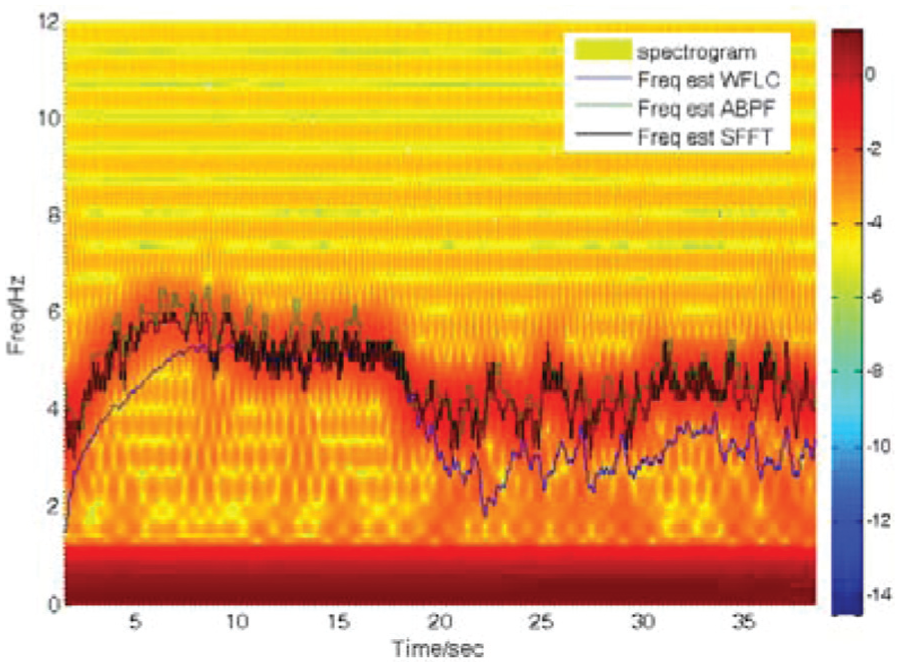
Based on the actual tremor signals measured from the mechanism platform and one representative subject (rest/postural tremor patient 8), it is concluded that the adaption time for estimating frequency by SFFT is much smaller compared with that of WFLC, and the estimated frequency of SFFT is more stable with small changes compared with ABPF as depicted in Figures 8 and 9. However, the estimation of frequency at the starting time is not accurate. The reason may be that the data vector for FFT is filled with few signal points and zeros. This conclusion is in accord with the analysis of the developed procedure in section “Determination of the adapted window.”
Estimation of the dominant frequency of the simulated tremor by the mechanism system.

Estimation of the dominant frequency of the rest tremor’ signals.
Extraction of tremulous movements
The performances of three procedures for distinguishing tremor and the intended movement are compared as shown in Figure 10. The combining tremor error is obtained by subtracting the estimated tremor from the actual tremor. The frequency adaptation and TD induce the tracking error indicated by the maximal deviation in the transition regions (ΔEABPF ≈ 0.35 < ΔESFFT ≈ 0.5 < ΔEWFLC ≈ 1.35). The extraction of tremor components by WFLC significantly degrades due to the sudden changes in tremor frequency that may be observed, for example, in tremor patients. 2 The results demonstrate that tremors estimated by SFFT and ABPF are more robust and effective to the sudden changes in dominant frequency compared to WFLC.

Performance of the algorithms on the synthetic signal with intended motions.
The voluntary components in the tremor signals provided by the mechanism system and one representative action patient estimated by three approaches are demonstrated in Figures 11 and 12, respectively. Meanwhile, a portion of the signal is selected for clarity. The actual tremor and the voluntary component are obtained by filtering the recorded signal with a zero-phase filter realized with the MATLAB filtfilt routine. 10 In Figure 12, the raw signal and the estimated intention movement are shifted upward with 90° to be shown with the extracted tremulous component. It is observed that three methods succeed in separating the intended motion from the measured signals. However, the SFFT performs slightly better than that of WFLC and ABPF with faint fluctuation. Meanwhile, the tremor estimation by SFFT well matches the actual tremor with less deviation.

Performance of methods on the mimic signals generated by the mechanism platform.

Performance of methods on the signal measured from the action tremor patient #1.
Table 3 summarizes the performance of the algorithms on the estimation of tremor signals measured from eight postural/rest tremor patients and the statistical significance is verified with the paired t test. The normalized root mean square error (NRMSE) obtained through normalizing the RMSE to the amplitude of tremulous signals, the correlation coefficient, and the time lag (TL) between the estimated tremor (tk) and the ideal tremor (tk_ideal) are synchronously used to evaluate the combining accuracy of algorithms. It is shown that the tremor estimation of SFFT is much better with a smaller average NRMSE 2.7 ± 0.94%, a higher average correlation coefficient of 0.91 ± 0.04, and a TL of 5.37 ± 0.39 ms. Meanwhile, TL is mainly caused by the time consumption of algorithm when it is employed to process the new data. Therefore, the comparison of processing time between algorithms also demonstrates that the time consumption of SFFT is smaller than that of WFLC and ABPF.
Comparison of WFLC, ABPF, and the proposed method on signals recorded from patients (p < 0.05).
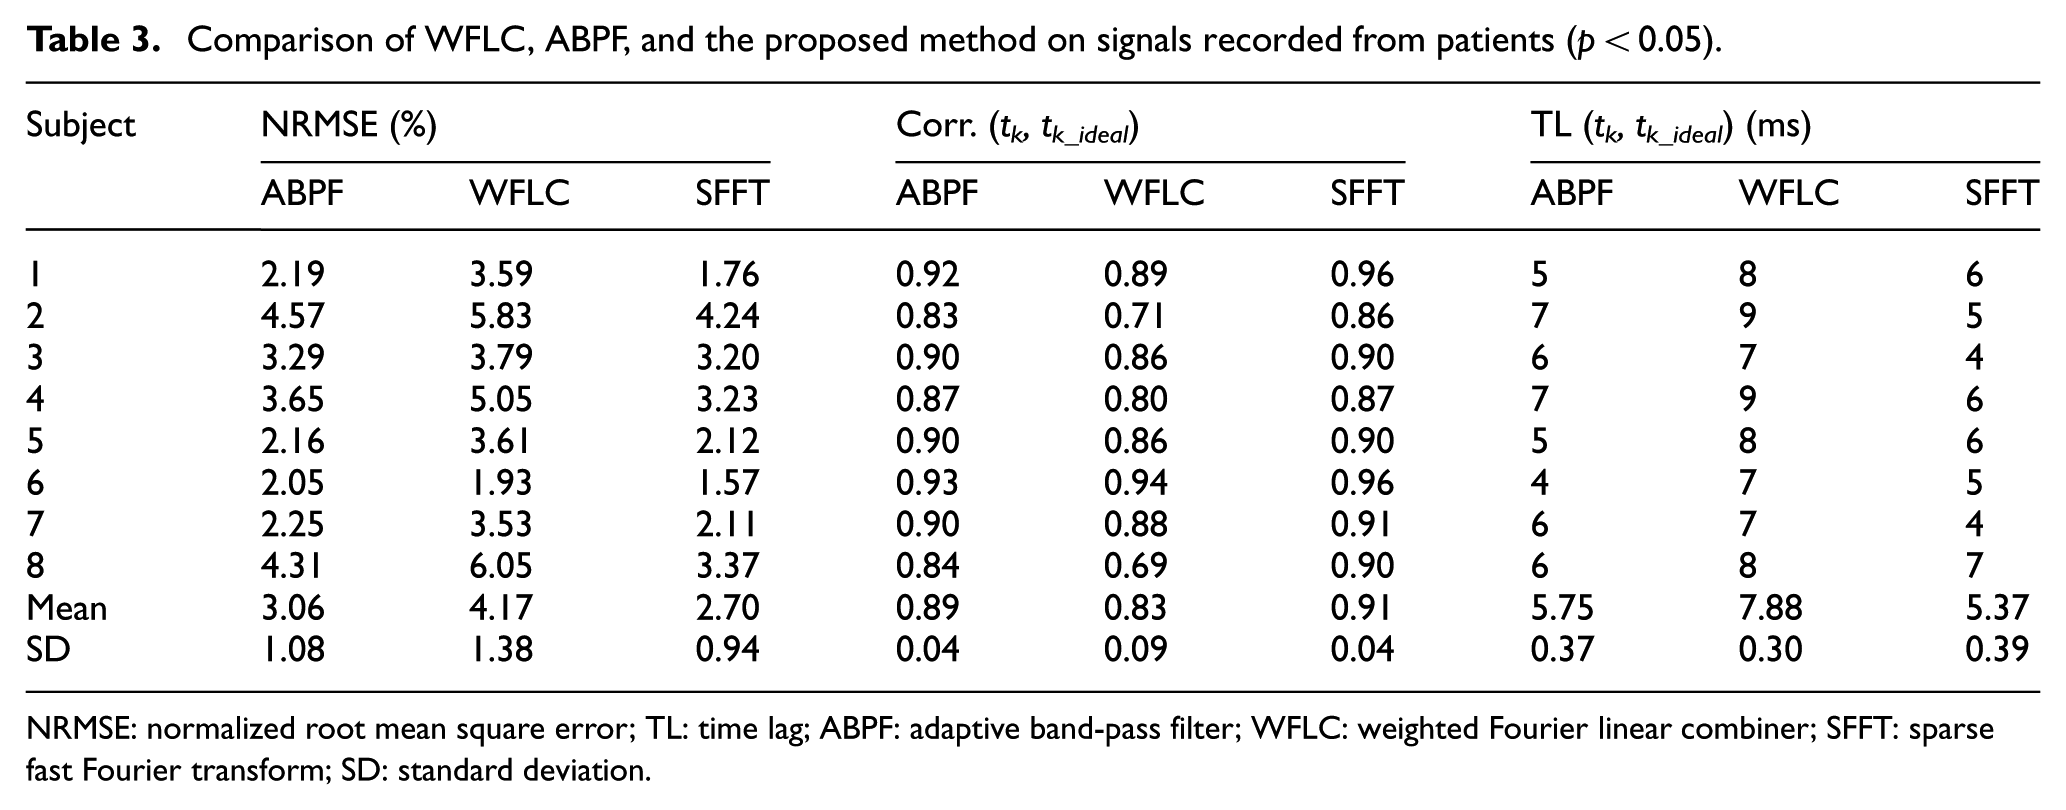
NRMSE: normalized root mean square error; TL: time lag; ABPF: adaptive band-pass filter; WFLC: weighted Fourier linear combiner; SFFT: sparse fast Fourier transform; SD: standard deviation.
The statistical analysis of the algorithms on the rest tremor and action tremor signals is performed to evaluate their performance and the results are shown in Figure 13. It is found that the proposed approach outperforms other two methods with smaller estimation error in both types of tremor. In addition, the average NRMSEs for rest tremor are higher than that of action tremor in three algorithms.

Average NRMSE and the standard deviation for all algorithms with rest tremor and action tremor signals.
Discussion
The muscles of pathological tremor patients could contract with the activation of the neural commands. When FES is employed to suppress tremor, the appropriate anti-tremor stimulate pattern generated by the stimulator is necessary to excite the antagonist muscles together with neural commands.10,11 Therefore, the stimulation pulses are tuned by the control system of FES with the feedback signal of the tremulous components distinguished from the raw data.
In this study, a novel method combining a sliding convolution window and an interpolation procedure is proposed to estimate the dominant frequency and separate the tremor components. Besides, a mechanism system with 2 degrees of freedoms for imitating the tremor in the elbow joint and wrist joint is developed. The analysis of the recorded signals demonstrates that this platform could be employed to provide tremor signals without impacting the tremor patients during the evaluation of suppression devices. Based on the simulated data, the performance of the adapted convolution window with different length is evaluated and shown in Figures 5 and 6. As a trade-off between delay and estimation frequency error, the value of 100 is selected as the window length to compensate both spectral leakage and picket-fence effects.
With the artificial signals and actual tremor signals, the proposed algorithm is proved to be capable of sufficiently tracking the unknown tremulous frequency/amplitude, adapting to the frequency changes in real time, and preserving voluntary components with less lag compared with WFLC. It is noted that ABPF and SFFT estimate tremor signals by selecting a symmetrical frequency band with the dominant frequency as the center frequency. However, WFLC fails to adapt to the frequency change quickly and it may be due to the requirements of
During the combination of the tremor signals, the values of WFLC parameters are empirically modulated to match the signals as well as possible. The parameters of WFLC and ABPF are usually subject-specific and even task-specific, namely, the modulation of the parameters is essential when the algorithm is used in different subjects or external condition. Nevertheless, the parameters in SFFT are much fewer than that of ABPF and WFLC, and the window length is also applicable to different subjects and tasks. Therefore, this is beneficial to decrease the computational cost of modulating parameters. In short, SFFT can be employed to estimate the pathological tremor without interfering patients’ voluntary motions.
Conclusion
In this study, a two-stage algorithm is developed to estimate the instantaneous tremor parameters such as the time-varying dominant frequency in the case of nonsynchronous sampling and to distinguish the tremulous movement from the raw data. Meanwhile, a mechanism platform is designed to simulate the tremor movement. The results demonstrate that the developed algorithm could be employed as an alternative to estimate the tremor parameters for modulating the suppression devices. Moreover, the tremor suppression experiments will also be carried out to the test the feasibility of this procedure in real time.
Footnotes
Academic Editor: Nicolas Garcia-Aracil
Declaration of conflicting interests
The author(s) declared no potential conflicts of interest with respect to the research, authorship, and/or publication of this article.
Funding
The author(s) disclosed receipt of the following financial support for the research, authorship, and/or publication of this article: The study was funded and supported by “National Science and Technology Pillar Program” (grant 2015 BAF01B00) and “National Natural Science Foundation” (grant no. 61473104).