
Abstract
In the fashion industry, demand forecasting is particularly complex: companies operate with a large variety of short lifecycle products, deeply influenced by seasonal sales, promotional events, weather conditions, advertising and marketing campaigns, on top of festivities and socio-economic factors. At the same time, shelf-out-of-stock phenomena must be avoided at all costs. Given the strong seasonal nature of the products that characterize the fashion sector, this paper aims to highlight how the Fourier method can represent an easy and more effective forecasting method compared to other widespread heuristics normally used. For this purpose, a comparison between the fast Fourier transform algorithm and another two techniques based on moving average and exponential smoothing was carried out on a set of 4-year historical sales data of a €60+ million turnover medium- to large-sized Italian fashion company, which operates in the women's textiles apparel and clothing sectors. The entire analysis was performed on a common spreadsheet, in order to demonstrate that accurate results exploiting advanced numerical computation techniques can be carried out without necessarily using expensive software.
1. Introduction
The role of demand forecasting has become increasingly important within businesses that have the maximization of customer service and the optimization of capital investment operating costs as their main objectives [1,2,3]. Demand forecasting is also considered key to effective supply chain management [4,5,6,7] [8,9] and it plays a crucial role, especially in the long-term, in identifying the direction of the business strategy [10,11]. The forecast accuracy affects all levels of production systems, from the generation of production plans to the calculation of material requirements [12,13,14,15] and, consequently, to supply chain management. An accurate forecast can lead to significant cost savings, reduced working capital in safety stocks [16], the strengthening of customer relationships and increasing competitiveness [17]. However, it is well-known that accurate forecasts are extremely difficult to attain due to many factors, from macro-economic changes and the unpredictability of markets to fashion effects [18]. The complexity of this problem may push companies to purchase specific software, such as forecasting decision support systems; however, as these are extremely expensive, in most cases companies choose to use simple statistical approaches, such as implementing moving average or exponential smoothing heuristics [19] on a common spreadsheet. As a consequence, these basic forecasts need to be reviewed in order to take into account exceptional circumstances or events that may not emerge from historical data: as a result, up to 80% of forecasts are adjusted [4], although experimental evidence from some authors suggests that judgmental adjustments to statistical forecasts are usually unnecessary [20]. In the fashion industry, demand forecasting is particularly complex [21,22,23,24]: companies in this specific sector operate with a large variety of short lifecycle products, deeply influenced by seasonal sales [25,26,27], promotional events [28,29], weather conditions, and advertising and marketing campaigns [30], as well as festivities and economic and social factors. Moreover, these slow-moving expensive products usually face an intermittent or lumpy demand [31], but at the same time – as they are usually high-margin items - shelf-out-of-stock phenomena must be avoided at all costs [32,33,8]. Thus, quick and effective supply chain management, with flexible production schedules and appropriate inventory levels, becomes critical for each stock-keeping unit. For this reason, the demand forecasting process needs to be timely and accurate.
Thanks to its capability in terms of decomposing a function into a sum of sinusoids of different frequencies, amplitude and phase, Fourier analysis can be used effectively for seasonal sales forecasting; this is because the Fourier transform takes a time series and maps it into a frequency spectrum in the frequency domain. The discrete version of the Fourier transform can be quickly calculated using fast Fourier transform (FFT) algorithms. Given the strong seasonal nature of the products that characterize the fashion sector and the simplicity of computing FFT on popular spreadsheets, such as Microsoft Excel, this paper aims to highlight how the Fourier method can represent an easy and more effective forecasting method compared to other widespread alternatives normally used. For this purpose, a comparison between FFT and two other techniques based on moving average and exponential smoothing was carried out on a set of 4-year historical sales data of a €60+ million turnover medium- to large-sized Italian fashion company operating in women's textiles apparel and clothing sectors which distributes over 2,500 products to more than 200 shops.
2. Previous Research
Forecasting approaches can be divided into qualitative and quantitative methods [34]. Here, we focus on quantitative methods based on the study of historical time series [35]. Among these, the most well-known are the moving average and the exponential smoothing methods - Holt-Winters' method [36] and regressive methods [37]. However, in having to deal with lumpy demand, Croston's method [38] [39] and its evolution as offered by Syntetos and Boylan [40] represent a better alternative. Other methods that have been used in the fashion industry - providing successful results in sales prediction - include two-stage dynamic sales forecasting models [41], fuzzy logic approaches [42], artificial neural networks [43] and extreme learning machines [44,8,45]. Despite their effectiveness, few commercial software solutions implement these methods for forecasting. The few that do are often too expensive for small- or medium-sized companies. As a result, in practical cases, most companies use basic heuristics implemented on common spreadsheets. However, common spreadsheets do not support only basic techniques: for instance, the Fast Fourier Transform - which has been widely used and applied in many fields ranging from physics, seismology, engineering and economics and has been described as the “most important numerical algorithm of our lifetime” [46] – is easily available in Microsoft Excel. The use of Fourier analysis in forecasting overcomes certain limitations that other techniques have in capturing seasonality phenomena [47]. Therefore, this approach has been used for forecasting changes in electricity demand and/or prices [48,49], which are variables that are clearly related to light and temperature cyclic variations. In forecasting consumers' behaviour, it has been used for estimating the volumes of incoming calls in a call centre [50] and has been integrated with a linear equation for forecasting motorcycle sales with successful results [51], whilst it did not lead to significant improvements for forecasting automobile sales [52]. Apart from these few examples, FFT seems to be applied only rarely for forecasting consumer goods sales and – to the authors' knowledge – no contributions seem to be present in the literature for forecasting consumer goods sales, specifically in the fashion industry. The fashion industry is progressively drawing the attention of researchers due to its increasing importance in the worldwide economy and the peculiarities of its operations' practices. For example, recent studies focused on fashion firms in analysing brand value [53], organizational innovation [54,55,56], production efficiency increase [57,58] and improvements in logistics processes [59,24,60]. For an updated and complete review of the forecasting techniques in the fashion industry, refer to Nenni et al. [61].
The next section presents in detail both the methodology and the step-by-step procedure used to apply FFT on historical time series to predict sales. Next, the results of the validation of the proposed approach on the real data of a fashion company are presented.
3. Methodology
This section presents both the methodology and the step-by-step procedure used to apply FFT to historical time series to forecast sales in detail. In the next section, results proving the effectiveness of the suggested approach are shown by analysing a fashion company's data. The whole analysis was performed on a common spreadsheet in order to prove that accurate analyses exploiting advanced numerical computation techniques can be carried out without needing to use expensive software. Microsoft Excel software is able to compute FFT on a data vector. The FFT algorithm significantly reduces computational times compared to the standard Fourier transform [62], and specifically from O(n2) to O(n·log(n)) [63]. Although Microsoft Excel is not primarily conceived to perform such mathematical analyses, it is easy and quick to calculate the discrete Fourier transform (DFT) and its inverse function on a data range. The tool's only constraint is that the number of input values must be a power of 2, up to the value of 4,096; however, this should not represent a limitation for these types of analyses (4,096 values can describe a sales record over more than eleven years with daily samples, or over more than 78 years with weekly samples).
In this analysis, the FFT was used to perform spectral analysis on sales patterns in order to attain a frequency spectrum (the representation of which is often referred to as a “periodogram”). This is because the Fourier transform can decompose a periodic series into a sum of sinusoidal functions (harmonic components [64], specifically cosine functions in Microsoft Excel [65]). The FFT returns complex numbers from which it is possible to extract information – frequency (f), amplitude (A), and phase (φ) – of N/2 periodic waves that form the sales pattern, where N is the total number of time periods of sales data, which is also the size of the sample (for the limit of N/2 sine waves see Nyquist–Shannon sampling criterion in signal theory [66]). Thus, the result of the Fourier transform is:

However, the following simplification can be considered [67]:

Where k = N/2.
Applying the Microsoft Excel Fourier analysis tool on a N-sized data range, it yields an N-sized range of complex numbers which contain information on N components. However, as previously stated, only the first half should be considered. This is because the second half of the series shows the conjugated values, symmetrical with respect to the Nyquist-Shannon frequency, which is fc/2 where fc is the sampling frequency. The spectral resolution is:

The amplitudes of the i-th component can be calculated as the absolute value of the i-th complex number Ai = ai + ibi, where a is the real part and b is the imaginary part. Excel provides simple functions that can be easily used to calculate the amplitude and phase of each of the N/2 significant components, from each complex number Ai:


It is worth noting that the amplitude of the first component (the average value of the series, corresponding to the f0 frequency) is obtained by calculating the absolute value of the first complex number of the array but dividing it by N and not by N/2, since there is no conjugated value associated to it. The most significant components are those with the highest amplitude. The sales forecast pattern can therefore be attained by summing a specific number of components (i.e., with the inverse Fourier transform) chosen among the most significant of them. A critical issue is how to select the correct number of components to consider; this is explained in detail in the case study paragraph. Figure 1 shows some periodogram examples resulting from the spectrum analysis of different signals.
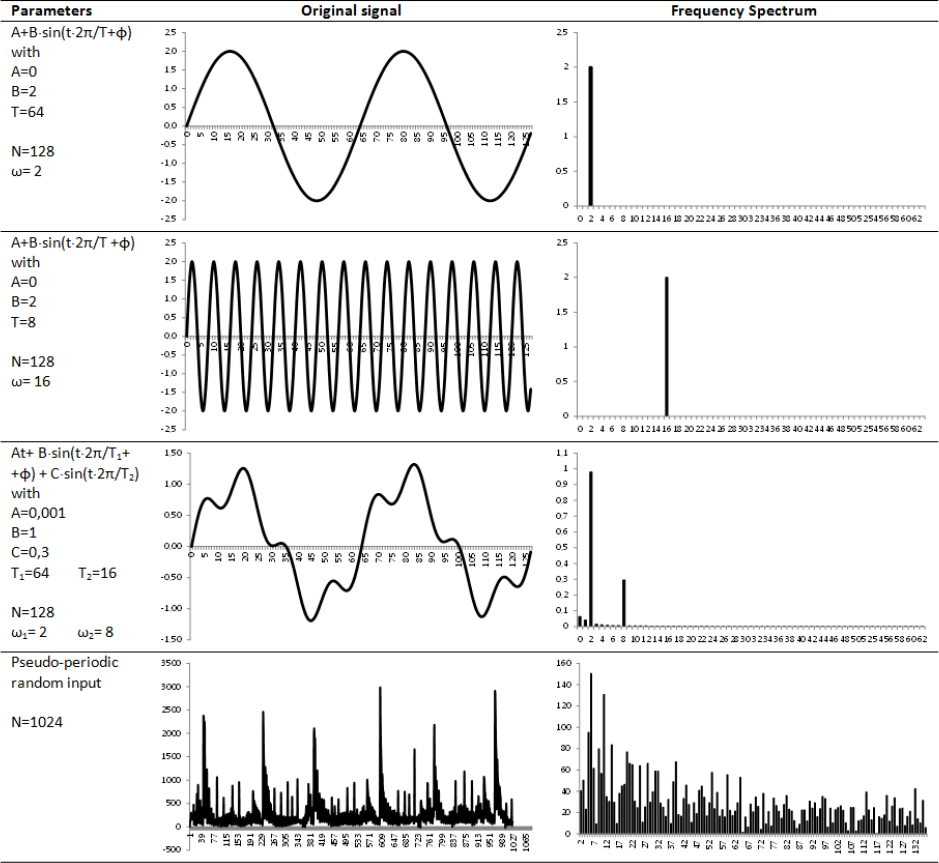
Examples of periodograms generated from different signals.
The procedure to be applied to a historical time series is summarized below. Clearly, before performing the analysis, the items/products to be analysed and the level of detail of the analysis must be chosen. Specifically, when dealing with fashion products (and specifically with the more expensive women's clothing, purses or accessories) it is often impossible to drill down the analysis to manage the volume of sales per product / per day / per shop due to the fact that, at such level of detail, the average values can be close to zero or statistically insignificant. Thus, data is usually analysed using weekly time buckets. On top of this, product sales are often grouped by category or sub-category and/or shops are grouped by market region. Thus, forecasts are first calculated at an aggregated level and then the volumes are brought back to the most appropriate level of detail through heuristic ratios. Hence, after having chosen the most appropriate time bucket and product aggregation, a 10-step procedure to attain an accurate forecast through Fourier analysis is employed, as follows:
Extract the historical series of data related to the item to be analysed over a significant time interval (e.g., 4 years); Divide the data into two subsets: a calibration data set (e.g., the first 3 years) and a validation data set (e.g., the 4th year), which allows the quality of the results to be analysed; the calibration set should be composed of N values (e.g., in Excel, N needs to be a power of two); Calculate a linear trend of the series of the calibration set and subtract it from the data series [68] (e.g., in Excel, the TREND function may help); Calculate the FFT on the detrended data (e.g., in Excel, the Fourier analysis tool gives a range of complex numbers); Create the frequency spectrum by calculating, for each of the first N/2 components, their amplitude and phase (e.g., in Excel, using (1) and (2) in the complex numbers' range); Except for f0, order the f1… fN/2 components in a decreasing order of amplitude; Perform the inverse Fourier transform N/2 times (or sum the wave components), taking into account each of the N/2 components progressively, starting from f0 up to the N/2-th; Re-apply the eliminated trend, calculated in step 3, to each of the N/2 inverse Fourier transforms; Compare the validation data set with each of the N/2 inverse Fourier transforms, calculating the forecast error with the preferred method [69] (e.g., mean absolute percentage error, MAPE). Choose the most appropriate number of wave components to consider in order to minimize the error.
Note that this 10-step procedure needs to be performed only the first time a given item k (product, category, subcategory, etc.) is analysed. This is because, once the most appropriate number of wave components to be applied has been chosen (say, θ
k
), to further improve the forecast, steps 6, 7, 8, 9 and 10 can be substituted with the following:
Perform the inverse Fourier transform, taking into account f0 and the first θ
k
components with decreasing amplitude; Re-apply the eliminated trend, calculated in step 3, to the inverse Fourier transform calculated in the previous step 6.
Clearly, θ k may easily differ from item to item. Despite choosing a unique θ = θ k ∀k, it may provide acceptable results through an easier and more straightforward procedure, and a first tuning analysis is advisable, particularly when product categories drastically differ (e.g., purses, scarves and coats all belong to the general “women fashion products” category but may show very different sales patterns over the same time period). In the following section, the application of the procedure is shown with two examples of the use of Fourier analysis to forecast the sales in the trolley category and the belt category.
4. Application to fashion products
This section presents the application of Fourier analysis to calculate the sales forecasts for a medium- to large-sized Italian fashion company operating in the women's textiles, apparel and clothing sectors. Several product categories were analysed and, as a result, the application of the proposed method generally yielded more accurate forecasts in comparison with two of the most commonly-used approaches based on moving average and exponential smoothing. Two examples are presented here: the trolley sub-category and the belt sub-category. The Fourier analysis applied to the historical series of the former returned a much more precise forecast, while with the latter the forecasting error was comparable with that obtained with the other two approaches. In all cases, the historical series included the calibration data set (sales during 2007, 2008 and 2009) and the validation data set (sales during 2010). With the moving average and exponential smoothing techniques, the traditional approaches [70] were used to calculate weekly ratios using three periods of historical data (2007, 2008 and 2009). The forecast (α) parameter in the exponential smoothing was chosen in a different way in each case, by using the one that returned the best results. In the Fourier analysis, since the input range must be a power of two, the calibration set was reduced to the period from 19/07/2007 to 31/12/2009 - i.e., N = 128 weeks - while the validation set was kept the same (from 01/01/2010 to 31/12/2010). As the sampling frequency is equal to fc = 1 week, the spectral resolution is equal to
4.1 The trolley sub-category
The calibration data set of the trolley sub-category sales is shown in Figure 2.
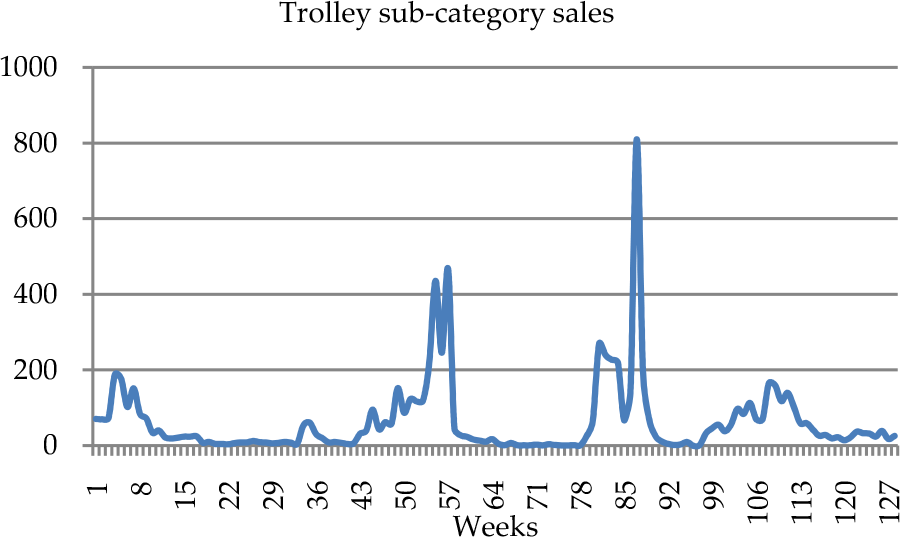
Calibration data set of the trolley sub-category sales (in units).
Starting from f0, the other components in the spectrum were sorted by decreasing amplitude, according to step 6 in the mentioned procedure. The result is shown in Figure 4.

Frequency spectrum computed on the calibration data set.

Components ordered by decreasing amplitude (the first is f0).
The FFT yielded the frequency spectrum shown in Figure 3.
Then, N/2 inverse Fourier transforms can be calculated using different numbers of components, as mentioned in step 7 of the procedure described. Next, the trend is applied to each of them and the results are compared with the validation set. Figure 5 shows the MAPE index for each of the N/2 possible forecasts: the smallest error is recorded using 6 components, thus θ trolley = 6.
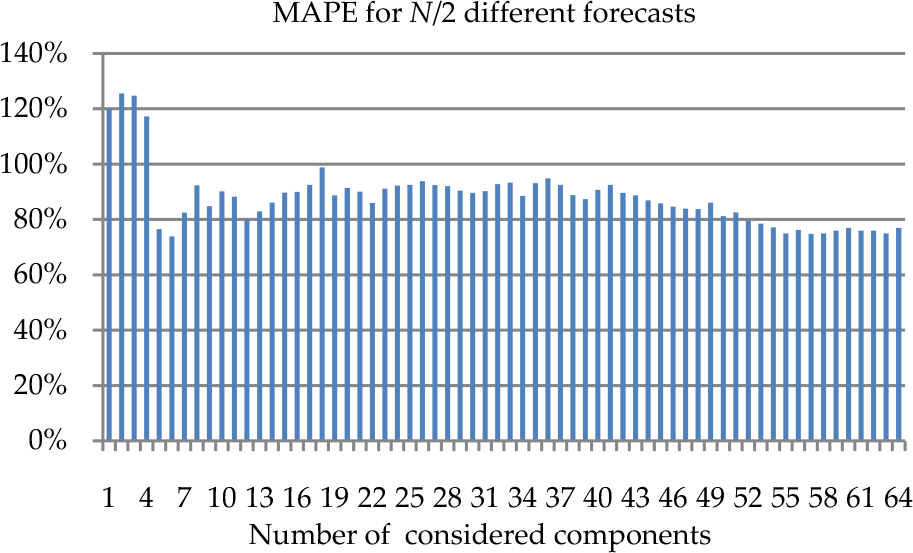
MAPE for all of the 64 possible forecasts.
The following Table 1 shows the characteristics of the 6 chosen components – starting from f0 – followed by the mathematical expression of the forecast function y(t).
Amplitude, frequency and phase of the chosen components.


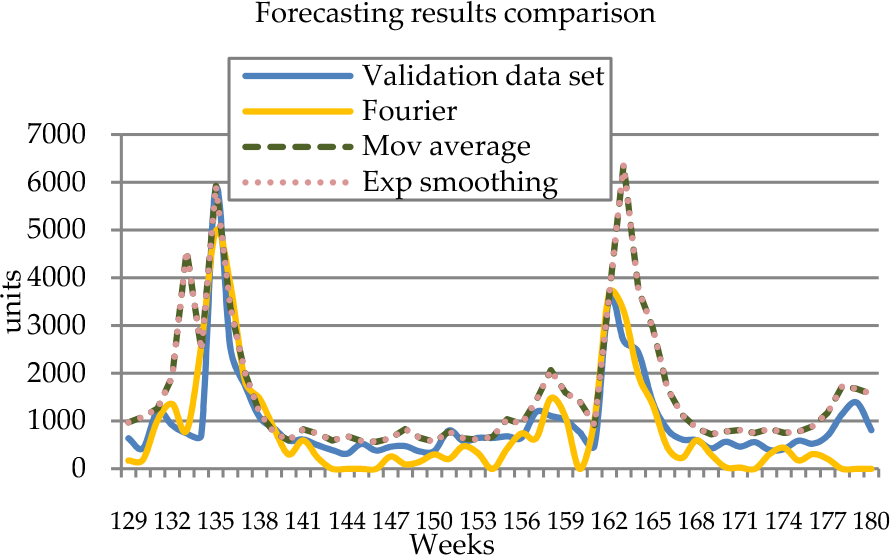
Figure 6 shows the comparison between the forecasts obtained using Fourier analysis, exponential smoothing and moving average. Obviously, the Fourier forecast succeeded in following the validation data pattern more effectively, while exponential smoothing and moving average techniques yielded more or less the same results. Specifically, it is clear that the huge peak that both the exponential smoothing and moving average techniques forecast for weeks 162-165 results from a similar peak in weeks 85-88 of the calibration data set shown in Figure 2. This is because neither of these classical techniques can ignore the high values recorded in the same period of the previous season; on the contrary, the Fourier analysis forecast tends to confirm only those increments that are recorded cyclically.

Forecasting results comparison.
These results are confirmed by the numerical comparison shown in Table 2, where the Fourier analysis is shown to yield a much smaller error, both in terms of MAPE and MAD (the exponential smoothing α parameter was set to its best value, α = 0.96).
Comparison of forecast errors.

4.2 The belt sub-category
The calibration data set of the belt sub-category sales is shown in Figure 7.

calibration data set of belt sub-category sales (in units) The Fast Fourier Transform yielded the frequency spectrum shown in Figure 9.
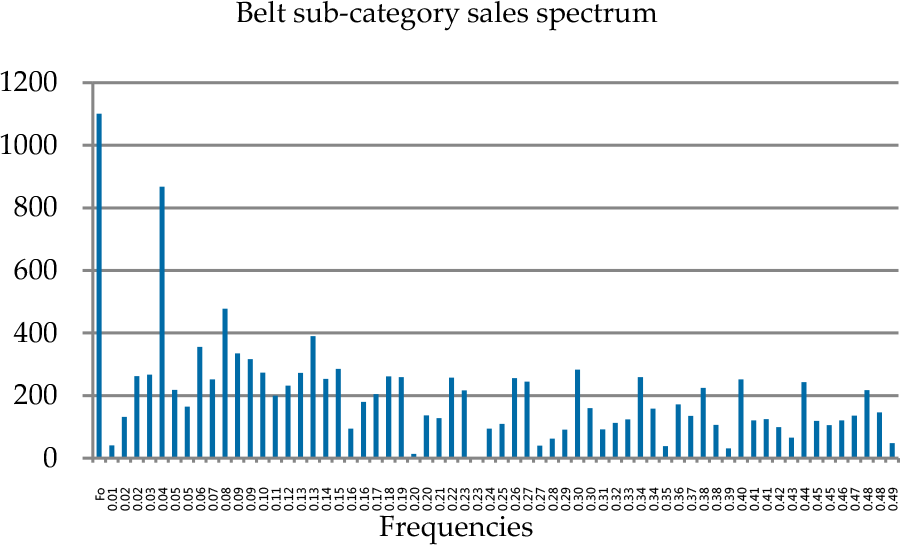
frequency spectrum calculated on calibration data set

Components ordered by decreasing amplitude (the first is f0).
Starting from f0, the other components in the spectrum were sorted by decreasing amplitude, according to step 6 in the mentioned procedure. The results are shown in Figure 9.
The results for all 64 possible frequencies, expressed by the index MAPE, are represented in Figure 10.

MAPE index for all 64 possible frequencies.
It is clear that, in this example, the forecasts gave more accurate results compared to the trolley case depicted in Figure 5: the smallest error is recorded using 17 components, thus θ belt = 17. Figure 11 shows the comparison between the forecasts attained through Fourier analysis, exponential smoothing and moving average. In this case, despite the fact that the Fourier analysis followed the validation data set more accurately, the difference between the suggested method and the results attained with the moving average and the exponential smoothing techniques is not as clear as in the trolley case. In terms of MAD and MAPE, the numerical values are shown in Table 3 (the exponential smoothing α parameter was set to its best value, α = 0.98).
Comparison of forecast errors.

Comparison of the forecast results.
The differences between the results obtained in the trolley and belt cases originate from the specific patterns of their historical time series. As may be seen comparing Figure 2 with Figure 7, the belt sub-category historical sales show a much clearer cyclic pattern, with periodic peaks repeating over time and gradually decreasing in value. In the belt sub-category, both the moving average and the exponential smoothing methods were able to capture the pattern's cyclicality, despite the decreasing trend in the peak values not being perfectly forecast, as would be expected when using these original techniques [19]. On the other hand, the trolley sub-category historical sales pattern was more irregular, with a sudden high peak of sales in the last season. This recent high peak significantly influenced the moving average and exponential smoothing techniques, and both methods forecasted a higher sales volume compared to what really occurred. On the contrary, in both cases the Fourier analysis yielded much more accurate results.
5. Conclusion
Accurate forecasts are extremely difficult to attain. As a result, large-sized companies may be pushed to purchase expensive forecasting software, whilst small- and medium-sized enterprises generally choose to use simple statistical approaches on common spreadsheets. However, common spreadsheets do not support only basic techniques: for instance, the fast Fourier transform (FFT) - which has been widely used and applied in many fields ranging from physics, seismology, engineering and economics - allows certain limitations present in other techniques in capturing seasonality phenomena to be overcome. Therefore, thanks to its capability in terms of decomposing a function into a sum of sinusoids of different frequencies, amplitude and phase, Fourier analysis has been used for forecasting changes in electricity demand and/or prices. However, it seems to be only rarely applied in consumer goods sales forecasting, and no contributions seem to be present in the literature for forecasting consumer goods sales, specifically in the fashion industry. In this paper, a comparison between the FFT analysis in Microsoft Excel and another two techniques based on moving average and exponential smoothing methods was carried out on a set of 4-year historical sales data (3-years calibration data set, 1-year validation data set) of a €60+ million turnover medium- to large-sized Italian fashion company operating in the women's textiles, apparel and clothing sectors, and which distributes over 2,500 products to more than 200 shops. The results show how Fourier analysis represents a valid alternative forecasting technique among those that can be easily implemented on a common spreadsheet. Clearly, its effectiveness varies with the sales pattern characteristics: for certain sets of historical data, the suggested approach can attain much more accurate results compared to other simple heuristics, such as moving average or exponential smoothing methods. In other patterns, the accuracy can be comparable. In this paper, the weekly sales of two product categories were analysed: for both categories, Fourier analysis yielded a smaller error both in terms of MAPE and MAD compared to the other two classical techniques; however, for one category, which displayed quite an irregular historical pattern, Fourier analysis reduced the error by 30% on average between the two indexes; on the contrary, for the second category, which displayed a more regular historical pattern, the average error reduction was 22%. A 10-step simple and straightforward procedure is described and no complex data processing procedure is required. Clearly, further improvements can originate from the application of those techniques that were conceived of in signal theory to refine the Fourier transform (e.g., reducing spectrum leakage through an appropriate signal windowing procedure). However, in this study the approach was intentionally described in its simplest form, in order to provide a solid foundation both for researchers and practitioners.