
Abstract
The rolling element bearing is one of the most critical components in a machine. Vibration signals resulting from these bearings imply important bearing defect information related to the machinery faults. Any defect in a bearing may cause a certain vibration with specific frequencies and amplitudes depending on the nature of the defect. Therefore, the vibration analysis plays a key role for fault detection, diagnosis, and prognosis to reach the reliability of the machines. Although fast Fourier transform for time–frequency analysis is still widely used in industry, it cannot extract enough frequencies without enough samples. If the real frequency does not match fast Fourier transform frequency grid exactly, the spectrum is spreading mostly among neighboring frequency bins. To resolve this drawback, the recent proposed enhanced fast Fourier transform algorithm was reported to improve this situation. This article reviews and compares both fast Fourier transform and enhanced fast Fourier transform for vibration signal analysis in both simulation and practical work. The comparative results verify that the enhanced fast Fourier transform can provide a better solution than traditional fast Fourier transform.
Introduction
Rolling element bearings have been widely applied in domestic and industrial machinery. These bearings are considered as most critical components, and defects in bearings may cause malfunction or even lead to serious failure of the machinery during operation. The health condition and quality inspection of bearings are directly related to these defects. Therefore, the industrial vibration analysis is regarded as an important measurement tool for identification, prediction, and prevention of failures in rotating machinery.1–3 For this reason, implementing vibration analysis on the machines can improve the machine efficiency and reliability. Usually, the measurement vibration involves accelerometers to measure the vibration, and then, the data can be collected for further analysis. The plots of vibration signal with time domain or frequency domain may provide sufficient information for the engineers to analyze and determine the machine fault. Many bearings’ premature malfunction may occur from surface roughness, misalignment, discrete defects, unbalance, contamination and temperature extreme, and geometrical imperfections. Modern machines may produce the vibration frequency range between 20 Hz and 20 kHz.4–6 When a fault of rolling bearings begins to develop, the resulting vibration pulses’ frequencies may repeat periodically. A band of high-frequency vibration may therefore exist before a rolling-element bearing is burnt out.7–15
Although there are many kinds of methods such as vibration, acoustic, temperature, and wear debris analysis have been reported for diagnosis and analysis of bearing defects, the vibration spectral measurement is the most widely used approach.16–19 The discrete Fourier transform (DFT) is a popular tool in spectrum analysis. If the vibration is under the stationary conditions, it may be efficient for measurement. However, the fast Fourier transform (FFT) presents a more efficient computation process. In practice, however, the limitation of the DFT or FFT makes it less efficient in analyzing the signal spectrum from defective rolling element bearings due to cyclostationary and non-stationary characteristics.20–22
Some techniques such as short-time Fourier transform (STFT), Wigner–Ville distribution (WVD), and continuous wavelet transform (CWT) are also available for signal time–frequency analysis based on two-dimensional (2D) mapping principle.23–25 However, STFT is unable to simultaneously improve the time and frequency resolutions. 23 WVD is suitable for non-stationary signals processing, but it may cause misinterpretation in the signal analysis due to the bilinear characteristic. 24 CWT algorithm is superior in analyzing simultaneously both frequency and time information for the vibration event. Its inherent large computational time with fixed-scale frequency resolution may discourage practical applications. 25 Hilbert–Huang transform (HHT) approach provides vibration signal multi-resolution in the instantaneous frequencies using the intrinsic mode functions (IMFs). It is, however, the time resolution may affect the corresponding frequency considerably.26–29
Alternatively, an envelope spectrum analysis for bearing fault diagnosis is widely used methods such as kurtogram, enhanced kurtogram, improved kurtogram, and sparsogram. The kurtogram is based on the spectral kurtosis that has been used in characterizing non-stationary signals, especially bearing fault signals. 30 However, an analytic bearing fault signal from spectral kurtosis needs to be constructed from either a complex filter or Hilbert transform or filtered by the STFT. Also, its performance efficiency is low in the presence of a low signal-to-noise ratio and non-Gaussian noise. The enhanced kurtogram was therefore developed to find the location of resonant frequency bands, but it needs to remove frequency noise by using autoregressive filtering in advance. 31 Although an improved kurtogram method was reported to overcome the shortcomings of the kurtogram, the wavelet packet transform (WPT) is required to adopt as the filter.32,33 In addition, a sparsogram algorithm was proposed to quickly determine the resonant frequency bands from the envelopes of wavelet packet coefficients at different wavelet packet decomposition depths. 34 The selection of optimal wavelet packet node, however, usually relies on visually inspecting the largest sparsity value from the wavelet packet coefficients. In a recent work, a spectral kurtosis can be decomposed into squared L2/L1 norm and spectral Lp/Lq as a general form. 35 When p = 1 and q = 0, the general form was reduced to the reciprocal of the smoothness index. Consequently, the resonant frequency bands may be retained for characterizing bearing fault signals.
Principle of DFT and enhanced fast Fourier transform models
Background of Fourier transformation
The FT analysis is a tool to reconstruct a periodical waveform using series harmonics, where harmonic frequency is defined as a multiple of fundamental. If a waveform

where
The DFT is a discrete form from time domain as

where
Assume

For the waveform sampled using p(p > 1) periods,

where
If the signal is sampled N points using the sampling rate

where
The waveform power (P) can be expressed using the Parseval relation as36,37

The power at the frequency

where k = 0,1, 2, …, N/2 − 1.
The amplitude of the

where m = 1,2, …, M.
When the sampling window is not synchronized with the fundamental, the
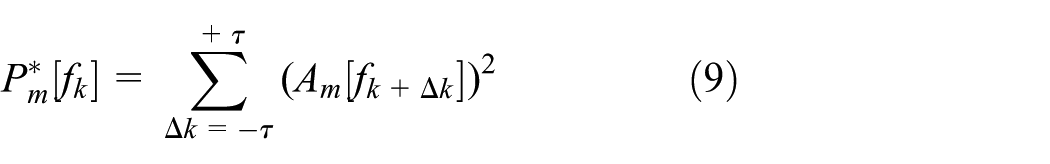
where
Therefore, the true harmonic amplitude can be retrieved from collecting all dispersed power as

Review of the enhanced fast Fourier transform algorithm
The enhanced fast Fourier transform (e-FFT) algorithm was developed to improve the FFT for suiting non-stationary vibration signal analysis. The relationship between harmonic frequency and dispersed energy can be classified into small-frequency deviation and big-frequency deviation.
39
Case 1: For small-frequency deviation shown in Figure 1(a), the second larger magnitude

Relation between harmonic frequency and dispersed Energy: 39 (a) small-frequency deviation and (b) big-frequency deviation.
Based on above principle, the mathematical model was deduced from the relation between the frequency deviation amount and dispersed energy distribution.
39
The real frequency can be corrected by the dominant frequency
The frequency deviation range (FDR) is therefore defined as

where
The energy dispersed around the major harmonic can be collected and used for retrieving the original amplitude. The restored amplitude (RA) can be defined as

where
The selection of the group bandwidth

The implementation procedure of the e-FFT model to find the major spectrums of vibration signal is shown in Figure 2.
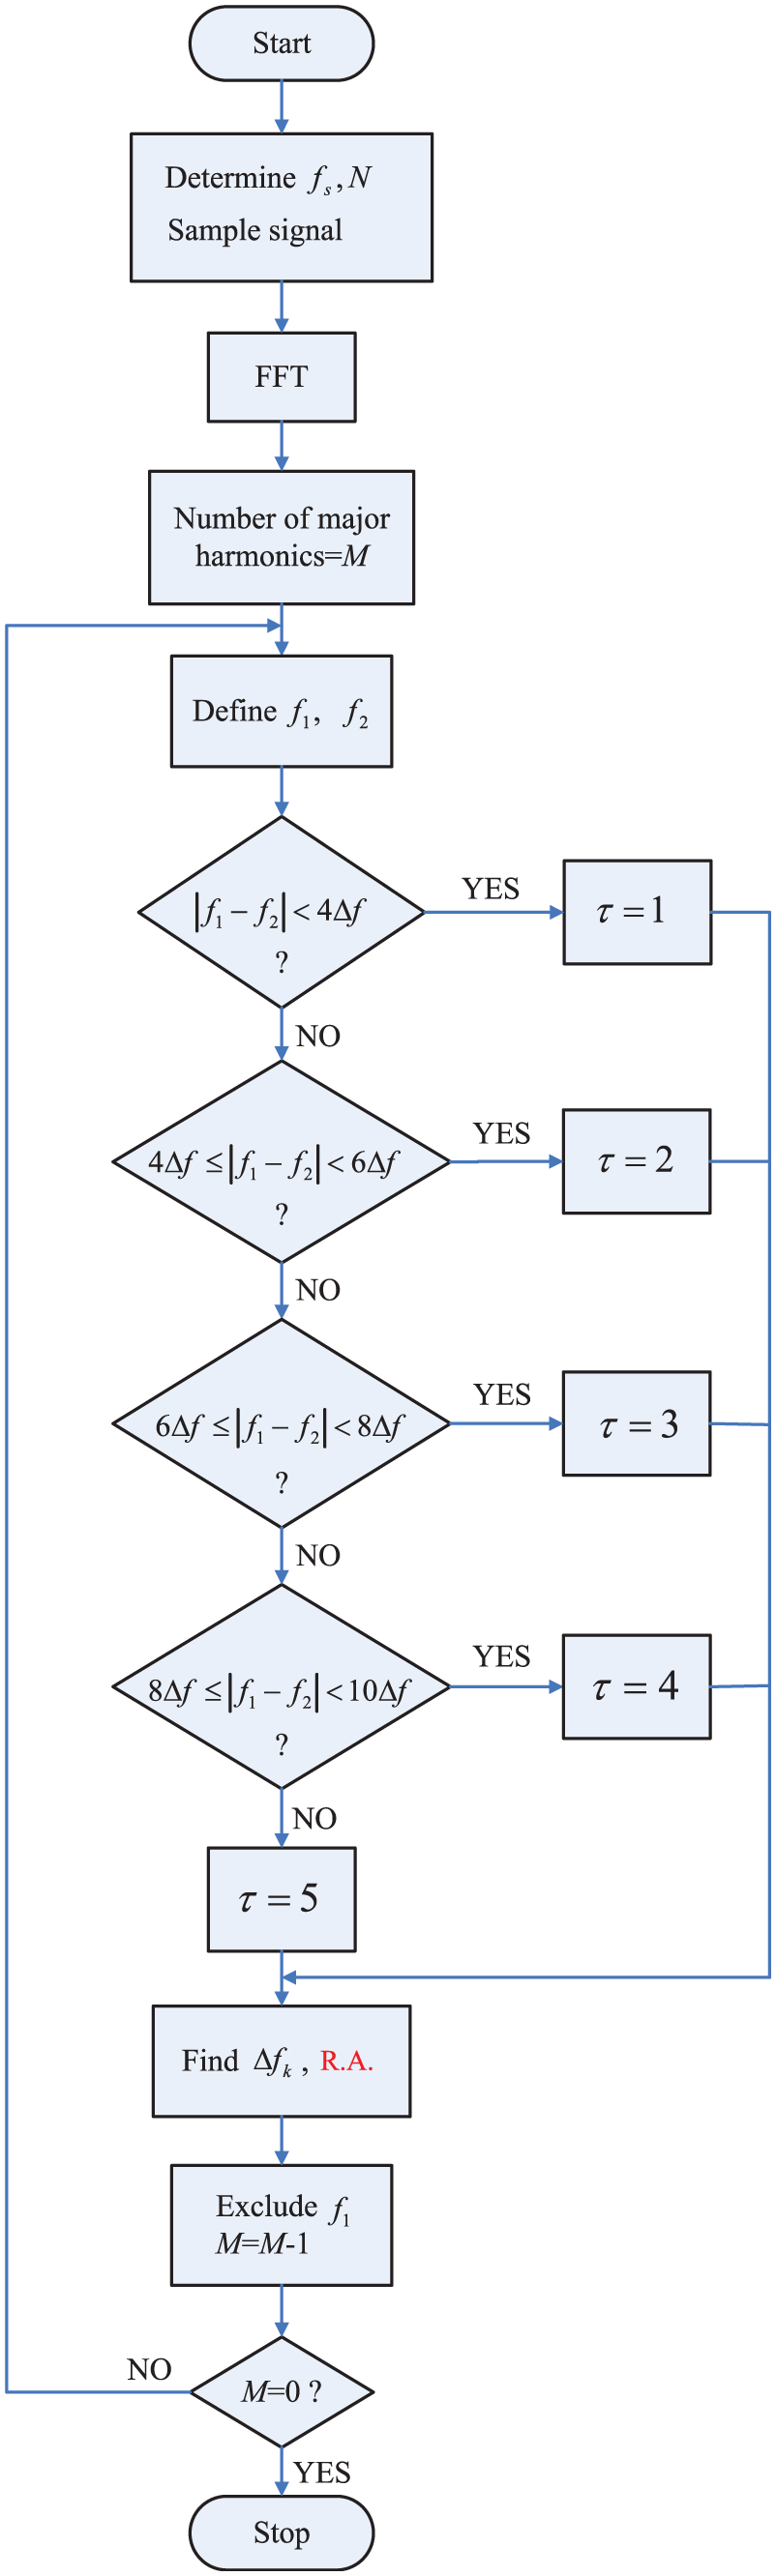
Flowchart of the proposed e-FFT model. 39
System structure
Setup of measurement platform
In the performance test, the proposed vibration measurement system uses the tool machine (QUASER CNC, MV184) combined with accelerometer, as shown in Figure 3. It mainly consists of five parts, which are described in the following.
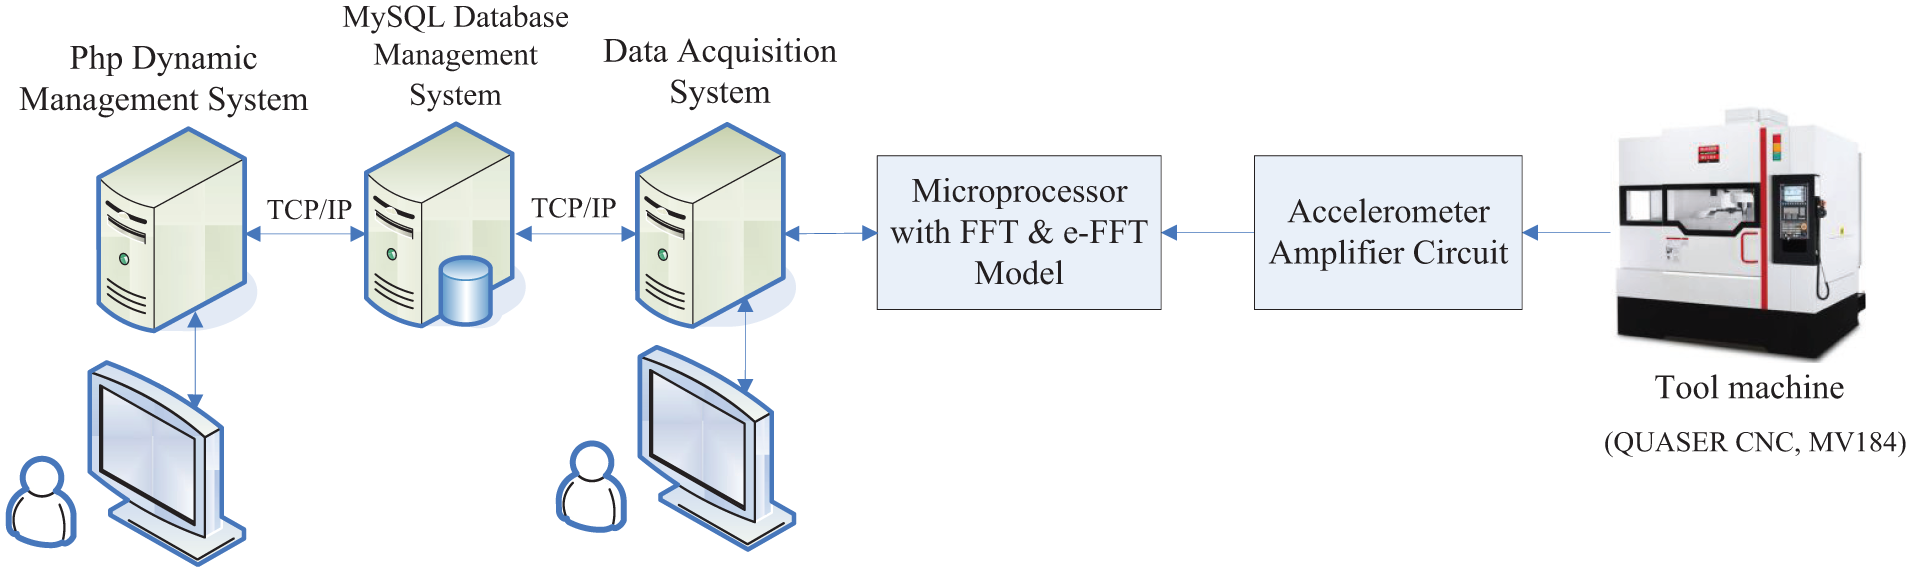
Experimental platform.
The major blocks in Figure 3 are described as follows.
Microprocessor with FFT and e-FFT model. The microprocessor (PIC18F4520) is used to implement FFT and e-FFT algorithms. It also acts as a communication bridge between the computer (Data Acquisition and Display System) and signal sources, for example, function generator or accelerometer amplifier circuit.
Accelerometer amplifier circuit. The accelerometer (PCB352A25/NC) struck on the tool machine can detect the vibration signal that is then amplified and input to the microprocessor, as shown in Figure 4. The circuit has four parts: Part A is a buffer circuit to provide a high-input impedance, and it can receive the signal from the accelerometer without loss. Part B is an amplification circuit to amplify the detected signal of accelerometer with magnification factor = 158. Part C is a clamp circuit that magnifies the signal 6.8 times with limiting the output signal at the 5 V level. Part D is a second-order filter to filter out the noise signal and allows only 0.6–6 k(Hz) signals to pass through the circuit. Note that sensitivity of the accelerometer (PCB352A25/NC) is 2.5 mV/g.
Data acquisition system. It is designed to receive the data, that is, real-time results from FFT and e-FFT models, and all data received can be thus transmitted to the data server immediately.
MySQL database management system: It works as a data server using the MySQL database to receive the data from the Data Acquisition System.
Hypertext preprocessor dynamic management system. Based on hypertext preprocessor (PHP), it can display all real-time vibration data with FFT and e-FFT analyses. All historical records can also be tracked.
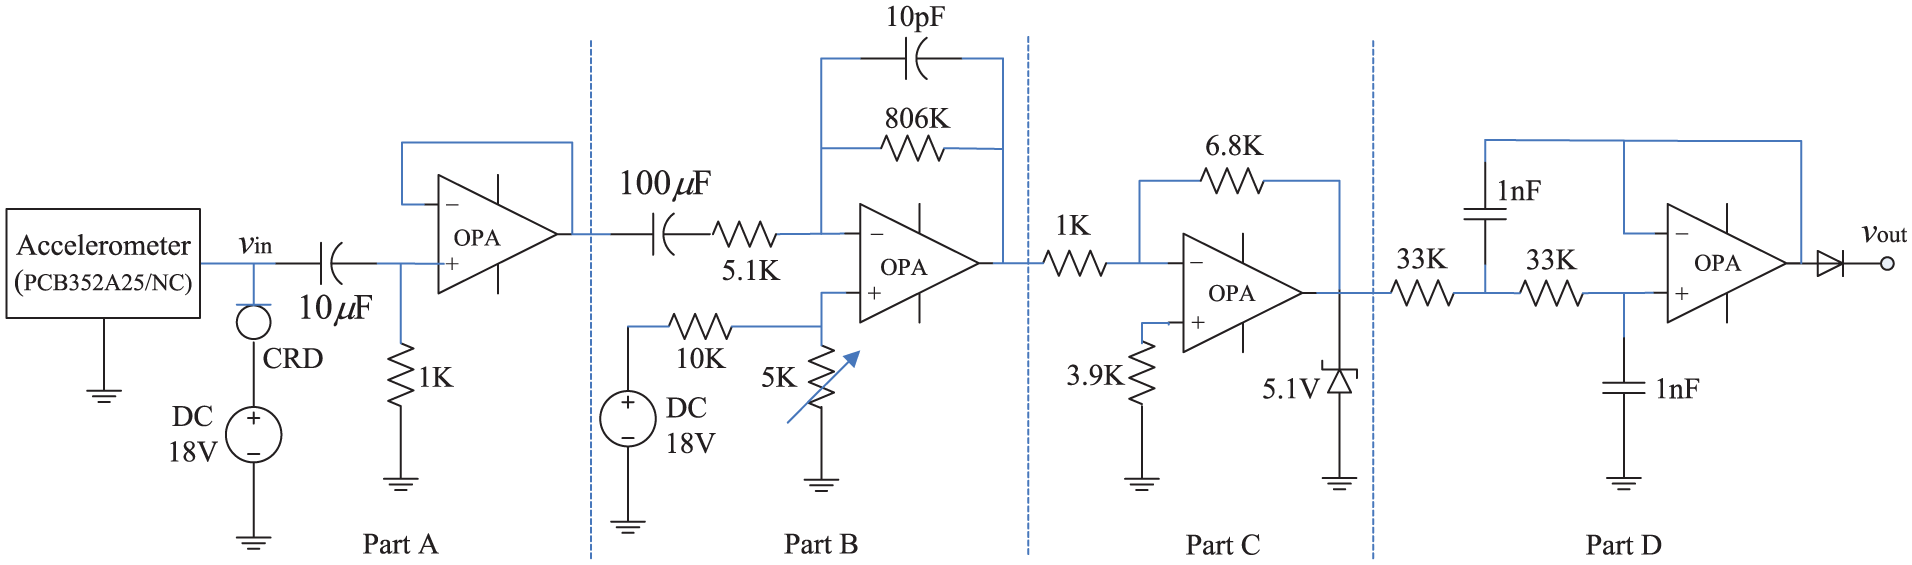
Accelerometer amplifier circuit.
System execution
The system execution block is shown in Figure 5. In the Data Acquisition System, it gives a command to receive the signal spectrum data transmitted from the microprocessor. The received data are then displayed on line and written to MySQL database at the same time. PHP Dynamic Management System can access to MySQL database to upload all real-time vibration data and display dynamic data on line. All historical records can also be tracked. In the Microprocessor with FFT and e-FFT model, the vibration signal is acquired via accelerometer amplifier circuit. Then, the microprocessor performs FFT and e-FFT computation, where the signal will be thus transformed to frequency domain from time domain. All computation results (spectrum) are temporarily stored in the memory before reading out once the command is received from the Data Acquisition System. Finally, the spectrum data are transmitted to the Data Acquisition System. This procedure will continue until the system stops.

System execution block.
Experimental results
The experimental tests are divided into two parts: (1) standard signal calibration and (2) practical performance. The standard signals include sine waveform, integer harmonics signal, non-integer harmonics signal, and SHAKER signal. The practical performance will test the vibratory magnitude from the cutting processing of computer numerical control (CNC) machine.
Standard signal calibration
The precision of the proposed vibration measurement system is calibrated using pre-known signal generated from the function generator. The signal acquisition takes 1024 points using 2.048 kHz sampling rate, where
Sine waveform (frequency: 120 Hz and ampere: 0.78 V). The results from 120 Hz sine waveform analysis is shown in Figure 6. The amplitude is equal to 0.78 V so that the real spectrum magnitude is 0.312g. The results reveal that the implementation for both FFT and e-FFT methods can achieve an accurate spectrum analysis due to no leakage in this case.
Sine waveform (frequency: 121 Hz and ampere: 0.78 V). The results from 121 Hz sine waveform analysis is shown in Figure 7. It is clear thate-FFT method can obtain the spectrum magnitude = 0.307g that is very close to the real value (0.312g). Also, the major spectrum frequency is 121.2 Hz that is very close to the real value (121 Hz). However, the result from the FFT analysis shows that the spectrum magnitude is 0.199g, and the frequency is 122 Hz. It is obvious that the errors occur due to a leakage phenomenon for this case.
Square waveform (frequency: 120 Hz and ampere: 0.72 V). The waveform of 121 Hz square signal is shown in Figure 8(a), and its spectrum analysis is shown in Figure 8(b). The major amplitude of spectrum is 0.407g for either e-FFT or FFT due to no spectrum leakage in this case.
Square waveform (frequency: 121 Hz and ampere: 0.72 V). The waveform of 121 Hz square signal is shown in Figure 9(a), and its spectrum analysis is shown in Figure 9(b). The major amplitude and respective frequency of spectrum using e-FFT model is about 0.4g and 121 Hz, respectively, very close to the real ones. However, the spectrum analysis using FFT shows that the major amplitude and respective frequency of spectrum are 0.263g and 122 Hz, respectively, indicating some errors due to the spectrum leakage.

Spectrum analysis of 120 Hz sine waveform: (a) waveform and (b) spectrum of e-FFT and FFT.
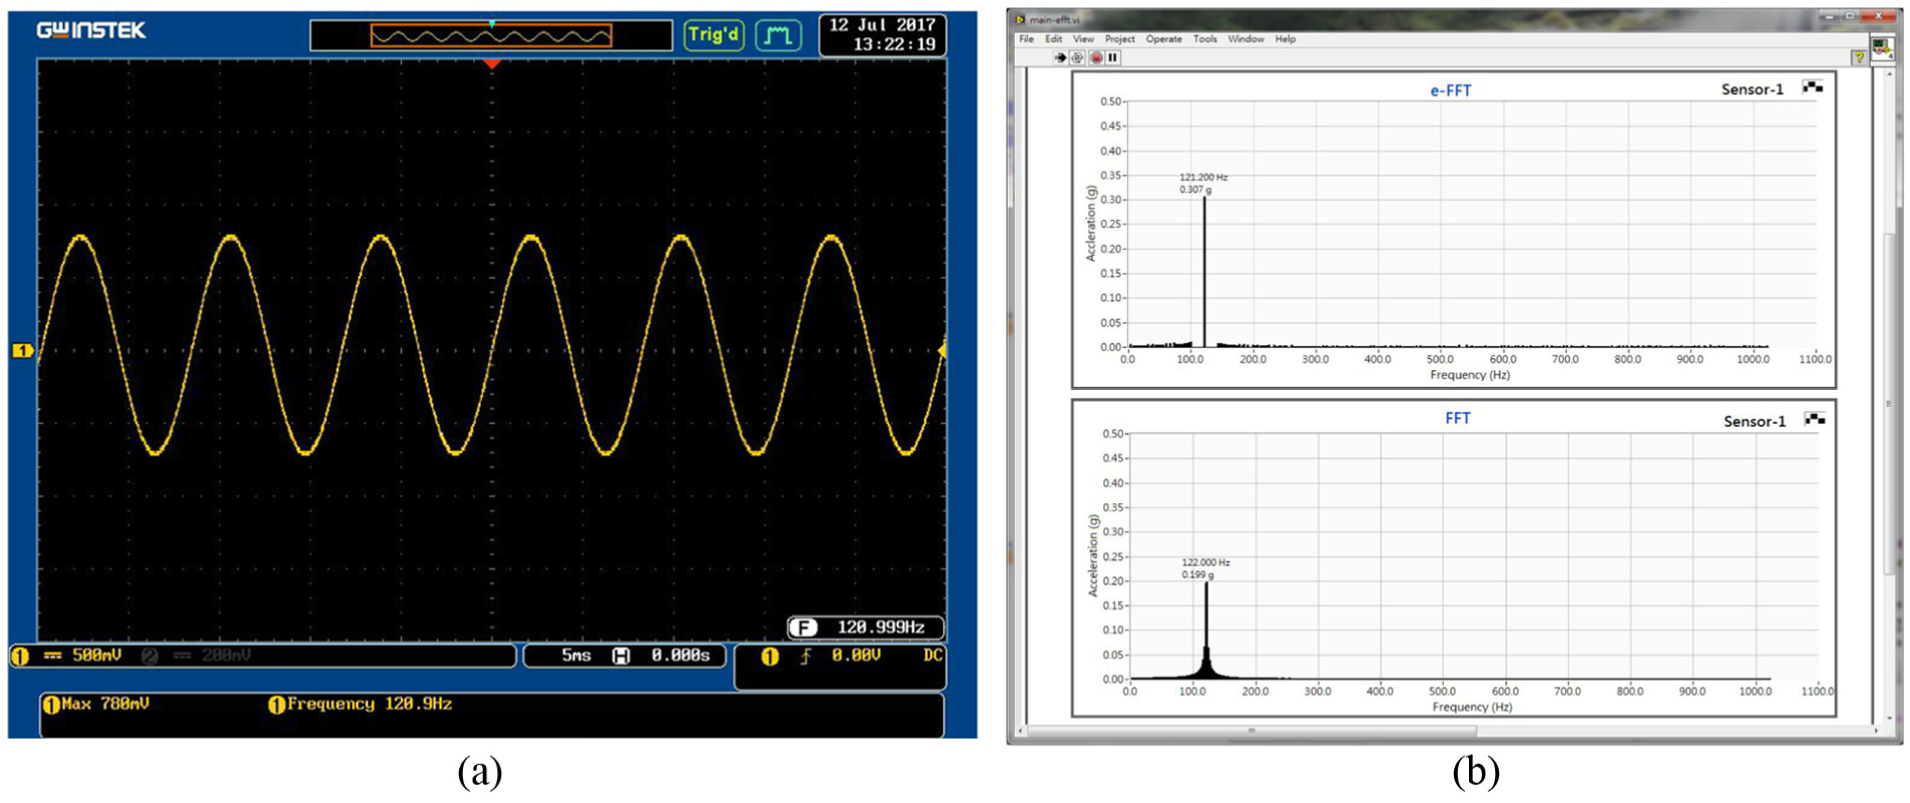
Spectrum analysis of 121 Hz sine waveform: (a) waveform and (b) spectrum of e-FFT and FFT.

Spectrum analysis of 120 Hz square waveform: (a) waveform and (b) spectrum of e-FFT and FFT.

Spectrum analysis of 121 Hz square waveform: (a) waveform and (b) spectrum of e-FFT and FFT.
Real-time signal performance
In this section, there are three kinds of real-time signals to test: (a) synthetized signal generated from the NI-DAQ output using LabVIEW programming, (b) vibration signal generated from SHAKER device, and (c) vibration signal detected from the tool machine. These tests sampled the waveform with 1024 points based on 2.048 kHz sampling rate, that is,
(a) Synthetized signal test. The synthetized signal
The results of spectrum analysis using built-in FFT of LabVIEW, built-in FFT of scope, e-FFT and FFT of microprocessor are shown in Figures 10(a)–(c), respectively.
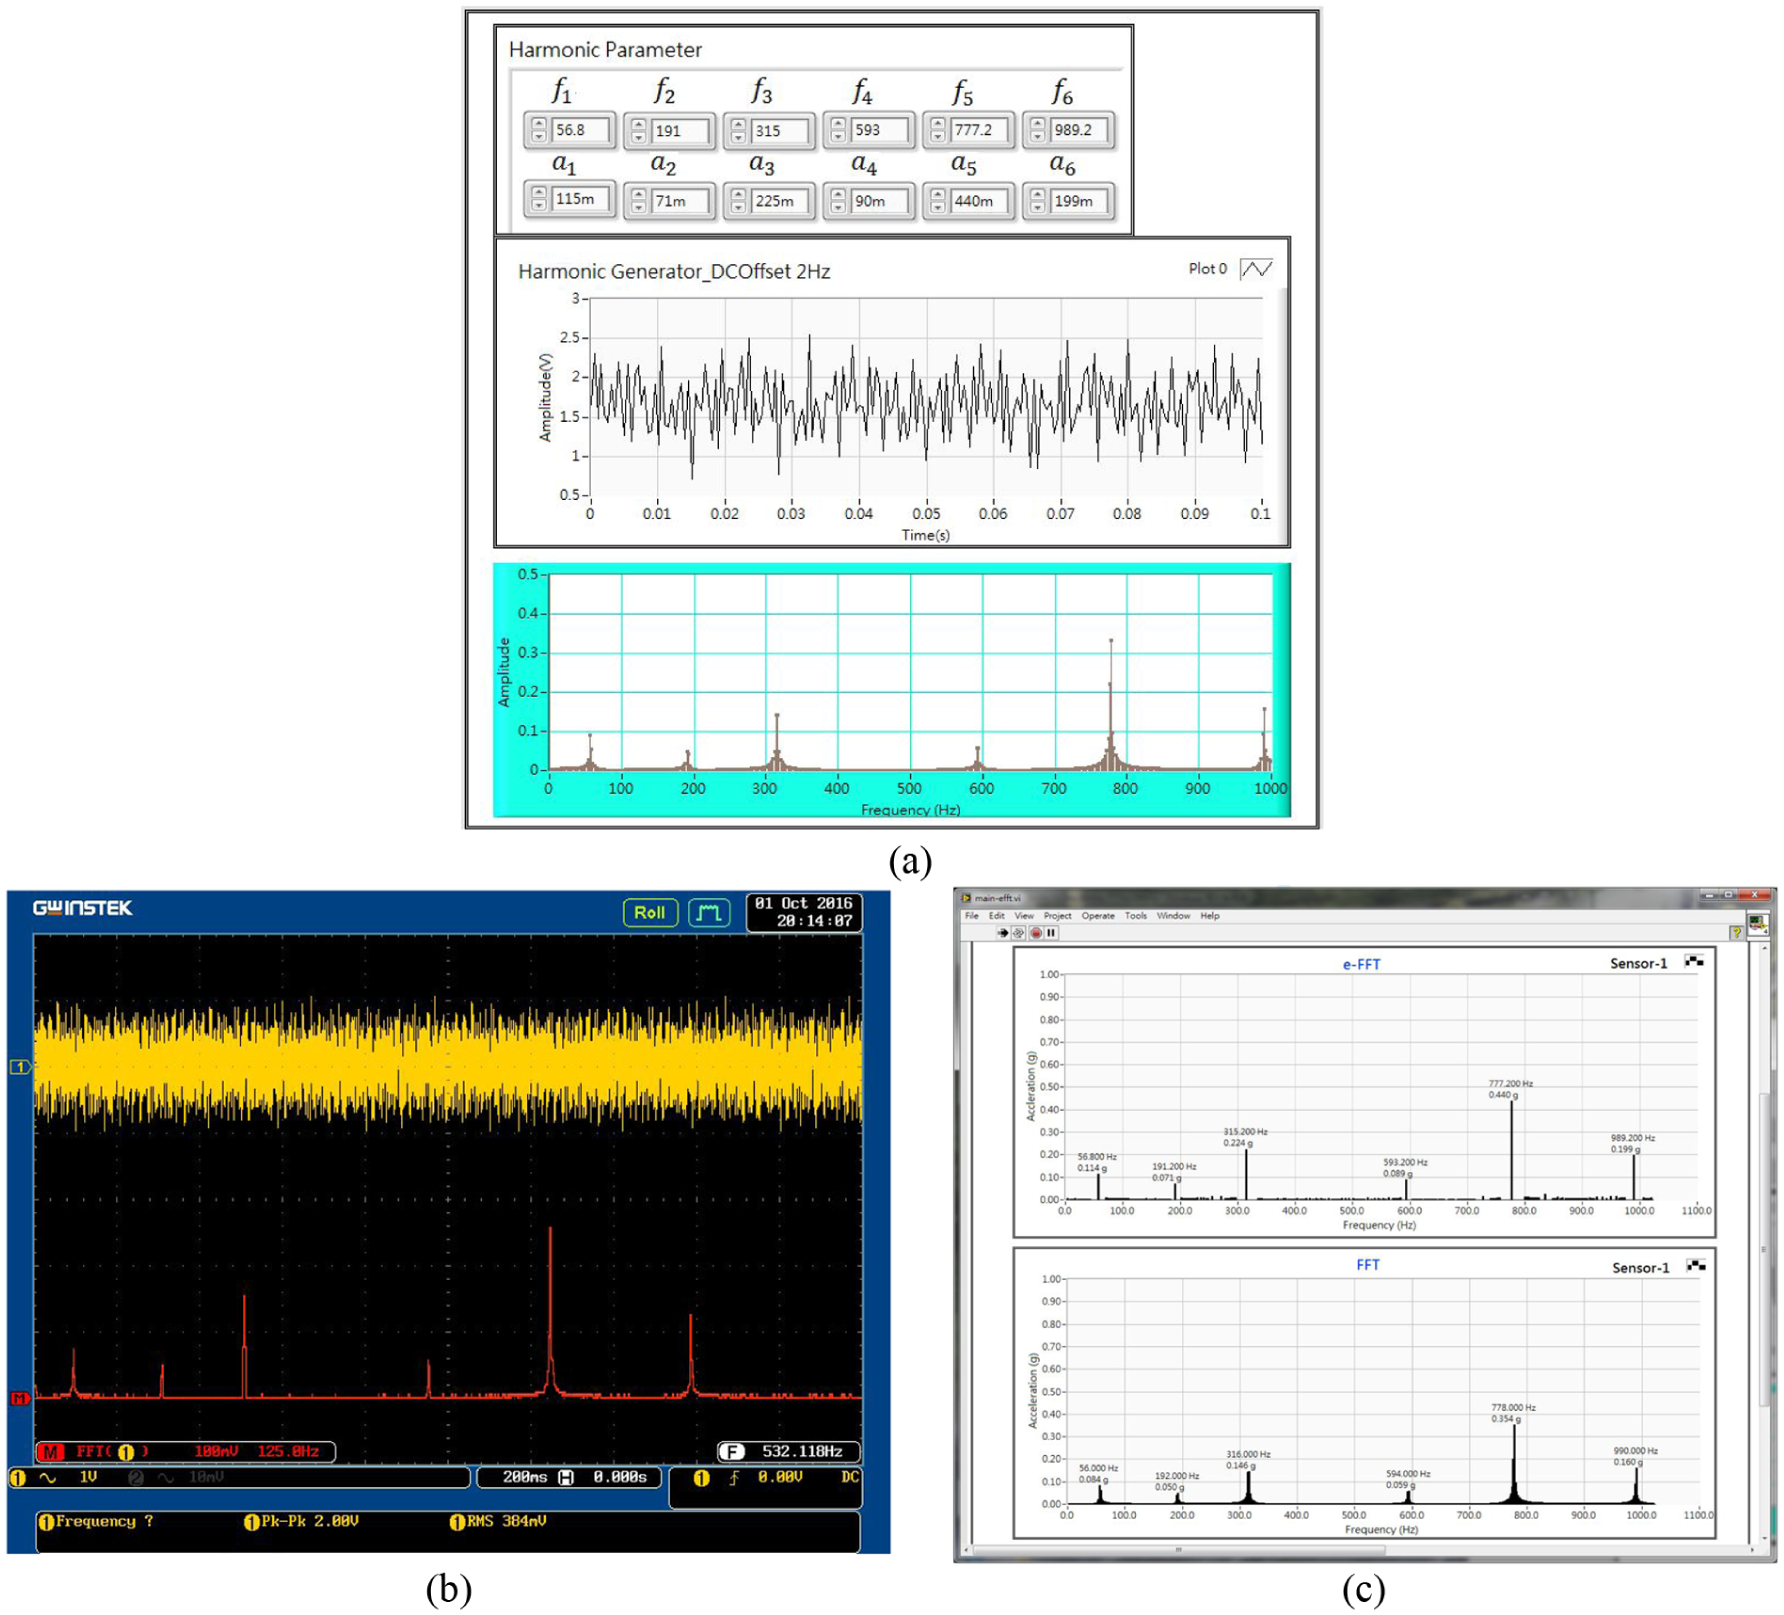
Synthetized signal analysis: (a) waveform spectrum analysis using built-in FFT in LabVIEW, (b) waveform spectrum analysis from scope using built-in FFT, and (c) spectrum analysis from NI-DAQ using e-FFT and FFT.
(b) Shaker signal test. The shaker can receive the signal from the function generator and then produce the respective vibration signal to be detected by the accelerometer, where the shaker test used MINI SMARTSHAKER (model: K2004E01) shown in Figure 11.
Sine waveform (frequency: 200 Hz and ampere: 0.3 V). The spectrum analysis from the shaker and microprocessor is shown in Figure 12. The shaker receives the sine waveform (frequency: 200 Hz, ampere: 0.3 V) generated from the function generator. The results of spectrum analysis from scope using built-in FFT and from microprocessor using e-FFT and FFT are shown in Figures 12(a) and (b), respectively, indicating all results are almost identical due to no leakage. However, it can be seen that the detected vibration strength is 260 mV that has a slight attenuation, where its frequency (200 Hz) has no change.
Sine waveform (frequency: 501 Hz and ampere: 0.3 V). The spectrum analysis from the shaker and microprocessor is shown in Figure 13. The shaker receives the sine waveform (frequency: 501 Hz and ampere: 0.3 V) generated from the function generator. The results of spectrum analysis from scope using built-in FFT and from microprocessor using e-FFT and FFT are shown in Figures 13(a) and (b), respectively. Obviously, it can be seen that the result using e-FFT model can pursue a more accurate outcome than FFT model form either scope or microprocessor in the both frequency and amplitude measurement. Note that the detected vibration strength from the shaker is 166 mV that has an evident attenuation.

Profile of SMARTSHAKER (K2004E01).

Spectrum analysis from shaker at 200 Hz: (a) spectrum analysis from scope using built-in FFT and (b) spectrum analysis from microprocessor using e-FFT and FFT.

Spectrum analysis from shaker at 501 Hz: (a) spectrum analysis from scope using built-in FFT and (b) spectrum analysis from microprocessor using e-FFT and FFT.
(c) Cutting buffeting test. In this test, the tool machine (QUASER CNC, MV184) used 6060 aluminum alloy to implement a cutting process, where sampling rate is 8.192 kHz, sampled points are 1024, that is,
Figure 14 indicates that the dominant vibration frequency and spectrum strength using e-FFT is 1.146 kHz and 0.880g, respectively. However, the dominant vibration frequency and spectrum strength using FFT are 1.144 kHz and 0.788g, respectively. It is proved that that e-FFT has a better solution than FFT to restore the original spectrum frequency and amplitude.

Spectrum analysis from tool machine.
Conclusion
Although FFT is still widely applied to signal analysis in industry, it may suffer from incorrect outcomes if the vibration frequency is non-integer due to spectrum leakage. In e-FFT model, the relation between vibration frequency and dispersed leakage caused from FFT can be induced. The spectrum of individual frequency and amplitude can be thus accurately calculated. This article has reviewed and compared both e-FFT and FFT models in vibration measurement. Before practical analysis, the models were calibrated with pre-known sine and triangle waveforms. The group bandwidth
Footnotes
Handling Editor: Ali Kazemy
Declaration of conflicting interests
The author(s) declared no potential conflicts of interest with respect to the research, authorship, and/or publication of this article.
Funding
The author(s) received no financial support for the research, authorship, and/or publication of this article.