
Abstract
Countless applications today are using mobile robots, including autonomous navigation, security patrolling, housework, search-and-rescue operations, material handling, manufacturing, and automated transportation systems. Regardless of the application, a mobile robot must use a robust autonomous navigation system. Autonomous navigation remains one of the primary challenges in the mobile-robot industry; many control algorithms and techniques have been recently developed that aim to overcome this challenge. Among autonomous navigation methods, vision-based systems have been growing in recent years due to rapid gains in computational power and the reliability of visual sensors. The primary focus of research into vision-based navigation is to allow a mobile robot to navigate in an unstructured environment without collision. In recent years, several researchers have looked at methods for setting up autonomous mobile robots for navigational tasks. Among these methods, stereovision-based navigation is a promising approach for reliable and efficient navigation. In this article, we create and develop a novel mapping system for a robust autonomous navigation system. The main contribution of this article is the fuse of the multi-baseline stereovision (narrow and wide baselines) and laser-range reading data to enhance the accuracy of the point cloud, to reduce the ambiguity of correspondence matching, and to extend the field of view of the proposed mapping system to 180°. Another contribution is the pruning the region of interest of the three-dimensional point clouds to reduce the computational burden involved in the stereo process. Therefore, we called the proposed system multi-sensors multi-baseline mapping system. The experimental results illustrate the robustness and accuracy of the proposed system.
Introduction
The main focus of autonomous mobile-robot navigation research in indoor environment is to allow a mobile robot to navigate without collision. Robots are equipped with many sensors, such as cameras, lasers, infrared sensors, global positioning system (GPS), and ultrasonic sensors, which allow them to perceive their environment. In recent years, several researchers have looked at methods for setting up mobile robots for autonomous navigation task. Autonomous navigation includes several interrelated steps including mapping (Figure 1).
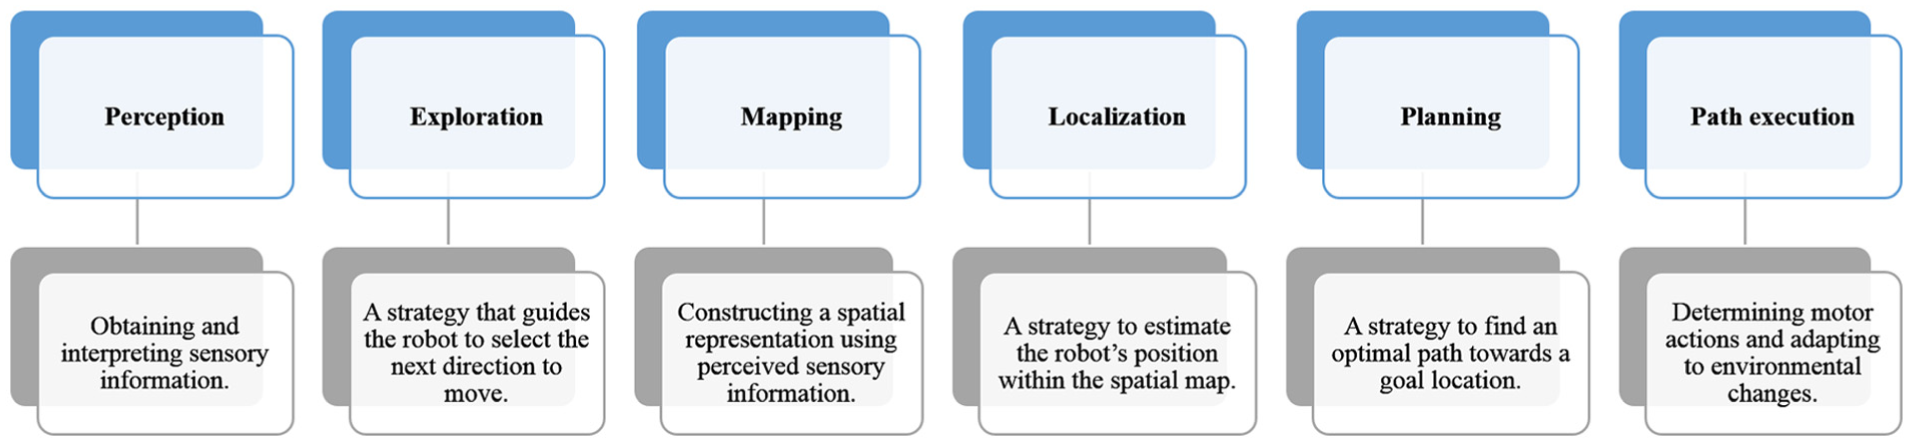
Autonomous navigation steps.
Mapping in robotic is the task of constructing a spatial representation of a robot environment. Until the 1990s, the field of robotics mapping was separated into two categories either metric or topological approaches.1,2
Metric maps are based on absolute reference frames and numerical estimation of where objects are in the space. In the metric framework, the environment is represented as a set of objects with coordinates in a two-dimensional (2D)/three-dimensional (3D) space. In other words, metric maps capture the geometric properties of the environment. The topological maps describe the connectivity of different places. They represent the map by determining the occupied and free space grid in the map of the environment. Later in 2000s, the probabilistic techniques became dominant in the field of robotics. Mapping in the robotics is referred as the simultaneous localization and mapping (SLAM)3,4 or concurrent mapping and localization (CML).5,6 Regardless the types of mapping, robot must be equipped with sensors that enable it to observe its environment. Robot’s sensors that are used in mapping can be divided as follows:
Non-vision sensors (e.g. laser, ultrasonic, infrared, or radar);
Vision sensors (e.g. monocular camera, stereo camera, or Kinect camera);
Multi-sensors (vision sensors with non-vision sensors).
Non-vision sensors, such as ultrasonic and laser, are range distance measurements. Ultrasonic sensors depend on sound propagation, whereas laser-range distance sensors are based on propagation of electromagnetic waves. Ultrasonic and laser-range sensors have been used for mapping operation in the mobile-robot navigation.7–9 However, ultrasonic, laser rangefinder, or infrared sensors cannot capture color and texture features of the environment and suffer from other propagation sounds, electromagnetic waves, or light.10,11 In addition, they are affected by soft surfaces and specular reflection and have a high sensitivity to external electric fields.10,11
Among autonomous navigation methods, vision-based systems have been growing in recent years due to rapid gains in computational power and the reliability of visual sensors. In this research, the major enhancements concern the main aspects of the autonomous navigation system: the mapping operation. This involves building an accurate, real-time mapping system for mobile robots to be used in any unstructured, unknown environment.
This article is organized as follows. First, literature review is presented; second, the proposed multi-sensors multi-baseline mapping system (3MS) system is explained; third, system integration is presented; fourth, the experiments of 3MS are explained; fifth, the 3MS with other systems is compared; and finally, conclusion is given.
Literature review
Stereovision and mapping involve many algorithms and techniques, such as multi-baseline stereo, feature-point detection, obstacle detection, and accurate floor detection. Much research has dealt with the shortcomings of stereovision. Some approaches depend on using multiple images,12–15 while others use filters for false pixels.15,16 Still other methods use very small baselines, called micro-baselines.12,13 Micro-baselines of a few millimeters provide the advantage that they can be captured using a single camera. That is, a “static” camera, either hand-held or mounted on a tripod, will typically vibrate some small amount while capturing video. The aim of stereovision algorithms is to rebuild a 3D image of a scene from multiple images. Multi-baseline is one type of binocular stereo. Standard binocular stereo works using two views of a scene, while multi-baseline stereo uses three or more. More views not only provide a better signal-to-noise ratio, but also eliminate most repetitive structures. Multi-baseline stereo has been used in the past to optimize grid-maps. The first practical use of occupancy grids may be attributed to A Elfes. 17 Another use of occupancy grids was applied by D Murray and C Jennings. 18 However, these approaches suffer from typical shortcomings of stereovision-based mapping, including sensitivity to false positives when observation time of the environment is short (due to a slower convergence rate while updating occupancy probability). In Lategahn et al., 19 an interesting occupancy grid-mapping technique was presented that uses both dense and sparse point clouds from stereovision and SLAM, respectively (structure and motion). In this case, although the algorithm appears to address false positives relatively well, there is a weakness in encountering outliers, as no multi-view, multi-baseline stereo-matching technique is utilized. Several other techniques in the literature attempt to utilize multi-baseline stereo at the level of local stereo matching or multi-view stereo in order to filter noise, such as Kuhn et al., 20 Milella et al., 21 Gallup et al., 22 and Wang et al., 23 but no technique was found to use higher level, multi-baseline filtering or to use such filtering in combination with multi-view stereo filtering. Regardless of the number of baselines or views, a good feature-point detector is absolutely essential for vision-based navigation. 24 The 3D point cloud retrieved via stereovision can be further filtered to detect good feature points. An accurate approach used for mapping applications is to detect 3D feature points within the point cloud provided by the stereovision camera. Well-known techniques for such purposes are point feature histogram (PFH), 25 normal aligned radial feature (NARF) points, 26 spin-image, 27 and Eigen-cascading style sheets (CSS), 28 as well as many other techniques.29,30 These feature points help in the process of “point-cloud registration” 25 and thus result in point clouds that are well-aligned (stitched), although these have been gathered at temporally and spatially varying poses of a stereovision camera. If point-cloud registration is performed accurately, the resultant point cloud can be used for effective navigation; otherwise, a common problem, termed the “sliding problem,” 25 renders the overall mapping process erroneous. Many methods deal with the accuracy of 3D reconstruction, but ground-plane detection using minimal or noisy 3D data 31 and detection of dominant planes in the environment is a detailed area of research in itself. Plane fitting is a common method for ground estimation. Among surveys, very few works suggest a method that detects both dominant and subdominant planes along with the height-based classification of obstacles. Among other obstacle-detection methods, some researchers such as Ambrosch and Kubinger 32 and Matthies and Shafer 33 completely ignore the significance of detecting the ground plane and variations within it, while others such as Fazl-Ersi and Tsotsos 34 use pixel-based region segmentation and classification techniques that may or may not be able to classify floor anomalies. The random sample consensus (RANSAC) plane filter is a commonly used method to find disparities in ground pixels. 35 A road-detection algorithm called plane-fitting errors was developed by X Li et al. 36 This algorithm utilizes road features. In recent years, the V-disparity image has become common for ground-plane estimation.37–39 V-disparity and plane fitting both depend on distinct road features. An additional issue in stereovision-based navigation is obstacle detection. The authors in Ghayalod and Hall 40 gave an introduction to an obstacle-detection approach based on stereovision proposed for mobile-robot navigation. The aim of the approach is to detect a real environment in order to allow a mobile robot to find a safe path even in complex scenarios. The approach is novel in terms of the two-stage perception structure. The detection stage infers the relationship between obstacles and the ground and determines the region of interest (ROI). Based on this, the confirmation stage focuses on characterizing the contours and positions of obstacles and removing the majority of artifacts. A vision-equipped, apelike robot based on the remote-brained approach was presented by Inaba et al., 41 meant to study a variety of vision-based behaviors. The robot does not bring its own brain with its body, but leaves the brain in the mother environment and communicates with it by radio link. The brain is raised in the mother environment, which is inherited over generations. In this framework, the robot system can have a powerful vision system in the brain environment. They have applied this approach toward the formation of vision-based, dynamic, and intelligent behavior of a multi-limbed mobile robot.
Proposed 3MS system
3MS enhances the mapping operation by building an accurate and real-time 3D map to use in any unstructured, unknown environment, regardless of the kind of application. 3MS fuses multi-baseline stereovision (narrow and wide baselines) and laser-range reading data to enhance the accuracy of the point cloud. Therefore, it combines the advantages of multi-baseline stereovision, a laser-range device, and multi-view (stereovision camera and laser-range device), as follows:
The wide baseline and high resolution provide more precise 3D points at longer ranges.
The narrow baseline improves close-range matching and solves minimum-range limitations.
The laser-range device extends the 2D field of view (FOV) to 180°.
The laser-range device allows the system to work under different light conditions.
Combining wide/narrow baselines and a laser reduces the ambiguity of correspondence matching, enhances its accuracy, and extends the FOV of 3MS to 180°.
Combining stereovision and a laser allows 3MS to prune the horizontal angle of the ROI of the 3D point clouds to 66° and to work within a 180° FOV.
Pruning the ROI of the 3D point clouds reduces the computational burden involved in the stereo process.
The overall vision of the 3MS is a horizontal angle of 180° on the x-axis and a vertical angle of 32° on the front (66°) y-axis, and 7 m on the z-axis.
The system therefore constructs better 3D point clouds to map the environment. 3MS consists of four modules, each executing specific tasks: (1) the initial processing module (IPM), (2) the pre-processing module (PPM), (3) the stereo processing module (SPM), and (4) the post-processing module (PM), as illustrated in Figure 2. In this section, we discuss in detail each component and module in the 3MS system.

General modules of the proposed system.
ROI of 3MS
The ROI of the proposed 3MS is composed of four intersecting FOVs. Three FOVs belong to the stereovision camera (wide at 24 cm, left narrow at 12 cm, and right narrow at 12 cm), as illustrated in Figure 3(a), and one belongs to the laser device (Figure 3(b)).

ROIs of 3MS: (a) ROI of three stereo baselines (R1 is red, R2 is green, and R3 is blue) and (b) ROI of the laser device (R4).
Initial processing module
IPM is the startup module for the system. It initiates system execution by starting up and configuring the system components (mobile robot, stereovision camera, and laser-range device), as illustrated in Figure 4.
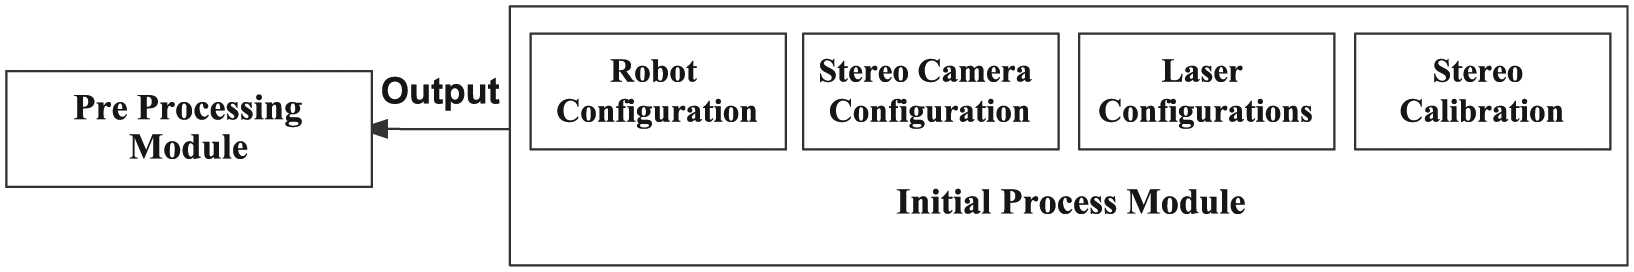
Initial processing module.
Pre-processing module
PPM enhances the captured raw images from the stereo camera for the SPM. It comprises four main steps: (1) determining the ROI (R1–R4), see Figures 3 and 9; (2) capturing the stereo images; and (3) image rectification and edge detection. As can be seen in Figure 5, the first step is to determine the ROI of the three baselines of the stereovision camera. The second step is to capture images with three distinct baseline configurations: wide (24 cm), left narrow (12 cm), and right narrow (12 cm). The third step is to rectify the images and detect the images’ edges.

Pre-processing module.
Stereo processing module
SPM receives the stereo images from the PPM, generates the point clouds of each baseline, and then merges these clouds. It comprises four main steps (Figure 6): (1) stereo matching, (2) point-cloud extraction, (3) point-cloud filtering, and (4) point-cloud fusion. The first step performs the matching processing of each pair of images (left narrow, wide, and right narrow). The second step extracts the point cloud of each pair of images (according to the proposed stereo ROI, R1–R3, see Figure 3(a)), and then the third step filters each point cloud for unnecessary data. The fourth merges all stereo point clouds (R1–R3) into one point cloud, as illustrated in Figure 7. The matching process is performed via the sum of absolute differences (SAD) algorithm. Surface- and texture-validation filters are used to enhance the stereo-matching operation. Many parameters affect matching processing, such as image resolution, disparity range, mask size, surface validation, and texture validation. Two image resolutions are used, 1280 × 960 and 640 ×480 for wide and narrow baselines, respectively. Maximum disparity ranges of 240 are used for both baselines. The mask size is set to 13, the threshold of the texture-validation filter is set to 0.8, and the size of the surface-validation filter is set to 120.
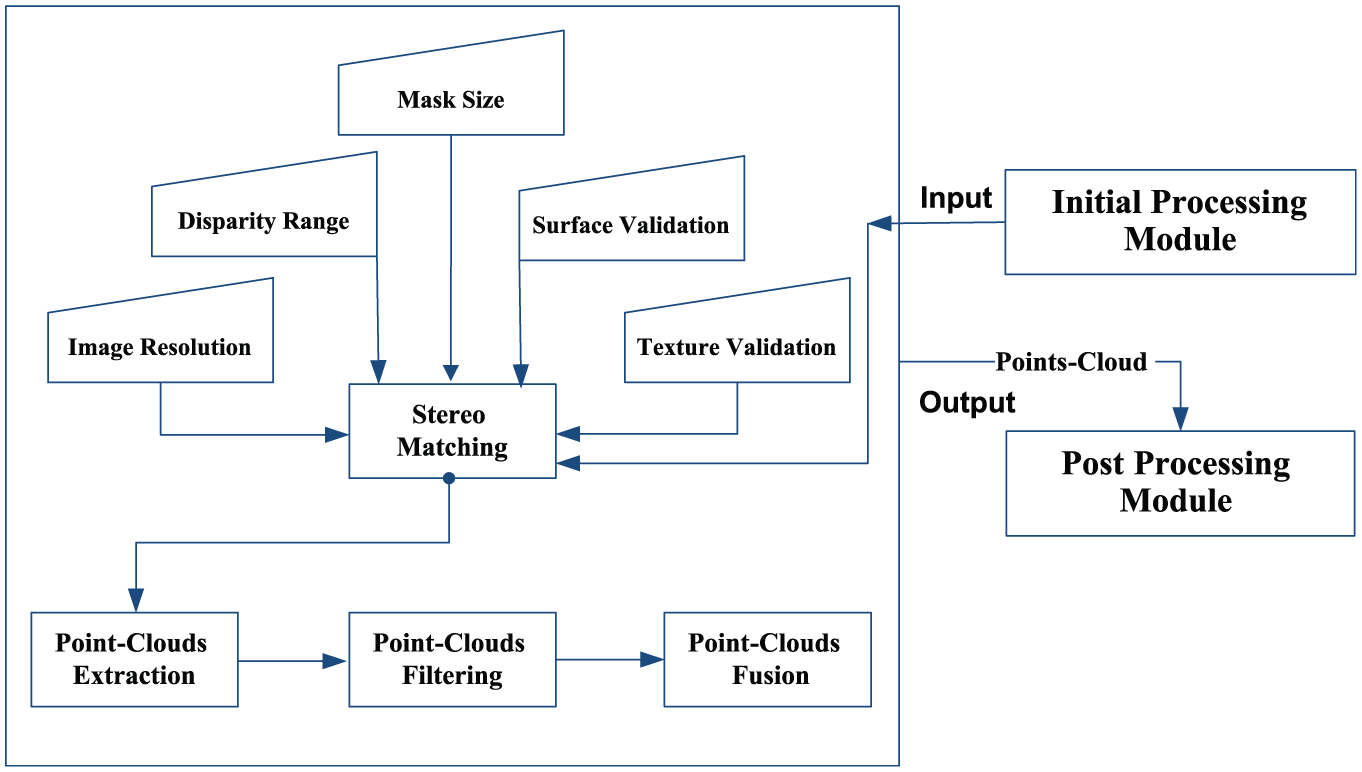
Stereo processing module.

Fused point cloud.
Post-processing module
PM fuses the laser reading and point clouds from the stereovision to produce the output map. It comprises two main steps (see Figure 8): (1) location adjustment and (2) fusion. The location adjustment step adjusts the position of the laser-reading points and point clouds with respect to the position of the robot. This enhances the fusion of the laser-reading data with the point clouds from the stereovision of 3MS to deduce reliable localization information. All point clouds, R1–R4 are fused into one point cloud, as illustrated in Figure 9(a)–(c). Figure 9(a) illustrates the rear view of the fused point cloud, while Figure 9(b) illustrates the side view of the fused point cloud and Figure 9(c) illustrates the top view of the fused point cloud.
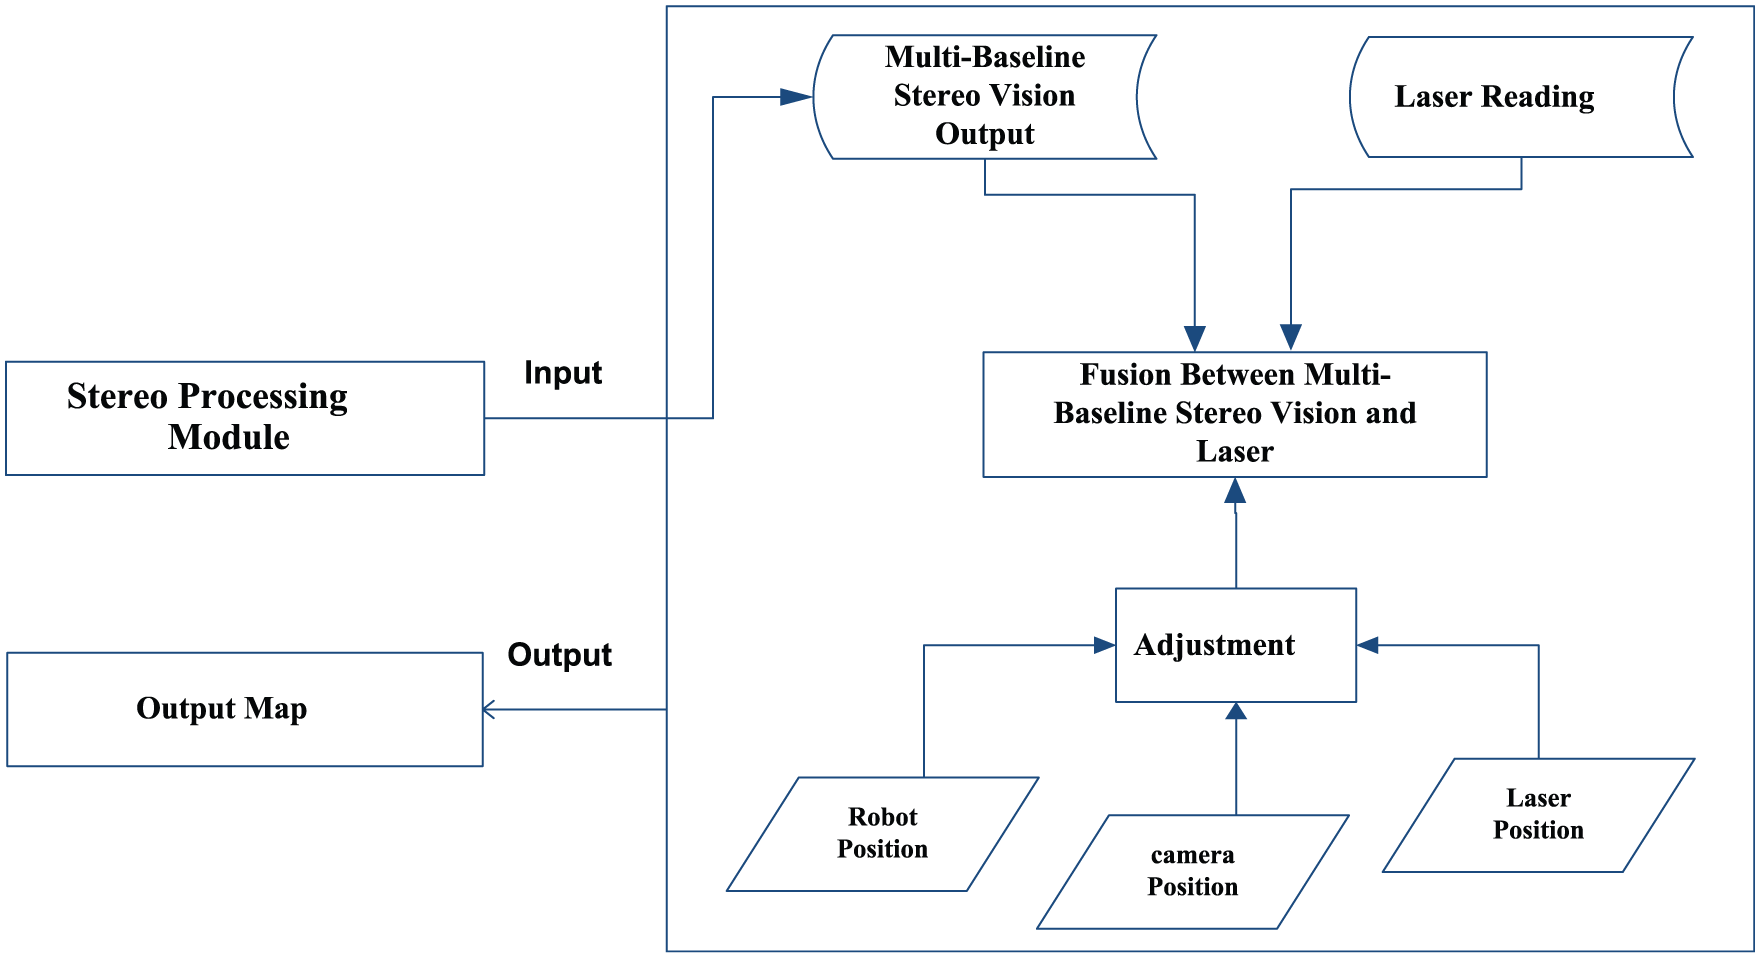
Post-processing module.
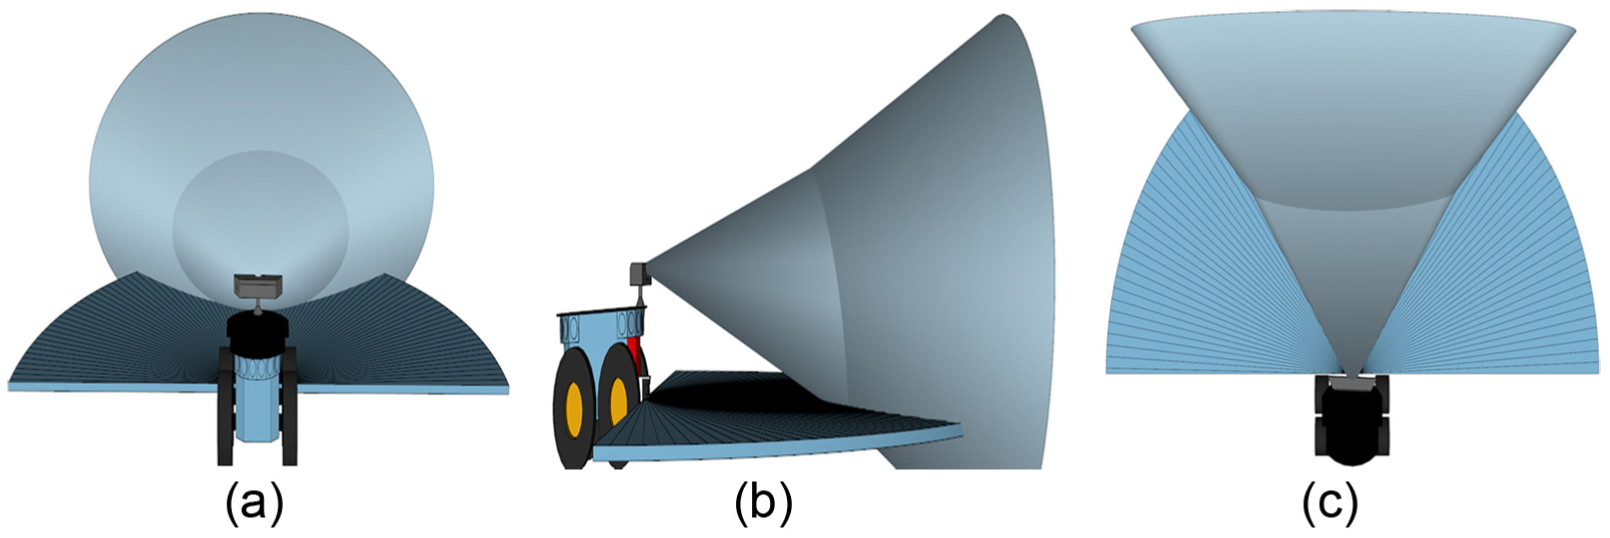
Fused point cloud of the proposed 3MS: (a) rear view of the proposed ROI; (b) side view of the proposed ROI; (c) top view of the proposed ROI.
System integration
3MS comprises four modules—the IPM, PPM, SPM, and PM—that, as illustrated in Figure 10, each execute specific tasks and interact with other modules. The interaction between all these modules represents the whole system. As in the flowchart shown in Figure 10, 3MS begins with IPM to prepare the system components (mobile robot, stereovision camera, and laser-range device) and then switches control of the 3MS to the PPM. The PPM enhances the captured raw images from the stereo camera for the SPM. The PPM determines the ROI, captures stereo images, rectifies the images, and detects the images’ edges. Thereafter, control switches the flow of 3MS to the SPM. SPM receives the stereo images from the PPM, generates the point clouds of each baseline, and then merges these clouds. The SPM performs stereo-matching, point-cloud extraction, point-cloud filtering, and point-cloud fusion steps.

3MS integration.
After that, 3MS switches control to the PM. PM merges the laser readings and point clouds from the stereovision to produce the output map. It performs two main steps: (1) location adjustment and (2) fusion. Combining wide/narrow baselines and laser-range data reduces the ambiguity of correspondence matching, enhances accuracy, and extends the FOV of 3MS to 180°. And, the combination allows the 3MS to prune the horizontal angle of the ROI of the 3D point clouds to 66° and to work within a 180° FOV. In addition, pruning the ROI of the 3D point clouds reduces the computational time required by the stereo process.
Experiments
Experimental platform
The proposed system integrates three different types of hardware: a mobile robot, a stereo camera, and a laser-range device.
Mobile-robot platform
We used the PowerBot as mobile-robot platform 42 (Figure 11). PowerBot is a wheeled mobile robot from Pioneer Mobile Robots, Inc. It is an automated, differential-drive-guided vehicle specially designed and equipped for autonomous, intelligent delivery, and handling of large payloads. It is a member of the Pioneer series of mobile robots, which are research and development platforms. It can carry a load of up to 100 kg on its flat-top surface and navigate with a speed of up to 1.6 m/s. It comes with ultrasonic sensors, an optional vision system, and laser-rangefinder accessories attached to its front and integrates a full-size PC with limited specifications. We improved these specifications to the following: Intel Core i7 Processor, 16 GB RAM, 40 GB Solid-State Hard Drive, and Windows Embedded Standard 7 64-bit Operating System.

PowerBot mobile robot.
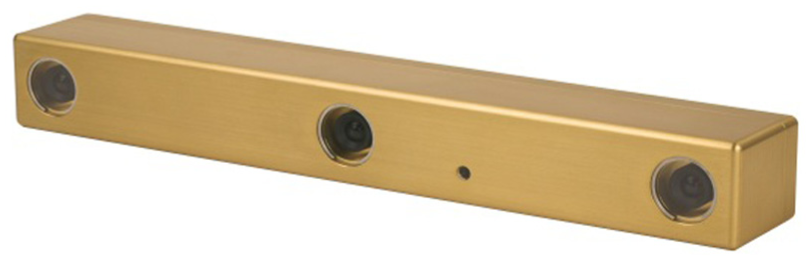
Stereo camera
We used a Bumblebee XB3 camera 43 as a stereo camera (Figure 12). The Bumblebee XB3 is mounted on top of the robot to provide information about the environment. The Bumblebee XB3 is a three-sensor, multi-baseline, IEEE-1394b (800Mb/s) camera. It features 1.3 megapixel sensors and has two baselines available for stereo processing. Its wide baseline and high resolution provide more precision at longer ranges, while the narrow baseline improves close-range matching and reduces minimum-range limitations. We used a Bumblebee camera with 1280 × 960@7.5 FPS resolution for the wide baseline and 640 × 480@15 FPS resolution for the narrow baseline.
Bumblebee XB3 camera.
Laser-range device
3MS uses the laser-range device that is mounted on the top of the front bumper of the PowerBot (SICK LMS-200, see Figure 13(a)). 42 The laser-range beam is 220 mm above the floor (Figure 13(b)). Data from the scanner are serial, acquired through the COM2 serial port on the onboard computer. SICK LMS-200 is located in the horizontal plane, relative to the center of the robot. This provides an offset from the laser readings’ origin to the robot’s position. X is the forward-back position (positive forward, negative backward), Y is the left-right position (positive right, negative left), and theta is the angle offset (counter-clockwise, usually 0). Left FOV and Right FOV indicate the total FOV or angle of sweep of the laser in degrees (typically, these are equivalent in magnitude since the FOV of the SICK LMS-200 is always centered). The integrated system platform is shown in Figure 14.

Laser-range device: (a) SICK LMS-200 and (b) laser mounted location.

Integrated system platform.
Experimental results
3MS was tested successfully many times in different indoor environments and in scenarios with varying degrees of obstacle complexity. The fused ROI depends on the laser reading and the stereovision output, as explained in the following:
R1 is the ROI of the left narrow baseline, with maximum horizontal angle of 43° on the x-axis, maximum vertical angle of 32° on the y-axis, and z-axis of 0.2–5.0 m.
R2 is the ROI of the wide baseline, with maximum horizontal angle of 66° on the x-axis, maximum vertical angle of 32° on the y-axis, and z-axis of 0.9–7.0 m.
R3 is the ROI of the right narrow baseline, with maximum horizontal angle of 43° on the x-axis, maximum vertical angle of 32° on the y-axis, and z-axis of 0.2–5.0 m.
R4 is the laser-range device, with maximum horizontal angle of 180° on the x-axis, maximum vertical angle of 1° on the y-axis, and z-axis of 0.0 m to the working range.
The first scenario included differently sized and shaped obstacles at different distances. The first obstacle was rectangular. Its center was located at X: 0.7 m, Y: 0.25 m, and Z: 1.5 m. The second obstacle was a chair. Its center was located at X: −0.33 m, Y: 0.42 m, and Z: 2.5 m. Some snapshots of the 3D point clouds from some experiments with the first scenario using the 3MS are displayed in Figure 15. Figure 15(a) shows the snapshot from a front angle, and Figure 15(b) shows the snapshot from a right angle, while Figure 15(c) and (d) shows the front angle snapshots of the chair and rectangular obstacles, respectively.

Snapshot results of the proposed system (first scenario): (a) first scenario (front angle), (b) first scenario (right angle), (c) chair (front angle), and (d) rectangle (front angle).
The second scenario included a wall. Its center was located at X: 0.1 m, Y: 0.33 m, and Z: 1.5 m. Some snapshots of the 3D point clouds from some experiments with second scenario using the 3MS are displayed in Figure 16. Figure 16(a) shows the snapshot from a front angle, and Figure 16(b) shows the snapshot from a right angle. Table 1 shows the accuracy of the 3MS with respect to ground truth. The absolute errors were X: 0.0 m, Y: 0.03 m, and Z: 0.02 m for the rectangular obstacle; X: 0.02 m, Y: 0.01 m, and Z: 0.01 for the chair; and X: 0.01 m, Y: 0.02 m, and Z: 0.01 for the wall.

Snapshot results of the proposed system (second scenario): (a) second scenario (front angle) and (b) second scenario (right angle).
3MS accuracy with respect to ground truth.

3MS: multi-sensors multi-baseline mapping system.
As can be seen in Figure 15 and in Table 1, the proposed 3MS system extracted very clear, noiseless, accurate, and high-quality 3D point clouds of the environment and obstacles. The fusion between multi-baseline stereovision and laser-range data constructs an accurate map of the environment using 3D point clouds.
Comparison
Testing the whole system is more important than just testing each module individually. To the best of our knowledge, most work in the literature lacks such testing. Hence, in this research, we present the accuracy of our complete integrated system in different environments. To show the accuracy and robustness of the proposed 3MS, we do the following:
Compare the proposed 3MS with several systems;
Compare the accuracy of the proposed 3MS system with the work of H-J Yoon et al., 44 and RH Thaher and ZK Hussein. 45 (what work we were able to find in the literature).
3MS comparison
In this section, we will compare the proposed 3MS with three different systems. The first uses a laser-range device (laser system), the second uses a stereovision camera with wide baselines (wide-baseline system), and the third uses a stereovision camera with narrow baselines (narrow-baseline system). We executed all four systems (the proposed 3MS, laser system, wide-baseline system, and narrow-baseline system) in the same environment using the same computer, scenarios, and obstacle configurations. All systems were tested in the same environment with differently sized and shaped obstacles at different distances, the same setup as described above. As illustrated in Table 2, all systems detected the obstacles (except the narrow-baseline system in the second scenario), but in terms of accuracy, angle of vision (both horizontal and vertical), and noiselessness, the proposed 3MS prevails.
Comparison of results between proposed system, laser system, wide-baseline system, and narrow-baseline system.

For the rectangular obstacle of the first scenario, the absolute errors were X: 0.0 m, Y: 0.01 m, and Z: 0.01 m for 3MS; X: 0.07 m and Z: 0.07 m for the laser system; X: 0.07 m, Y: 0.01 m, and Z: 0.02 m for the wide-baseline system; and X: 0.07 m, Y: 0.09 m, and Z: 0.02 m for the narrow-baseline system. Figures 17–19 illustrate the x, y, and z values, respectively, regarding the compared systems detection of the rectangular obstacle.
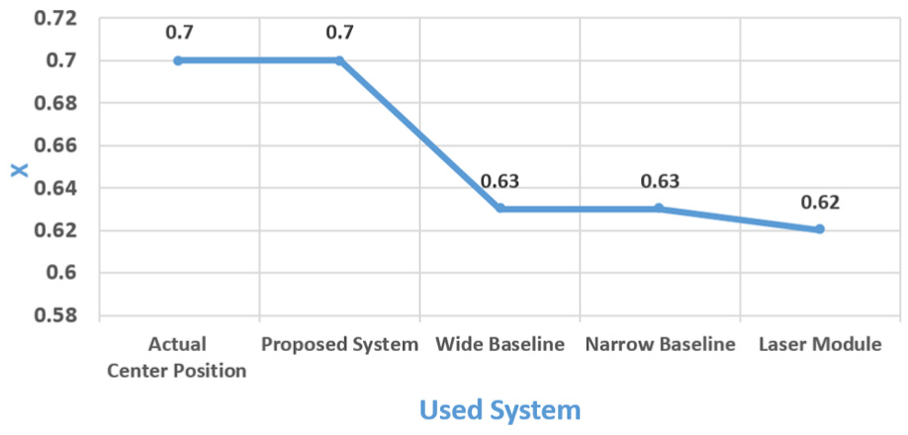
The location of the x-axis of the rectangular obstacle in the first scenario.

The location of the y-axis of the rectangular obstacle in the first scenario.

Location of the z-axis of the rectangular obstacle in the first scenario.
For the chair obstacle in the first scenario, the absolute errors were X: 0.01 m, Y: 0.01 m, and Z: 0.01 for the 3MS; X: 0.05 m and Z: 0.32 for the laser system; X: 0.01 m, Y: 0.07 m, and Z: 0.12 for the wide-baseline system; and X: 0.16 m, Y: 0.03 m, and Z: 0.34 for the narrow-baseline system. Figures 20–22 illustrate the x, y, and z values, respectively, detected for the chair obstacle by the compared systems.
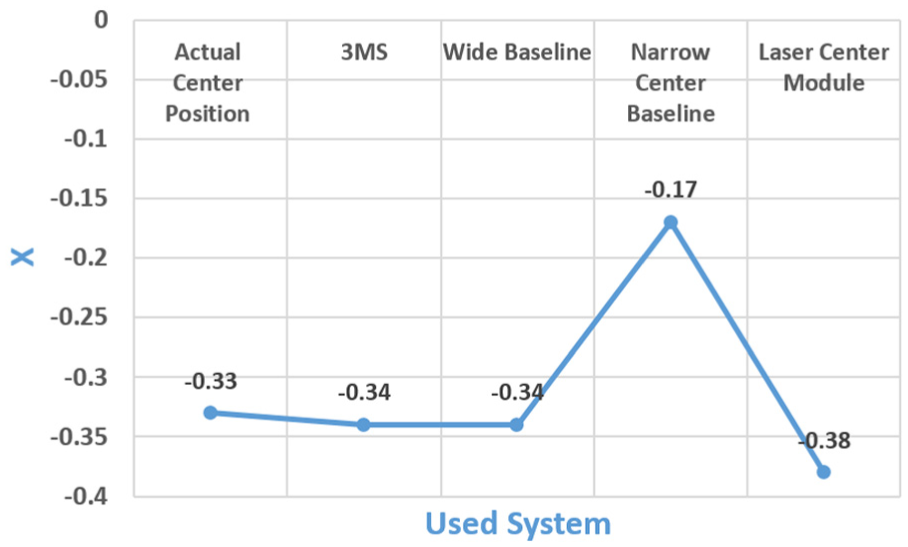
Location of the x-axis of the chair obstacle in the first scenario.
Location of the y-axis of the chair obstacle in the first scenario.

Location of the z-axis of the chair obstacle in the first scenario.
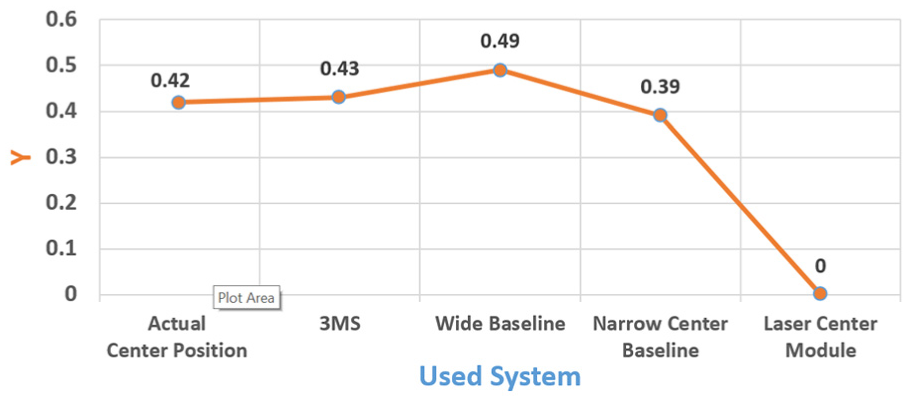
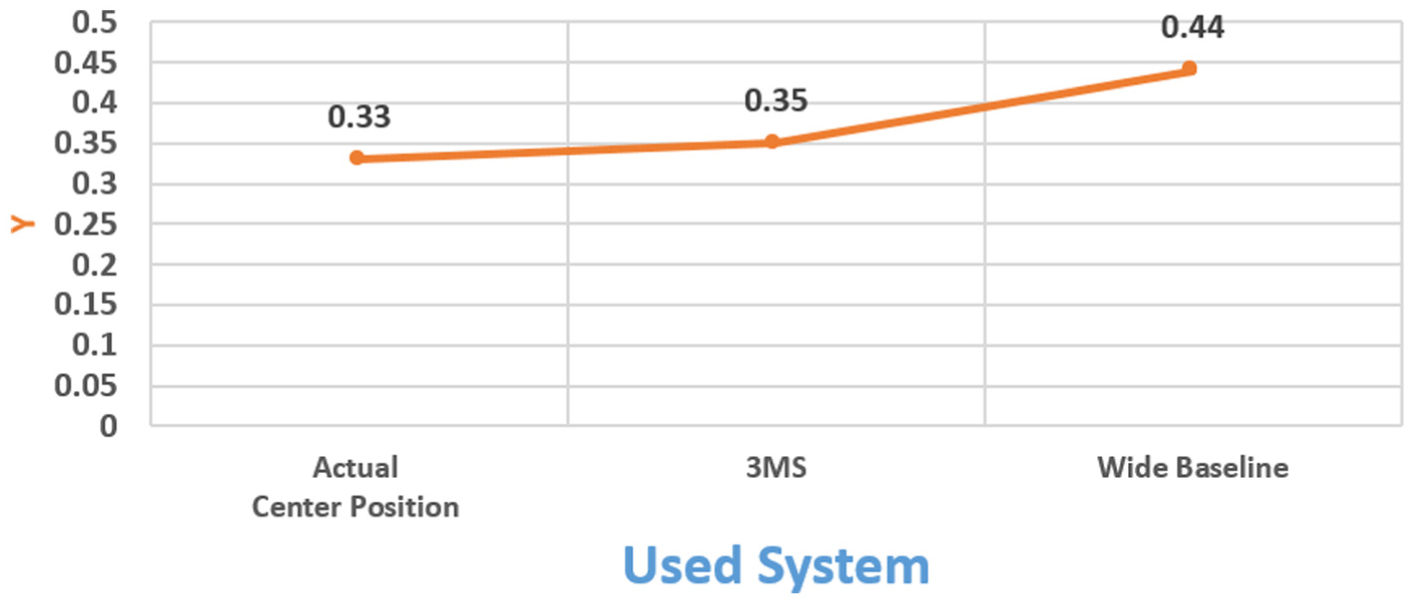
For the wall obstacle in the second scenario, the absolute errors were X: 0.01 m, Y: 0.02 m, and Z: 0.01 for the 3MS; X: 0.02 m and Z: 0.01 m for the laser system; and X: 0.06 m, Y: 0.11 m, and Z: 0.06 m for the wide-baseline system. The narrow-baseline system failed to detect the obstacle. Figures 23–25 illustrate the x, y, and z values, respectively, detected for the wall obstacle by the compared systems.

Location of the x-axis of the wall obstacle in the second scenario.
Location of the y-axis of the wall obstacle in the second scenario.

Location of the z-axis of the wall obstacle in the second scenario.
As we can see in Figures 17–24 and in Table 2–4, compared to the other systems, the proposed 3MS extracted very clear, noiseless, and accurate 3D point clouds of the environment and obstacles with large vision angles (horizontal angle of 180° and vertical angle of 32°). The wide-baseline system follows the 3MS in its accuracy, but with some noise in certain snapshots and with small vision angles (horizontal angle of 66° and vertical angle of 32°). The narrow-baseline system was the worst, failing in the second scenario. The laser system produced somewhat accurate depictions of the environment, but in 2D (horizontal angle of 180° and vertical angle of 1°).
Snapshots resulting from the proposed 3MS, laser system, wide-baseline system, and narrow-baseline system.

Snapshots of obstacles by the proposed 3MS, laser system, wide-baseline system, and narrow-baseline system.
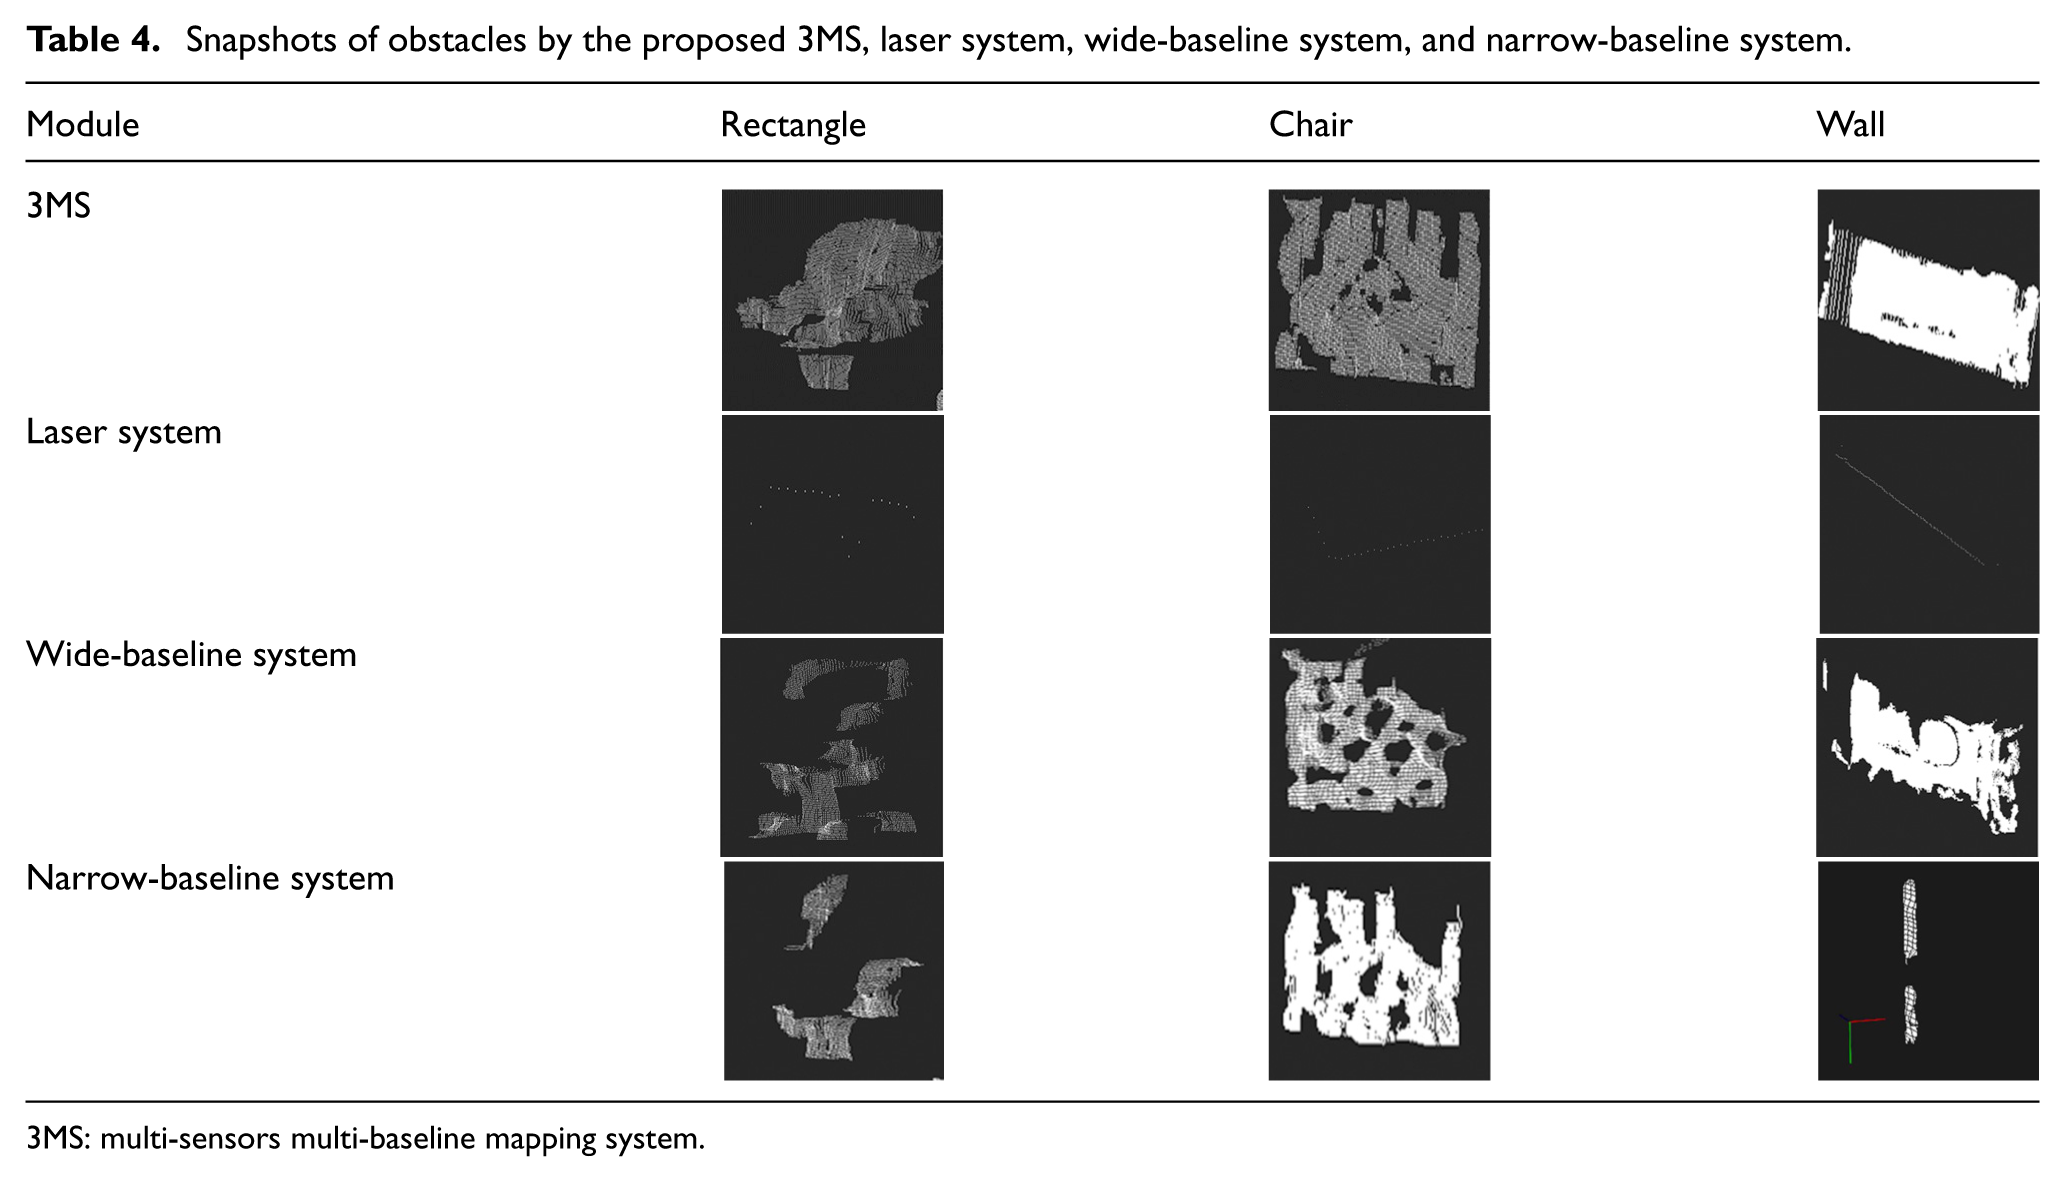
3MS: multi-sensors multi-baseline mapping system.
Comparison with other work
We compared the accuracy of the depth estimation by the proposed 3MS module with the work of H-J Yoon et al., 44 and with that of RH Thaher and ZK Hussein. 45 The results of this comparison are shown in Table 5 and Figure 26, from far 3 m to near 0.5 m. The proposed 3MS module shows better results than the compared systems, 44 with a maximum error of 0.02 m compared to 0.2 m in the other method.
First comparison, accuracy of depth estimation.
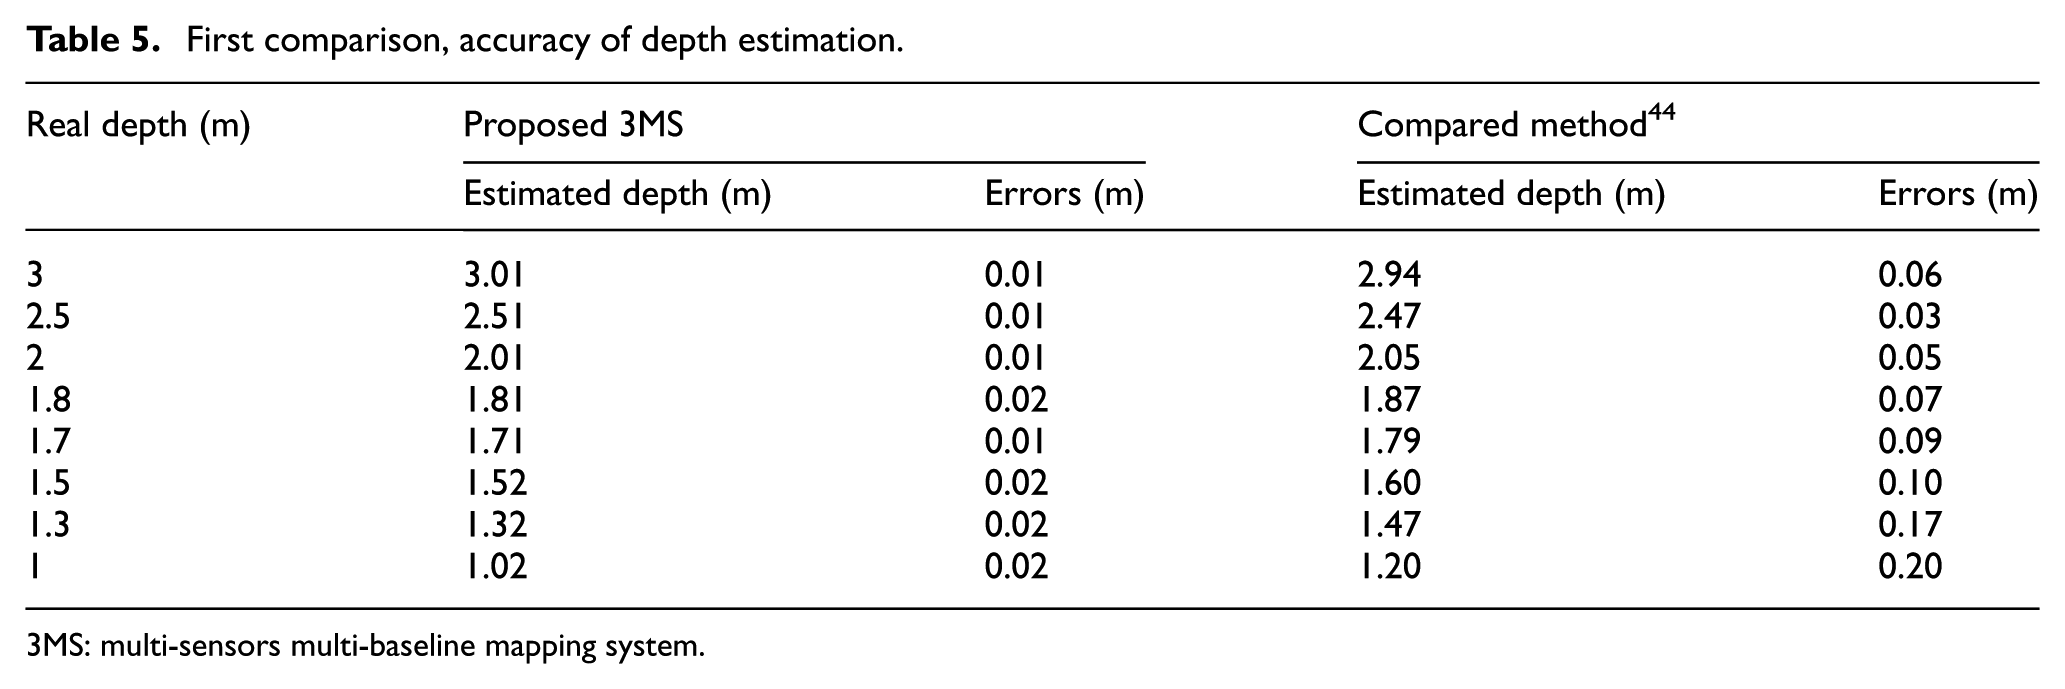
3MS: multi-sensors multi-baseline mapping system.

First comparison, accuracy of depth estimation.
The results of the comparison shown in Table 6 and Figure 27 are from far 313 m to near 121 m. The proposed 3MS module shows better results than the compared method. 45 The maximum error of the proposed 3MS was 2 cm, while the compared method had an error of 10.58 cm.
Second comparison, accuracy of depth estimation.

3MS: multi-sensors multi-baseline mapping system.
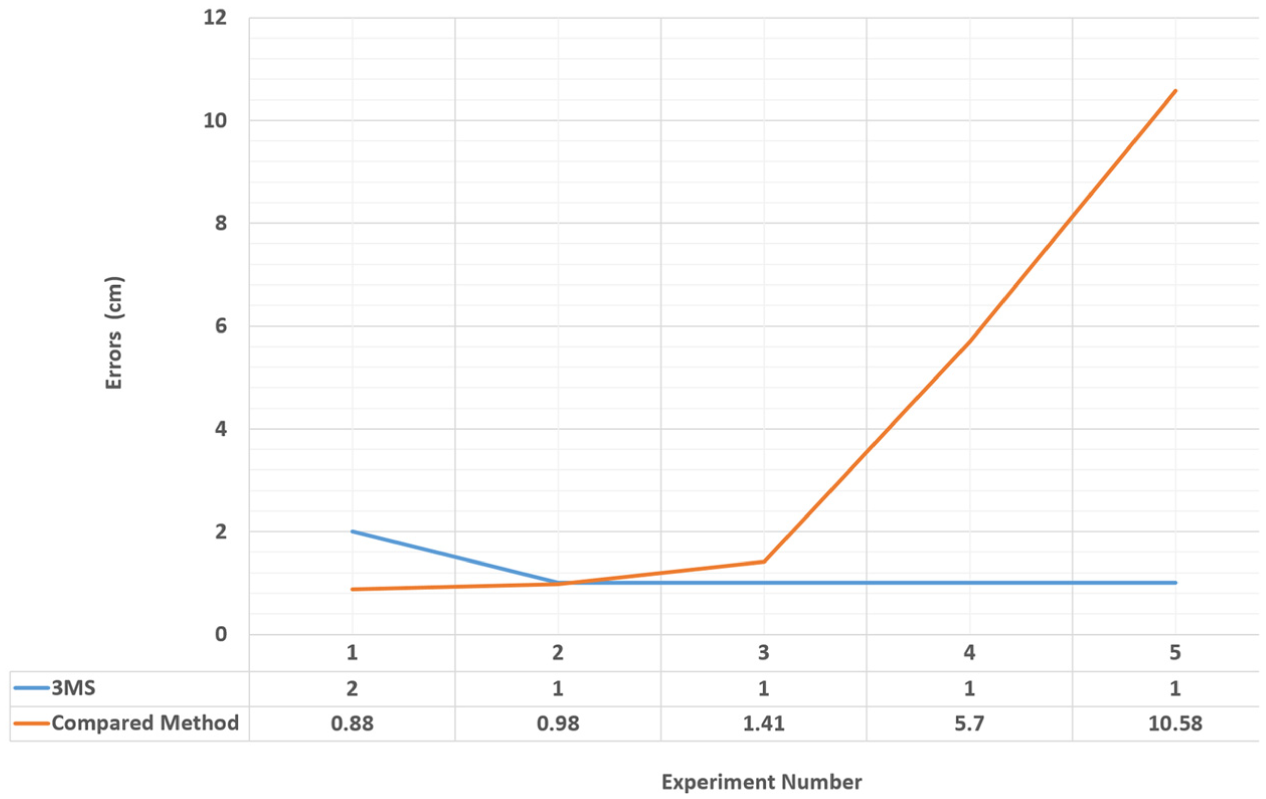
Second comparison, accuracy of depth estimation.
Time execution
In terms of execution time, pruning point clouds in the PPM reduce the computational operations required by the SPM and PM. We executed 3MS 10 times with and without pruning the point clouds. As can be seen in Table 7 and Figure 28, pruning the point clouds in the PPM reduces average execution times from 882.7 to 771.5 ms, 637.8 to 377.2 ms, and 22.3 to 15.8 ms for PPM, SPM, and PM, respectively, along with reducing the total run time from 1.54 to 1.16 s.
Execution time of 3MS.
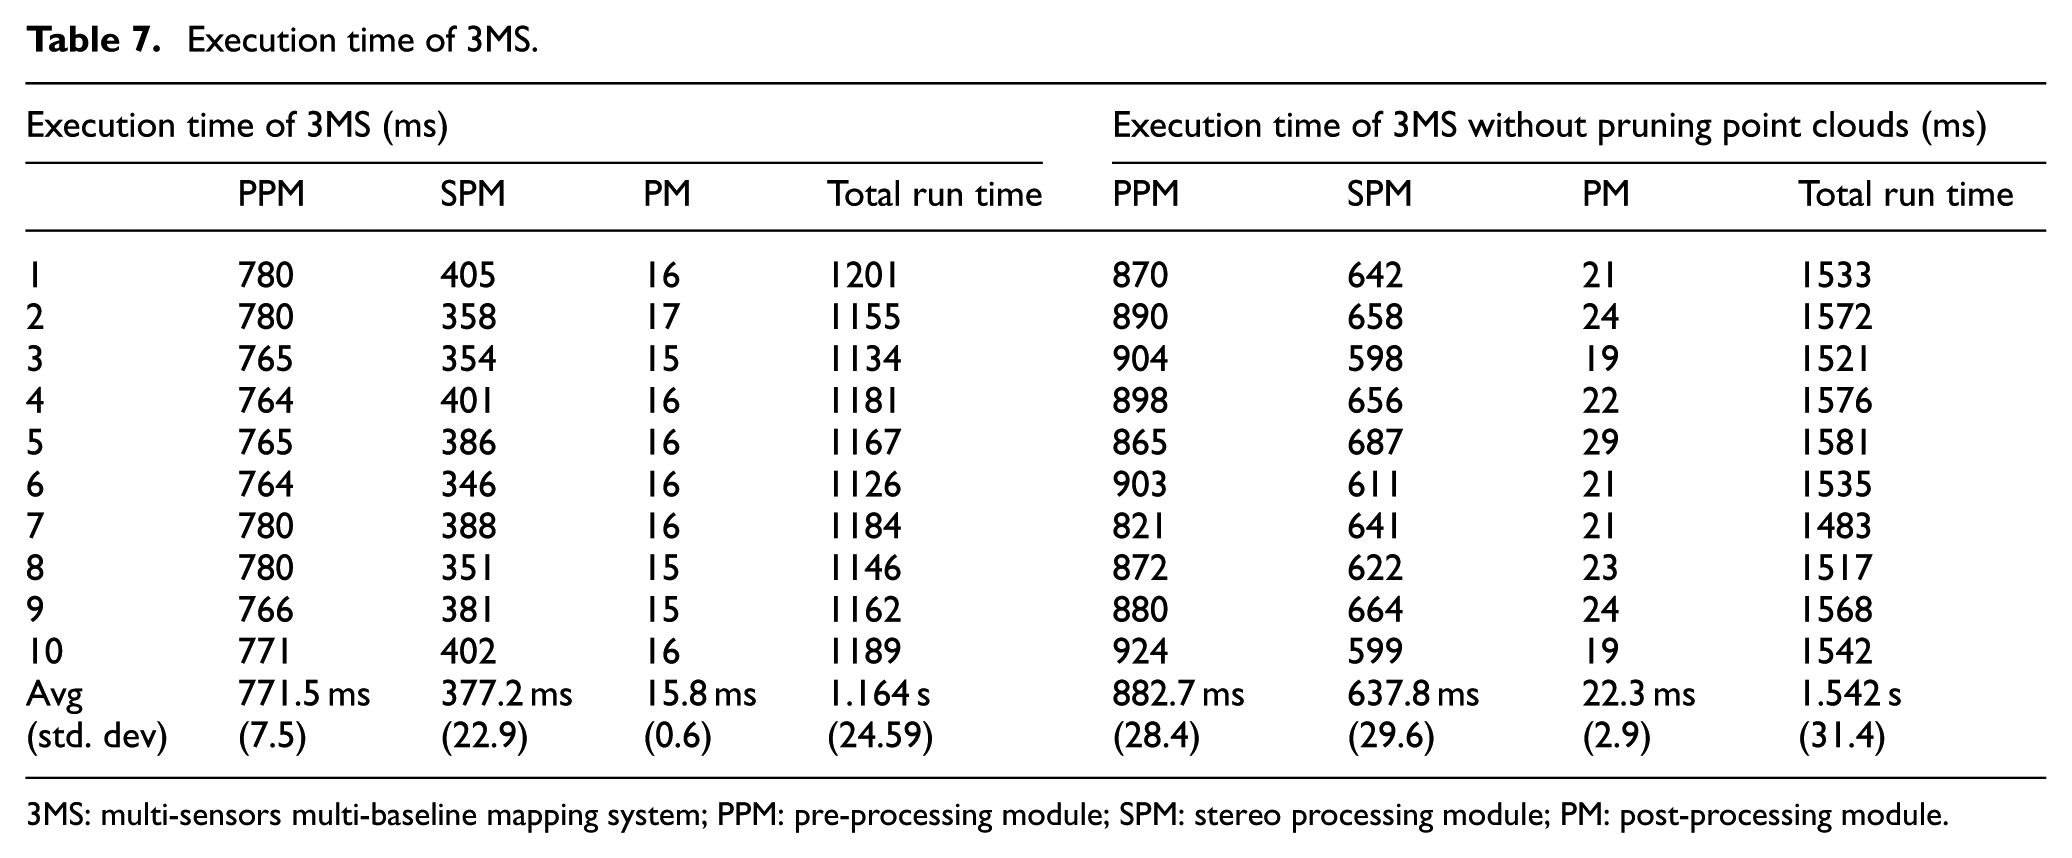
3MS: multi-sensors multi-baseline mapping system; PPM: pre-processing module; SPM: stereo processing module; PM: post-processing module.

Compression of execution time.
Conclusion
In this research, we have enhanced the efficacy of the mapping operation by fusing multi-baseline stereovision with laser-range data. This fusion builds an accurate, real-time mapping. The proposed system is used to build an accurate, real-time map for mobile robots. The proposed system could be used in any kind of mobile-robot application, such as housework, security patrolling, search-and-rescue operations, material handling, manufacturing, or automated transportation systems. A comparison of the proposed system with three other mapping systems (laser system, wide-baseline system, and narrow-baseline system) shows the accuracy and robustness of the proposed system. The proposed system has the following features: (1) 3D vision, (2) noiseless point clouds, (3) accurate point clouds, (4) 180° horizontal angle and 66° vertical angle, and (5) works under different light conditions.
Footnotes
Academic Editor: Anand Thite
Declaration of conflicting interests
The author(s) declared no potential conflicts of interest with respect to the research, authorship, and/or publication of this article.
Funding
The author(s) disclosed receipt of the following financial support for the research, authorship, and/or publication of this article: The authors extend their appreciation to the Deanship of Scientific Research at King Saud University for funding this work through research group no. RG-1437-018.