
Abstract
Reasonable test, diagnosis, and analysis are meaningful for building energy efficiency retrofit and management. Energy consumption and greenhouse gas emission of a large-scale commercial building are described in this article. Basic information about energy consumption equipment is included in the investigation. Further diagnoses about the operational state of air-conditioning water systems, and ducted systems were implemented. Energy consumption decreased 200 kWh/m2 per year from 2007 to 2009 after energy-saving reconstruction in 2006. Next, a carbon audit was carried out; this comprised CO2 emission statistics associated with the energy use and categorization and structural analysis (categorization refers to energy categorization and structural analysis means the composition and its proportion relationship of all kinds of primary energy and secondary energy in energy production or consumption). Greenhouse gas emissions could be less than 150 kg/m2 per year from 2007 to 2009. An analysis of the correlation between CO2 emissions, building gross domestic product, and energy efficiency is also presented. This article makes an analysis on the energy utilization and energy-saving reconstruction of a public commercial building in Shanghai and then makes an analysis of carbon audit about greenhouse gas emissions related to energy utilization (it analyzes the status of building’s energy utilization and greenhouse gas emissions), to have a more comprehensive understanding on the internal relationship between energy consumption and its greenhouse gas emissions and provide researchful reference data for the development with reduction strategies of greenhouse gas emission in future building.
Introduction
The rapid growth in world energy use has raised concerns over supply difficulties, exhaustion of resources, and impact on environment. According to L Perez-Lombard et al., 1 R Ramanathan, 2 it is shown that since 1984, primary energy has grown by 49% and CO2 emissions by 43%, with an average annual increase of 2% and 1.8%, respectively. Current predictions, made by L Belussi and L Danza 3 and Y Lu et al., 4 show that this growth will continue. N Fumo et al., 5 R Saidur, 6 and JE Seem 7 discussed the relationship linking energy consumption with economic development and population growth and attempted to reverse this trend by increasing energy efficiency.
With the development of economies and improvements of people’s quality of life, high energy consumption in large-scale public buildings becomes more noticeable, particularly in China. According to J Yi, 8 the electricity consumption of large-scale public buildings is 70–300 kWh/m2, which is 10–20 times more than that in residential buildings. Therefore, it is defined by General Administration of Quality Supervision 9 that—energy efficiency supervision systems comprising energy consumption statistics, energy audits, energy efficiency public notices, and energy consumption rationing (non-tradable quotas)—price increases for exceeding allocated energy quotas needed to be designed for use in large-scale public buildings. The purpose of such systems is to promote energy conservation operations and eco-friendly retrofits.
Along with economic and technological developments, a series of environmental problems induced by global warming made people more sharply focus on greenhouse gas emissions. Construction is not only a basic industry for socio-economic development but also a large consumer of resources, and also one of the main reasons why greenhouse gas emissions increased.
At present, China is the world’s second largest developing country and the second largest emitter of greenhouse gases. Of global CO2 emissions in 2005, China accounted for 18.9%, second only to America’s 21.1%. In 2013, China became the world’s largest emitter of greenhouse gases accounting for 29%, while America reached 15% and European countries reached 10%. According to Y Liu et al., 10 with the rapid development of her economy, China becoming the world’s largest emitter may be just a matter of time. The need for detailed carbon auditing is therefore pressing.
Research approach and methods
As the first step in the building energy efficiency supervision, the energy consumption statistics of several typical large-scale public buildings in Shanghai were collated. Energy consumption and greenhouse gas emission statistics for a typical commercial building were analyzed as a case study to introduce protocols for energy consumption statistical analysis, their further use in diagnosis, and greenhouse gas emission categorizations.
According to historical records and field investigation data, the energy consumption of the commercial building in 2009 was tested and analyzed: on this basis, further analyses and diagnoses were undertaken. The field investigation included air handling unit, water chiller, cooling power, water pump, air system, and water system running state.
This energy consumption and greenhouse gas emission investigation included basic information about the building, operational records from energy consumption equipment, energy consumption of indoor equipment, energy efficiency assessment of energy consumption systems and equipment, investigation of the behavior of energy-saving measures, and so on. On this basis, further analysis and diagnosis, including assessment of the operating state of air-conditioning water systems, the operating state of ducted air-conditioning systems, and operations management of air-conditioning systems, were implemented. A carbon audit was carried out on carbon dioxide emissions associated with energy use, which is composed of carbon dioxide emission statistics made by the Environmental Protection Department, 11 carbon dioxide emission categorization, and carbon dioxide emission structural analysis.
Energy consumption and greenhouse gas emission statistics for a typical commercial building
Basic information
Building information
The commercial building includes two main buildings and a podium: Phase 1 is a floor area/storey of 260,000 m2 and is a 66-storey commercial building, and Phase 2 is an area/storey of 130,000 m2 and is a 48-storey building with a 3-storey basement, completed in 2001. The podium where the floor area/storey is 50,000 m2 is a five-storey shopping center. The underground stores are used as plant rooms and retail space. Phases 1 and 2 are used as offices, and the podium is used for other commercial activities. Using time of the commercial building is from 08:00 a.m. to 18:00 p.m.
Energy source
Besides gas which is used in some restaurants and heating systems for Phase 2, electricity is the key energy source for this commercial building. The electricity consumption equipment includes a heating, ventilation, and air-conditioning (HVAC) system; lighting system; elevators and escalators; water supply and drainage; and so on.
Systems and equipment
The heat sink in summer was supplied by eight water-cooled centrifugal water chillers in Phase 1 and the podium, and four chillers in the old building. Figure 1 shows the water system for Phase 1. An all-air system was adopted for this commercial building: 93 modular air-conditioning units, 17 ceiling fresh-air handling units, and 1500 fan-coil units were installed. In Phase 1’s building and the podium, 49 electric heaters were installed to provide indoor hot air. In Phase 2’s building, three gas-fired boilers each rated at 5.5 kW were used.

The water system principle diagram of the part 1 building.
The lighting system mainly includes store and emergency lighting. Energy-saving lamps were used in the store lighting system: fluorescent lamps were used in offices.
The elevators includes passenger and cargo lifts. There were 30 passenger lifts, 2 lifts, and 31 automatic escalators each rated at 11 kW in Phase 1’s building: there were 17 passenger lifts and 6 cargo lifts in Phase 2.
Energy consumption
According to energy consumption data from 2005 to 2009, the types of energy consumption are now analyzed.
Electricity consumption
The annual electricity consumption of the commercial building was 229.8 kWh/m2, mainly including the electricity consumption of the HVAC system, lighting system, and power equipments. By analyzing the electricity consumption of per unit building area in the whole year, Figure 2 can be derived.

Per unit building area electricity consumption and carbon dioxide emissions from 2005 to 2009.
The relationship between annual electricity consumption and time is shown in Figure 3: April and December were troughs, while July and August were peaks. Among the electricity consumers in the building, the lighting systems, vertical transportation systems, and other electricity consumers operated for the whole year, while air-conditioning systems operated only from 15 May to 20 September for cooling and from 15 December to 1 March for heating. The outdoor air temperature was usually the highest from July to September, so the electricity consumption of the air-conditioning system was highest in these 3 months accounting for about 69% in total. In winter, the air-conditioners are needed for heating, which caused the electricity consumption to increase a little in winter.
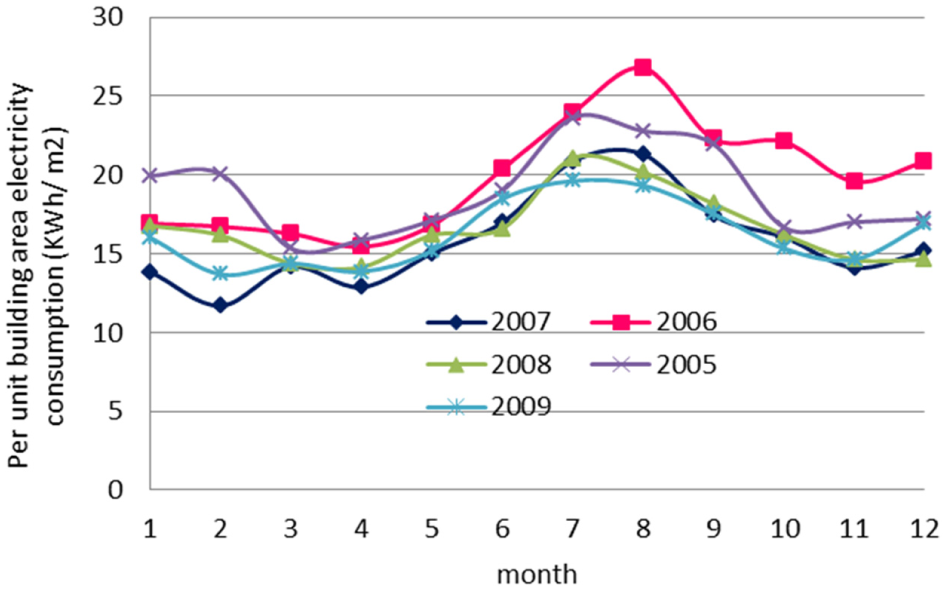
The whole year electricity consumption and time.
In 2006, the building owners commissioned an energy-saving reconstruction of the main refrigeration equipment. So energy consumption decreased from 2007 to 2009, with an energy saving of about 20%. To achieve 20% energy saving, we can take measures like conversing household cooling water pump frequency, modifying lighting system, hot and cold source system, using nature cold resource, adjusting hydraulic balance, and so on. The authors took performance measurements on the reconstructed equipment, especially on the air-conditioning equipment, in 2009. The use/occupancy of the building remained unchanged essentially from 2005 to 2009.
Gas consumption
The coal-gas consumption of average building area in a commercial building per annum was 0.13 kg/m2 in Figure 4. Coal-gas was mainly used in some below-ground restaurants and the heating system in Phase 2’s building. Affected by the heating period, the gas consumption from January to March is significantly higher than that at other time. As February in 2008 was colder than average, gas consumption increased. At other time gas consumption was relatively stable because the passenger flow through the restaurants was relatively stable.

Per unit building area coal-gas consumption in the whole year and time from 2007 to 2008.
Further analysis and diagnosis
The diagnoses of the HVAC system included analyses of the ventilation system, the chilled water system, surge effects in units, and the coefficient of performance (COP) of the units. The heat sink in summer came from 12 water-cooled centrifugal water chillers: per unit building area cooling capacity was 270 W/m2, which could meet the required summer cooling load. In the chilled water system, a unit matched a cold water pump. The unit, rated at 29,730 kW and a flow of 511 m3/h, could match the corresponding pump whose rated flow was 520 m3/h: the unit of 1675 kW whose rated flow was 288 m3/h could match the corresponding pumps whose rated flows were 290 m3/h. So, the chillers and chilled water pumps of the HVAC system could meet the requirements optimally.
Air system
Phase 1’s building adopted an all-air system which included 17 air handling units covering all 66 above ground storeys. Four air-conditioning units on the seventh floor were chosen for testing. The measurements included the pressure of the mixing section in front of the filter, the pressure of the air supply section behind the surface air cooler, and the volume of supply, return, and replacement air in Figure 5. According to the test data, the pressure difference of the pre- and post-filter section, surface air cooling section, and the difference between actual air supply volume and design air volume of the units were calculated.

Test content and test point arrangement of air-conditioning units.
The fan pressure head of this system was much higher than other normal comfort air-conditioning systems. Running on high pressure head can cause not only increased energy consumption but also a decreased air flow. The air flow of the units was decreased incrementally. In the case where actual air supply volumes were much less than design air volumes, the indoor air temperature can still meet design requirements: the fan volume selected is simply too large. The high resistance of ducts and air-conditioning units also causes decreased fan flow and an increase in the units’ pressure head. In addition, the return air is the indoor air which is sucked into the air-conditioning machine room through the return air duct. The air-conditioning machine room is used as the return air chamber. Every air-conditioning unit draws on the air in the machine room by opening the return air damper, and then the air is sent into the main air supply duct after filtration and cooling, and finally delivered into the room. Because the negative pressure of the air-conditioning unit’s return air damper is only 4–9 Pa, the volume of returned air is insufficient as is the associated air supply.
Water chiller
An ultrasonic flow meter was installed in the inlet pipe of the water chiller. The chiller water flow and the temperature of the inlet and outlet of both the chiller water and the cooling water were displayed on the unit and were recorded when the flow is stable. The motor current and voltage were measured to calculate the chiller power as seen in Figure 6.
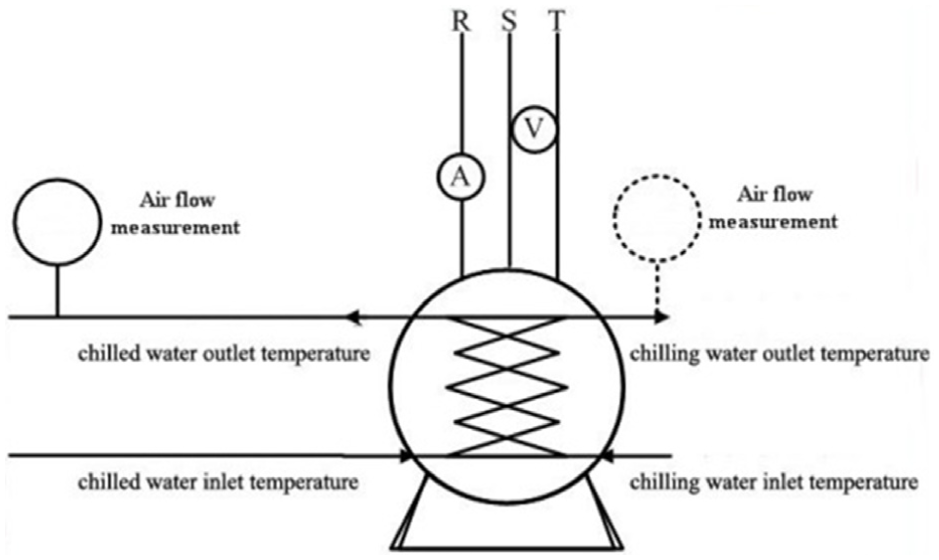
Test content and test point arrangement of water chiller.
In this article, COP means cooling capacity/compressor capacity. It was found that the measured COP is greater than 3.0, but less than the rated COP of the unit from analysis of the measured date. The average COP of these four units is 3.65 which is 23.6% lower than the average value (4.78) of the unit rating COP. The maximum temperature difference between the measured chiller water inlet and outlet is 5.1°C and the minimum is 4°C, which is only a small deviation from the rated water temperature difference 5°C which showed that the unit was running well.
It can be seen that the unit was under-load running as its measured COP is lower than the rated COP of the main unit. The temperature of outdoor environment at measurement days was always less than 30°C, lower than 34°C, the temperature of outdoor environment of air-conditioning design in the area of Shanghai, so the air-conditioning system under the condition of under-load and the cooling capacity of measured has not reached the ratings.
If the main unit retrofitting inverter regulates the main unit frequency through either the external or the internal temperature, then the power of the under-load running unit would decrease and energy could be saved while the rated COP could be maintained.
Cooling tower
First, the cooling tower should be measured at a stable condition for every 15 min for a synchronous measurement generally. The flow and water temperatures both entering and leaving the cooling tower, which can be used to calculate the water cooling capacity, can be measured, respectively, by ultrasonic flow meter and thermometer installed on the inlet and outlet pipes of the cooling tower. Thermometer and psychrometer should be installed where the air goes both into and out of the cooling tower to measure the salient air parameters. To calculate the flow of air into the tower, a hot-wire anemometer can be used to measure the wind speed of a number of points in the tower. The motor current and voltage were also measured to allow calculation of the motor power. Outdoor parameter measuring instruments should be placed in the vicinity of the cooling tower (see Figure 7). From the analysis of measured data, we can see that the measured temperature differences of import and export water of new and old cooling towers are 4°C and 5.5°C, which are deviated from the rated temperature difference 6.2°C. The differences between the actual water flow and the rated water flow were 25% and 60%, and the actual cooling capacities were 91.49% and 87.79%, respectively, which lay suitably close to the desired value of 95%.
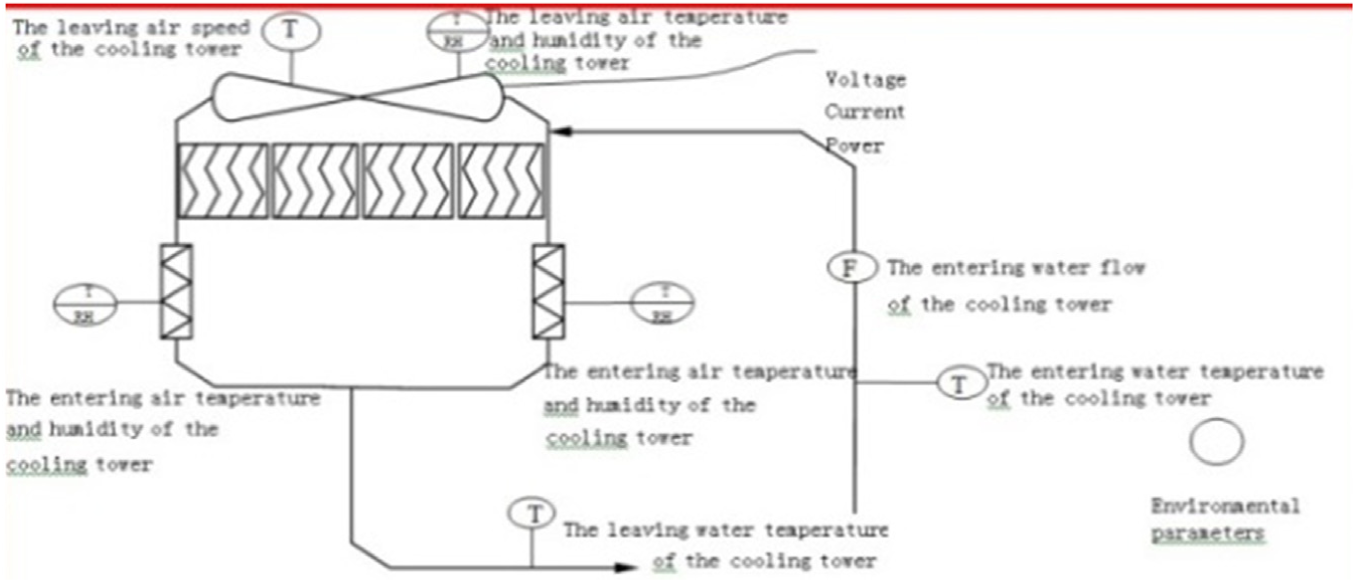
Test content and test point arrangement of cooling tower.
Lighting system
The commercial building, which is installed with a more sophisticated lighting system, was put into operation in 2001 to save energy. Energy-saving lighting equipment included high-voltage mercury lamps (mall unloading area), parabolic aluminized reflector (PAR) lights (mall public aisle, Phase 1’s office building lobbies and toilet, Phase 2’s office building lobby, and so on), metal halide lamps (building roof-level, T5 inductance ballast fluorescent lamps (the first office building basement, the common layer/fire-aisle, bathroom, the basement of building 2, the elevator hall of standard floors, and common layer public walkways)), and incandescent lights (35 kV power distribution sub-station room).
Carbon dioxide categorization in energy use
Correlation between carbon dioxide emissions and building gross domestic product and energy efficiency
Correlation between carbon dioxide emissions and building gross domestic product
The carbon content of the energy consumed governs the associated carbon dioxide emissions; the energy supply structure determines the energy’s carbon content. The data of building gross domestic product (GDP) and the consumption of various types of energy and GDP are provided by the commercial building.
Carbon dioxide emissions correlate with the level of economic development; the relationship between carbon dioxide emissions and building GDP as a proxy for economic development can be seen in Figure 8(a). With the rapid growth of building GDP from 2005 to 2008, carbon dioxide emissions increased at a faster rate. Through the help of say MATHEMATICA®, the relationship between CO2 emissions and building GDP is as follows

where y is the carbon dioxide emissions and x the building GDP. The relationship between carbon dioxide emissions and building GDP showed that economic development is the driving force of the growth in carbon dioxide emissions. Rapid economic development will inevitably lead to a significant increase in carbon dioxide emissions.
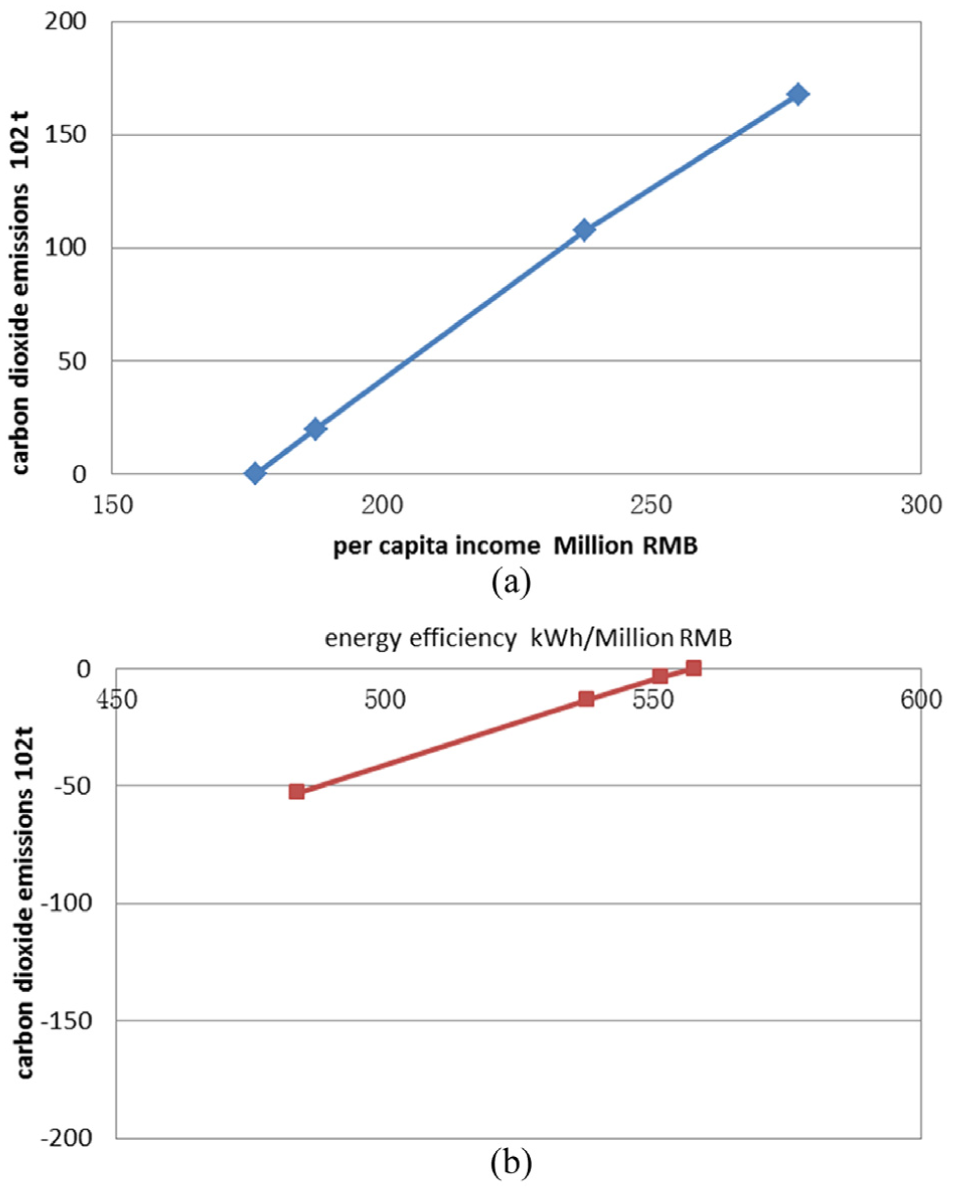
(a) Correlation analysis of building GDP, energy efficiency and its carbon dioxide emissions. (b) Correlation analysis of building GDP, energy efficiency and its carbon dioxide emissions
Correlation analysis of energy efficiency and its carbon dioxide emissions
According to Y Guo, 12 building energy efficiency is the consumption of various types of energy relative to the production value of the unit (GDP)

where E represents the various types of total energy consumption and Y represents the gross annual gross domestic product; Y remains constant, the lower the energy efficiency I for the same GDP, the lower the total energy consumption, the higher the output value of the unit of energy consumption. The relationship between carbon dioxide emissions and building GDP was one of positive growth, energy efficiency, and building annual gross domestic product in buildings, which were inversely proportional to each other with a decrease in carbon dioxide emissions and energy efficiency going together. With energy efficiency increasing, carbon dioxide emissions also decreased, with a faster rate in Figure 8(b). Through the help of say MATHEMATICA, the carbon dioxide emissions and building GDP were related, thus

where y is the carbon dioxide emissions and x is the energy efficiency. Emissions can be reduced by improving energy efficiency.
Categorization of carbon dioxide emissions in energy use
According to Ang and Zhang, 13 Yungong Guo dean’s base number index decomposition method showed that carbon emissions are broken down into the form of a sum of products of all factors needed for a complete analysis. The basic equation of carbon dioxide decomposition is

T is the number of years after the base year, the change of energy carbon dioxide emissions can be expressed by

where C is carbon dioxide emissions; Ci is the ith type of energy as carbon (CO2) emissions; E is the energy consumption; Ei is the no. i type of energy consumption; S is energy consumption structure, S = Ei/E; Y is the GDP; P is the population and R is per capita GDP, R = Y/P; F is carbon dioxide emissions intensity of different types of energy, F = Ci/Ei; Ci, Cs, CR, and CF are the contribution of each change to the overall carbon emissions, respectively;
Using a logarithmic mean Andy’s method to decompose equation (5) gives

Analysis of structure of changes in CO2 emissions
As shown in Figure 2, emissions of CO2 associated with energy consumption generally increased from 2005 to 2009. The increase in CO2 emissions was particularly fast from 2005 to 2006. The rate of CO2 emissions increased because average incomes grew, which is faster than the growth of energy efficiency and the implementation of energy-efficient structural measures. The increment in 2007 was 5.85 times of that in 2006.
After 2007, although the overall energy consumption of building 2 increased during normal operations, the declining margin was resulted from energy efficiency, and structural changes in energy were increased because the relevant energy-saving work took place. The increasing margin produced by average incomes can be offset so that the increasing CO2 emissions in 2008 increased less rapidly, which was 1.19 times of that in 2007.
The changing emissions and the effect of various factors are shown in Figure 9, taking 2007 as the base year. Average income was the main reason for the increase in energy consumption and CO2 emissions. On the other hand, the improvement of energy efficiency was a key factor behind the decline of energy consumption and CO2 emissions which can offset the influence caused by average income changes. Moreover, a change of energy structure exerted little influence on the decrease in CO2 emissions.
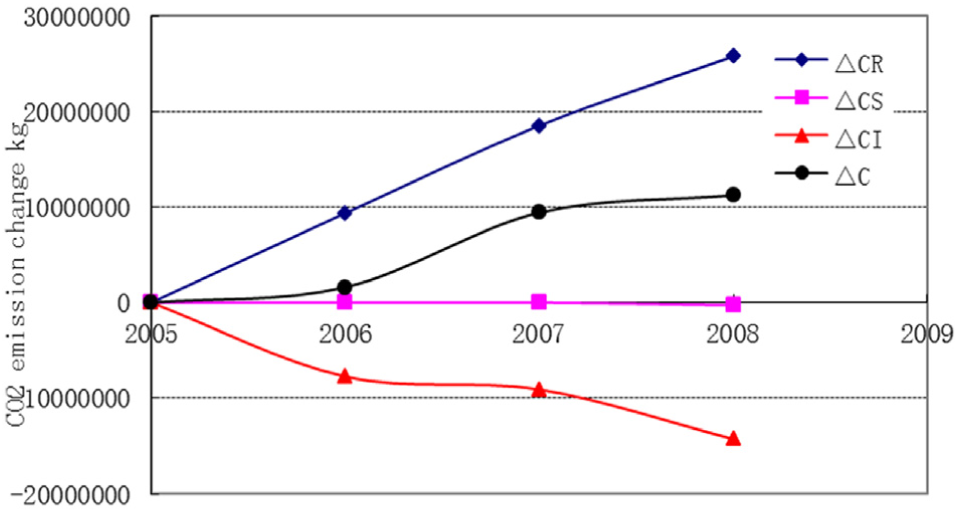
Changing process of emission of energy consumption CO2 and the effect of various factors.
Figure 10 shows the relationship between the growth of carbon dioxide emissions set against building GDP and its shrinkage, which is relative to energy efficiency. The negative rate can be offset by the role of the building GDP to some extent. The offset by ΔCI was weak before the 2007 energy-saving measures were implemented. After this transformation, the negative rate of change significantly accelerated, and ΔCR was still increasing. However, given the considerations of current high cost of energy consumption, the situation has been improved.
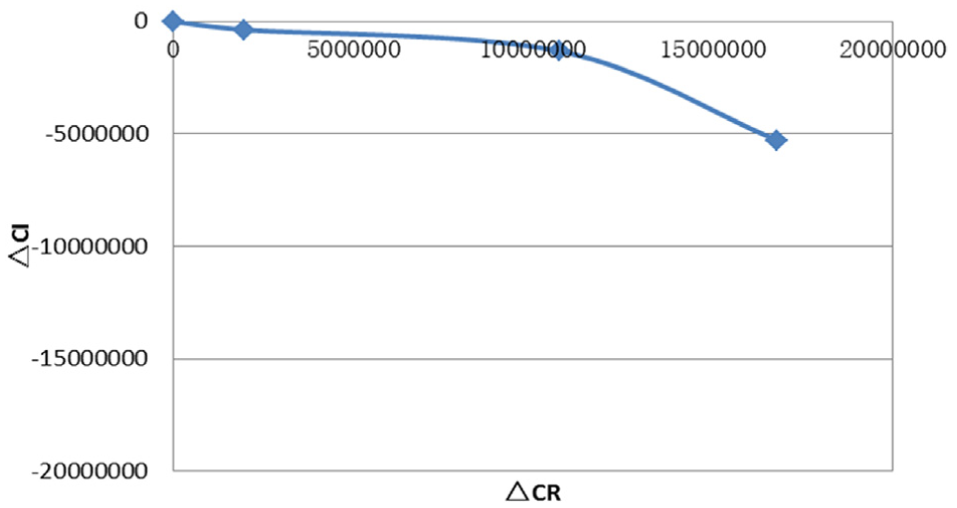
Relationship between ΔCI and ΔCR.
Through this analysis on energy-saving renovation and carbon emission reduction in public buildings, the enhancement of energy use efficiency can significantly slow the growth rate of carbon dioxide emission. There is a big gap between the developed countries and us on the current energy use efficiency, so there is still a large space to improve it. And in the field of the enhancement of energy use efficiency and energy saving, some techniques can be improved in order to form a stable energy-saving level, such as the use of waste heat and pressure, building energy conservation, green lighting, and so on.
Conclusion
Diagnosis and analysis of building energy consumption and CO2 emissions, as the first step in any building energy-saving project, are keys to improving the management of building energy use.
The carbon content of energy governs carbon dioxide emissions: the energy supply structure, in turn, determines the carbon content. After the building’s transformation, the negative rate of change of significantly accelerated, and CR kept increasing. However, despite high energy consumption cost considerations the current situation had improved.
After the analysis above, although the adjustments of energy structure make less contributions to carbon dioxide, the growth rate of carbon dioxide emission will be eased to a certain extent if the use level of new energy such as gas and wind energy sources can be improved.
It is impossible to build a conservation-minded construction and reduce greenhouse gas emission without active participation of the general staff. In fact, employees can make great contributions to emission reduction in daily work and life, for example, they can set the temperature of air-conditioners a little higher (26°C), replace common lights with energy-saving products, put out engines of cars, and turn off lights conveniently. All these can achieve emission reduction. Therefore, we should improve employees’ awareness and let them join emission reduction work.
To achieve further energy saving, we can take measures to add frequency conversion device, reform water balance system, replace electric heaters with gas boilers, replace screw chillers with centrifugal chillers, or use energy-saving lamps.
Footnotes
Academic Editor: Oronzio Manca
Declaration of Conflicting Interests
The author(s) declared no potential conflicts of interest with respect to the research, authorship, and/or publication of this article.
Funding
The author(s) disclosed receipt of the following financial support for the research, authorship, and/or publication of this article: This work is supported by the National Natural Science Foundation of China (Grant No. 51108263 and No. 51278302) and the Hujiang Foundation of China (D14003).