
Abstract
Medium-consistency technology is known as the process with high efficiency and low pollution. The gas distribution was simulated in the medium-consistency pump with different degas hole positions. Rheological behaviors of pulp suspension were obtained by experimental test. A modified Herschel–Bulkley model and the Eulerian gas–liquid two-phase flow model were utilized to approximately represent the behaviors of the medium-consistency pulp suspension. The results show that when the relative position is 0.53, the gas volume ratio is less than 0.1% at the pump outlet and 9.8% at the vacuum inlet, and the pump head is at the maximum. Because of the different numbers of the impeller blades and turbulence blades and the asymmetric volute structure, the gas is distributed unevenly in the impeller. In addition, the pump performance was tested in experiment and the results are used to validate computational fluid dynamics outcomes.
Introduction
The papermaking industry is closely related to our daily life. With the development of society, the demand for paper has been increasing, while the issues of the environmental protection and energy saving were conflict with the increasing productivity of papermaking. Medium-consistency (MC) technology was first developed in Northern Europe in 1970s.1,2 Then, it was widely used to pump, stock, beat, bleach, and filter pulp suspensions at medium concentration with its advantages of high energy efficiency and low environmental effects. MC pump is an important piece of equipment in the MC pumping process. The pulp suspension is usually a water–air–fiber multiphase and non-Newtonian fluid.3,4 A large amount of gas comes in from the pump inlet and must be degassed out of pump. Otherwise, it will lock the flow channels, deteriorate the MC pump performance, and even destroy the pump. 5 To avoid the potential risk, a special impeller has to be designed since the gas degassing is mainly required in the impeller.
In this work, the rheology behavior of pulp suspension is studied by experimental test. The impeller of a MC pump with different degas holes is designed. The gas distribution in impeller, head and degas performance of MC pump are predicted numerically by solving three-dimensional Reynolds-averaged Navier–Stokes equations at the design flow rate as well as the overload and part load conditions. Non-Newtonian fluid and Eulerian two-phase model were utilized to study the gas separation and degas processes. The pump performance was tested in experiment and the results are used to validate simulation outcomes.
Structure of MC pump
As reported in the literature, there are several different structures of MC pump.6–8Figure 1 shows a general structure of MC pump with turbulence generator, semi-impeller, and volute. For fluidizing the pulp suspensions, the turbulence generator with four twisted blades is installed on the semi-open impeller. The fluidized pulp suspension flows through the turbulence generator and is encountered with the impeller. The large amount of gas in pulp suspension can only be degassed by the centrifugal impeller. The volute generally collects pulp suspension and guides it to the discharge. The duty point and main parameters of the MC pump are listed in Table 1.

Structure of medium-consistency pump.
Parameters of MC pump.

Geometric description of impeller with degas hole
The gas mixed in pulp must be expelled through the degas holes on impeller while these holes can significantly influence the MC pump performance. Figure 2 shows a schematic structure of a 1/8 impeller with a single blade and a degas hole. Impeller radius is R, degas hole diameter is d, and radial position of the hole is r. The rotation direction is anti-clock.
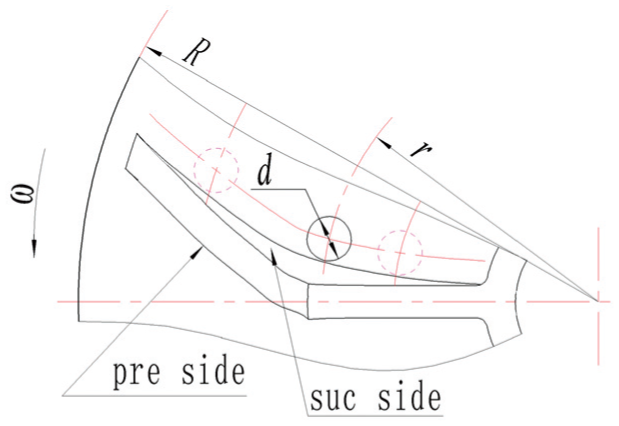
A schematic view of impeller with different hole.
In MC pump, the degas hole either close or far from the impeller inlet can cause incomplete exhaust of pulp, and the design method of MC pump impeller can be referred to Tan et al.9,10 Therefore, the hole position should be optimized along the radial direction and a position ratio, rp, is defined as follows

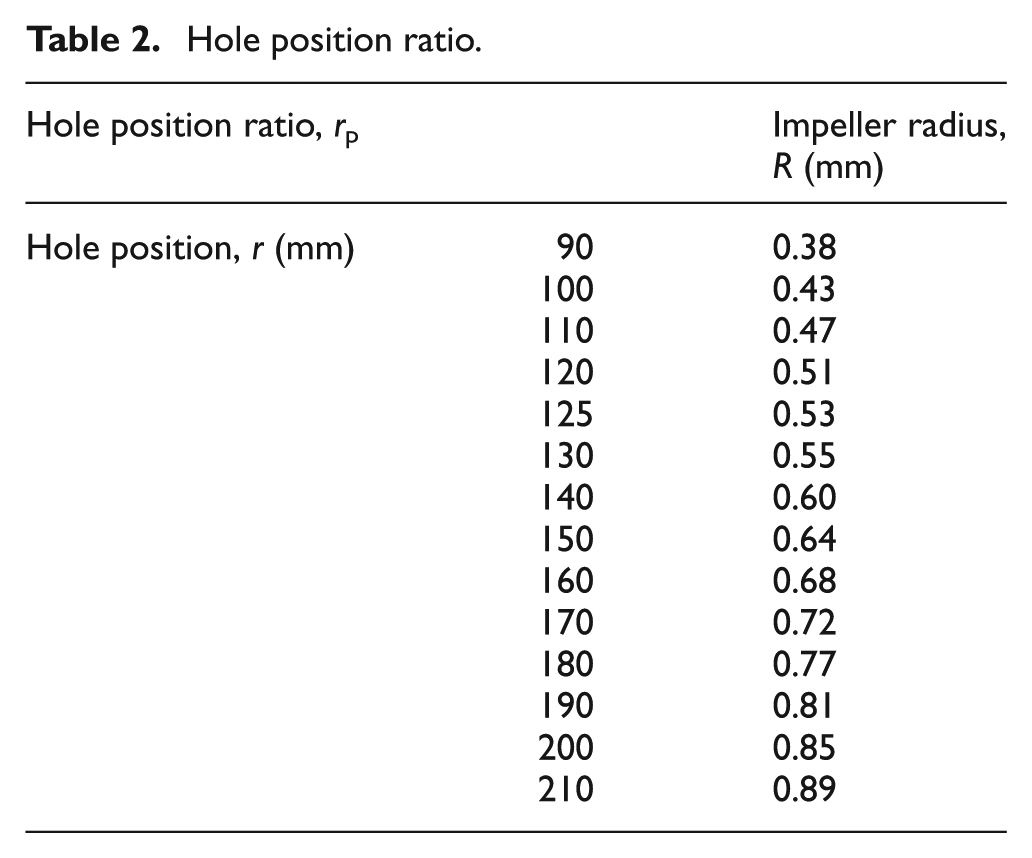
The degassing performance was simulated for different position ratios that are listed in Table 2.
Hole position ratio.
Numerical model and computational method
The choice of two-phase flow model is highly depending on the flow regime. Unfortunately, there is lack of a universal model that can deal with all two-phase regimes simultaneously. Currently, two approaches for multiphase flows exist: the Euler–Lagrange approach and the Euler-Euler approach. In the Euler–Lagrange approach, the main phase is treated as a continuum by solving the time average Navier–Stokes equations and the dispersed phase is solved by tracking a large number of particles through the main phase. In the Euler-Euler approach, the different phases are treated mathematically as interpenetrating continua. The concept of volume fraction occupied by each phase is introduced. The volume fractions of the different phases are assumed to be continuous functions of space and time and their sum is equal to one. The computational fluid dynamics (CFD) codes usually include different Euler-Euler multiphase models: the volume of fluid (VOF) model, the mixture model, the Eulerian model, and so on.
Previous simulations11–13 have already shown that the VOF model is able to simulate the gas separation in multiphase flow pump. Therefore, the VOF model was selected for these simulations. CFD simulations were performed with Ansys Fluent 6.3. The turbulence model is the Renormalization-group (RNG) k-ε model, which considers the corrections for swirling dominated flow. The boundary conditions are as follows:
A no-slip wall condition is set at all boundaries.
Inlet pulp flow rate is 561 m3/h, and the pulp density is 1076 kg/m3 and viscosity is 10.93 Pa s.
Inlet air flow rate is 4321 l/h.
Inlet air volume fraction is 0.1.
An opening and pressure conditions are set at outlet of pump.
Degas pressure is 0.5 atm.
Rotational speed is 1980 r/min.
The simulation began with steady-state single-phase calculations (the pulp without air). When the convergence was reached, the Eulerian model was activated and an unsteady formulation was used. The calculation was continued until the monitored values, gas fraction at outlet of pump and head, were stabilized. The computational domain in MC pump was discretized with unstructured tetrahedral meshes as shown in Figure 3.

Unstructured tetrahedral mesh.
Mesh independence was checked by demonstrating that the chosen mesh did not change the head by more than 5%, compared with the head calculated with a refined mesh, and the number of the used mesh contains 1.9 million volumes. The number of volumes in each component of the MC pump within three different refined meshes and the corresponding predicted head values are presented in Table 3. It demonstrates that the difference in head was 5.79% for coarse mesh and just 0.68% for the medium grid.
Grid independency.

Experimental rig
A modified Herschel–Bulkley(H-B) model14–17 was used to simulate the rheological behaviors of the MC pulp suspension. The pulp suspension acts like an extremely viscous fluid at τ ≤ τy while the rheology behavior appears and is described by a power law model, namely H-B model, at τ > τy
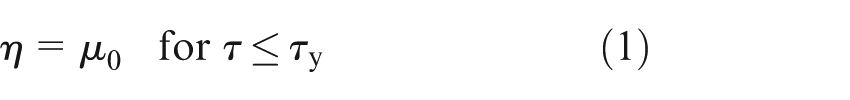
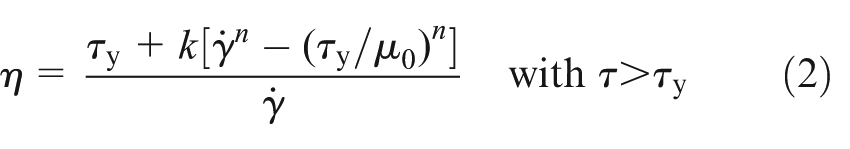
where µ0 is the yielding viscosity, τy is the yielding stress, k is the consistency index,
Figure 4 shows the experimental rig. A cylindrical tank, with a diameter of D = 440 mm, outside diameter of D1 = 460 mm, impeller height of h = 160 mm, impeller diameter of d = 150 mm, and the impeller-tank wall clearance of c = 145 mm, was designed for pumping pulp suspension.

Schematic diagram of experimental rig.
Metzner and Otto 18 proposed a correlation for the mechanical property of non-Newtonian fluids
where Ks is constant value which is depended on impeller type, and N is the impeller speed. In this work, the correlation proposed by Ayazi Shamlou 19 and validated by Shekhar and Jayanti 20 was applied to estimate Ks

where c is the wall clearance impeller-tank and D is the tank diameter.
The rheological parameters of pulp suspension (Cm = 11%) were as follows: τy = 867 Pa, k = 189, and n = 0.087. In total, 35 samples were investigated, and the standard errors and deviations of H-B model are shown in Table 4. The deviations are 2.58%, 4.08%, and 3.45%.
Effect of error.

Results and discussions
Figure 5 shows the gas volume fraction at impeller. Different gas distributions were observed. It is found that the gas mainly accumulated at the inlet of impeller and vacuum, and it is unevenly distributed. A small amount of gas is presented near the tongue, although the major gas is far away from it.

Gas volume fraction at rotational speed N = 1980 r/min: (a) front of impeller and (b) back of impeller.
Figure 6 shows the gas volume ratio and the first deviation of gas volume ratio at the pump outlet with different position ratios at different speeds, as shown in Table 1. In Figure 6(a), with the increasing hole position r/R, the gas volume ratio Cvp first reduces before r/R = 0.53, then increases until r/R = 0.98. For instances, at r/R = 0.38, the gas volume ratio Cvp is about 1%, and Cvp becomes less than 0.1% at r/R = 0.53. At r/R = 0.9, Cvp reaches 9%, which is almost equal to Cvp at pump inlet (10%). It is also found that the Cvp increases with the increase in rotation speed.

(a) Gas volume ratio at pump outlet in different position ratios at different speeds and (b) the first deviation of gas volume ratio.
As shown in Figure 6(b), more details about gas content were obtained by the first deviation of gas volume ratio. When r/R < 0.53,
Gas volume ratio and the first deviation of gas content at the vacuum inlet with different degas hole position ratios at different speeds are shown in Figure 7. The gas content vacuum inlet Cvap increases with r/R increasing before r/R = 0.53, and then it reduces. The maximum of Cvap is 9.8% at r/R = 0.53. With rotation speed increasing, Cvap decreases at r/R > 0.53. It is found that the first deviation of gas volume ratio

(a) Gas volume ratio at vacuum inlet with different degas hole position ratios at different speeds and (b) the first deviation of gas volume ratio.
The head variations of the MC pump with different hole positions at different rotation speeds are shown in Figure 8. The head increases with the increasing rotation speed. With respect to the increasing r/R, the head first increases and then reduces after the maximum head transition at r/R = 0.53, which reveals that the best hole position is r/R = 0.53 and the gas in impeller is very low. The head declined rapidly with r/R decreasing from 0.55 to 0.77.
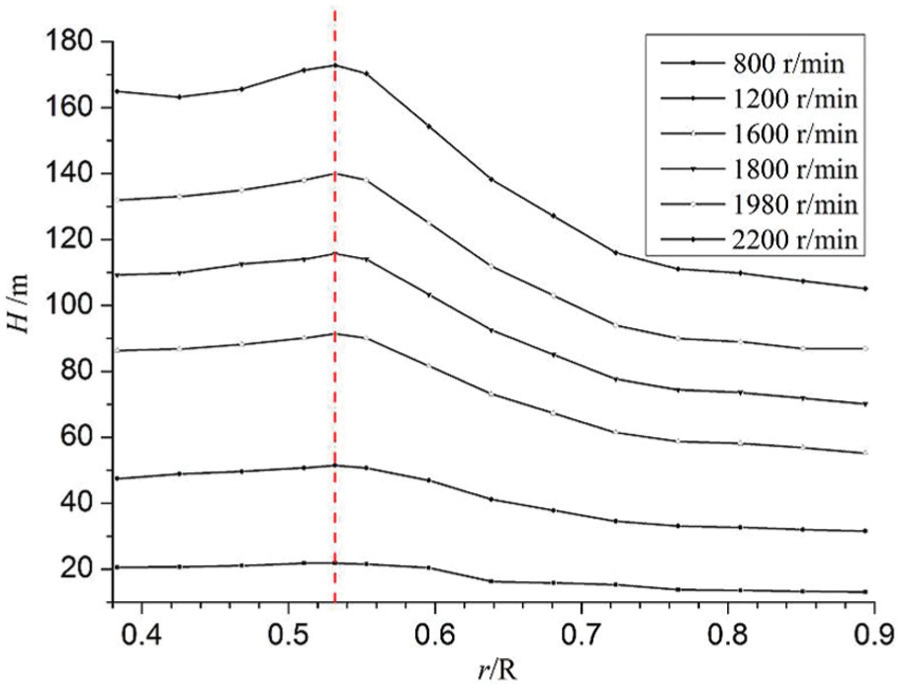
Head variation in different rotation speeds.
Figure 9 shows the expansion passages of the impeller. Fluid flows from the leading edge (LE) to the trailing edge (TE), and the rotation direction is anti-clock, as illustrated by the arrow in Figure 9. The r1 is the section line. The impeller is divided into eight parts by the blades with a 45° interval each other. Figure 10 shows the gas distribution of internal impeller along the impeller at Q = 561 m3/h. When the r1/R changes from 0.47 to 0.60, the gas distribution Cv reduces. It is found that Cv can reach to 62% at r1/R ≤ 0.47 and diminishes lower than 0.05% at r1/R ≥ 0.60. There is an interesting phenomenon of Cv when r1/R is changing from 0.51 to 0.55, and what can explain is that the presence of volute tongue structure can affect the gas distribution on the impeller with respect to the azimuthal angle, φ, from 45° to 270°. In the dash-boxes, Cv is larger at 180° than at 135° and 225°, because of the different numbers of blades on the impeller and turbulence generator.

Expansion passage of impeller.

Gas distribution of internal impeller along the Q = 561 m3/h impeller.
Figure 11 shows the back expansion vane of impeller and r2 is the section line. The gas distribution at the back of impeller at Q = 561 m3/h is shown in Figure 12. When r2/R changes from 0.38 to 0.60, the gas distribution Cv reduces. It is found that Cv is less than 45% at r2/R ≥ 0.60. Marked in the dash-boxes, the presence of the volute tongue causes that lower Cv at φ 90°–180° than the other area.

Back expansion passage of impeller.

Gas distribution of back of impeller along the Q = 561 m3/h impeller.
Experimental results
According to CFD investigation, the assembly of impeller and turbulence generator is shown in Figure 13, and the degas hole position r/R is 0.53. The number of turbulence generator blades is 4.

Impeller with degas hole r/R = 0.53 and turbulence generator.
Figure 14 shows the MC pump test rig, which used sonar flow meter to obtain the pulp flow rate and gas fraction at the outlet of pump. By changing the speed of vacuum pump and controlling valve, the vacuum gauge pressure sets to 0.5 atm. The pump is driven by an induction motor whose speed is controlled by an inverter. The pump rotational speed is 1980 r/min.
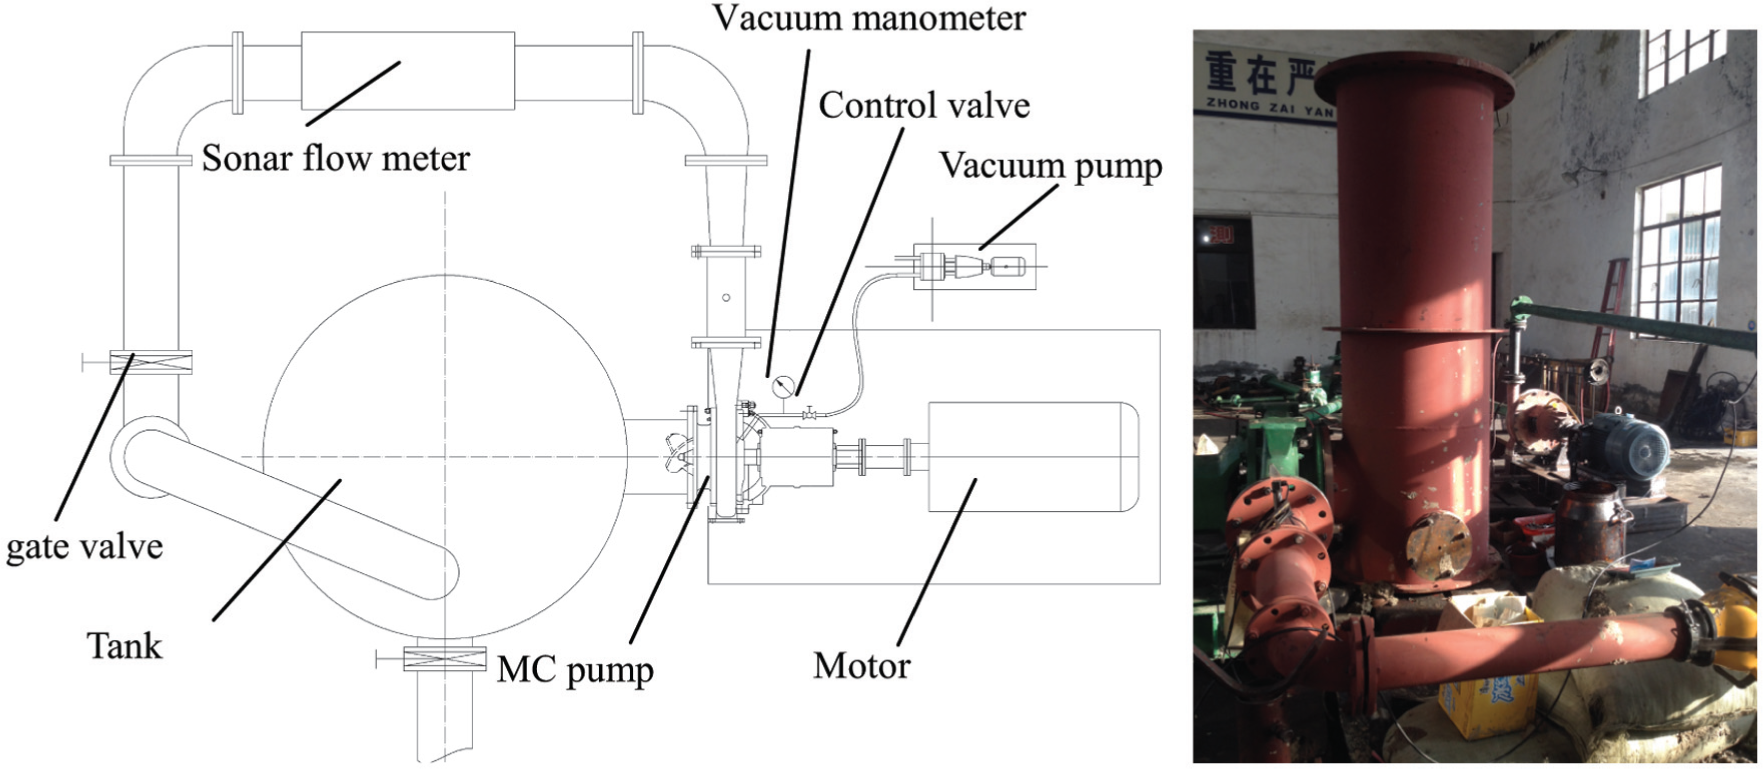
MC pump test rig.
The comparisons of the experimental and CFD results are shown in Figure 15, and the more experimental details are found in Daoxing et al. 21 It is found that the increasing flow rate decreases the output head and increases the gas fraction. At the flow rate Q = 561 m3/h, the experimental head and gas fraction is very close to the CFD results. However, the pulp flow in MC pump is complex, and the deviations of head and gas fraction between experiment and CFD are 4.86% and 5.71%, respectively.

CFD and experimental results.
Summary and conclusion
MC pulp fiber suspension as a non-Newtonian fluid is pumped by MC pump in papermaking industry. The rheology behaviors of pulp suspension were acquired by the experimental test. A modified H-B model and the Eulerian gas–liquid two-phase model were utilized to investigate the MC pump performance and the mixing gas distribution. The results are validated by the comparison between CFD and experiment.
It is found that r/R = 0.53 is the best position for degas hole as the gas volume content Cvp at the pump outlet is less than 0.1% and Cvap at the vacuum inlet is 9.8%, while the output head is at maximum. With the increasing rotation speed, Cvp increases, but Cvap reduces. The numbers of turbulence blades and impeller blades affect mostly the gas distribution on the impeller, especially for r1/R changing from 0.51 to 0.55. Because of asymmetric volute structure, the Cv at the back of impeller with the azimuthal angle from 90° to 180° is lower than that in other area when r2/R is from 0.38 to 0.53.
Footnotes
Appendix 1
Academic Editor: Moran Wang
Declaration of Conflicting Interests
The author(s) declared no potential conflicts of interest with respect to the research, authorship, and/or publication of this article.
Funding
The author(s) disclosed receipt of the following financial support for the research, authorship, and/or publication of this article: This study was supported by the National Natural Science Foundation of China (Grant No. 51279068) and a Project Funded by the Priority Academic Program Development of Jiangsu Higher Education Institutions (PAPD). Thanks to my professor, Li Hong, and our research group for giving me so many helps.