
Abstract
In the State of Florida, several types of exit ramps are used, including single-lane exit ramp with a taper, single-lane exit ramp without a taper, two-lane exit ramp with an optional lane, and two-lane exit ramp without an optional lane. Drivers exiting freeways need to make maneuver decisions (lane change, lane merge, and decelerate) prior to exit ramps in order to access cross roads at interchanges. Different exit ramp types lead to varying driving maneuvers when exiting, affecting the operational and safety performance on freeways. Based on the facts, there are several issues that need to be addressed in selecting the most optimum types of freeway exit ramps. This article mainly focuses on the comparison of operational performances of different ramp types and tries to present a method for choosing the optimal one. A data collection of 24 sites in Florida were conducted, and traffic simulations by Traffic Software Integrated System: Corridor Simulation were employed. Mathematical models were built to evaluate impacts of these ramps based on simulations. And an analytical hierarchy process method was applied to assign significance weight for all selected measures of effectiveness in terms of Florida questionnaire. Finally, an aggregate numerical evaluation was provided according to calculated data.
Introduction
There are several types of exit ramps used for traffic to exit freeways in Florida, in the United States (i.e. Interstate and Turnpike Systems). 1 Typically, four types of freeway exit ramps are most widely used according to their geometry configurations (Figures 1–4). Drivers exiting freeways need to make decisions and execute maneuvers (lane change, lane merge, and decelerate) prior to the exit ramp in order to access cross roads at the interchanges. 2 Different types of exit ramps can cause dissimilar driving behaviors when traffic exits freeways. And there is no doubt that ramp type will affect operational and safety performance on freeway, such as number of lane change, speed variance, and control delay.3–6 Therefore, these issues and concerns need to be addressed to evaluate operational performance on freeways, which could give help on selecting the optimal ramp type under given design conditions in terms of performance analysis.

Exit ramp type I: single lane with a taper.

Exit ramp type II: single lane without a taper.
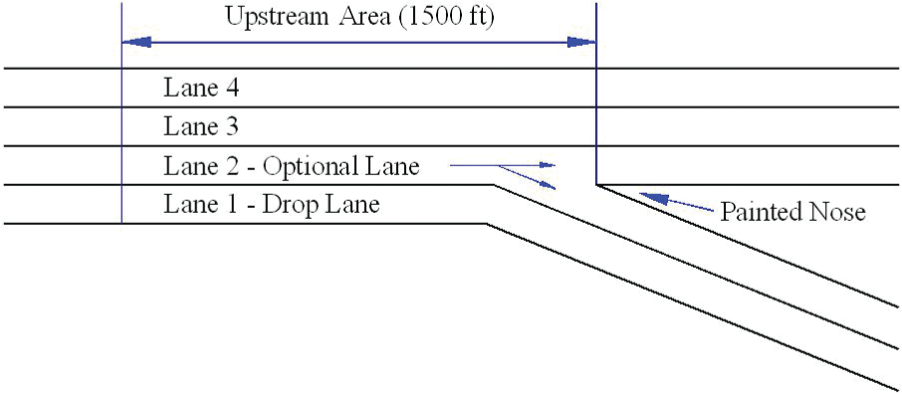
Exit ramp type III: two lanes with an optional lane.

Exit ramp type IV: two lanes without an optional lane.
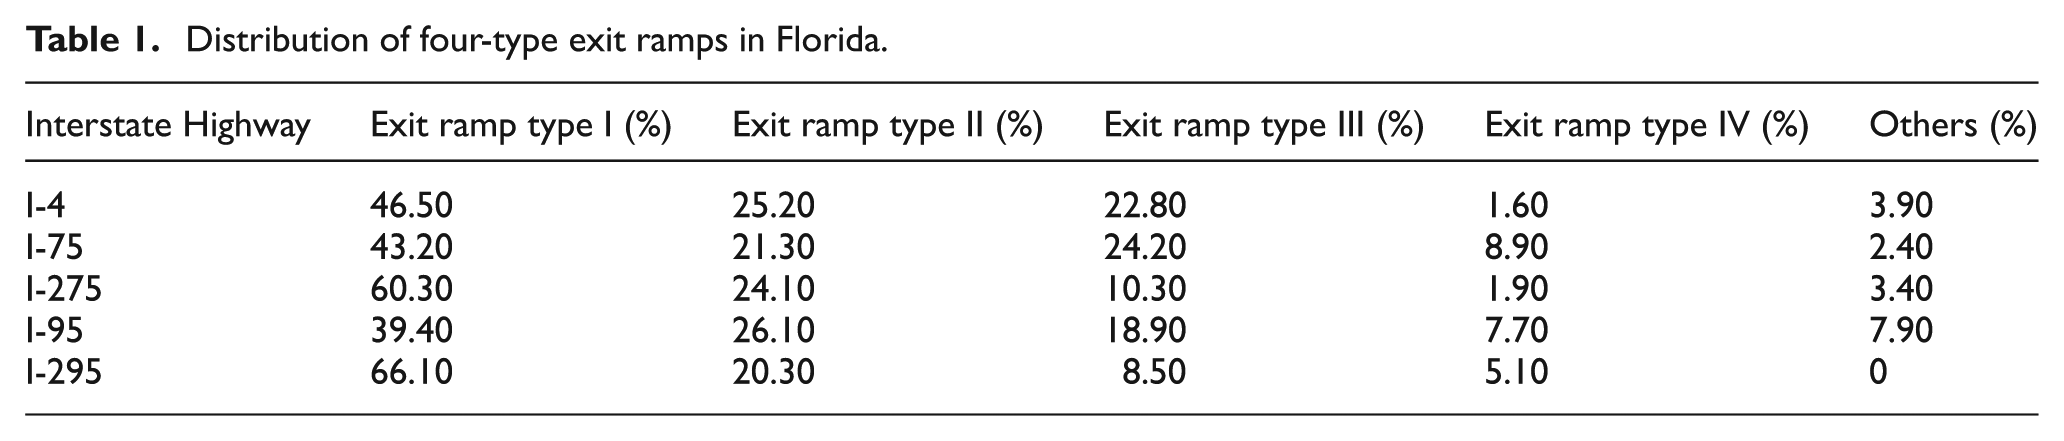
As these four types of exit ramps are the most widely used ones (see Table 1), and the issues mentioned above have not been clearly studied in the past, the Florida Department of Transportation (FDOT) in joint cooperative efforts with the local land use agencies set up a research project (Safety and Operational Performance Evaluation of Two-Lane Exit Ramps with Optional Lane on Florida’s Freeways) to determine the type of exit ramps that should be constructed at a given location considering the prevailing conditions applicable to traffic, roadway, and land use developments. This article mainly focuses on operational performance analysis on freeway section affected by exit ramp. According to previous studies, the distance of 1500 ft ahead of the painted nose of exit ramps is normally considered the impact area by exit ramps. And the operational performance analysis is mainly conducted within this area.
Distribution of four-type exit ramps in Florida.
A method is proposed analyzing the operational performance of freeway exit ramps in assistance with computational simulations (Traffic Software Integrated System: Corridor Simulation (TSIS-CORSIM)) in terms of some field data collection of design parameters on roadway geometry, traffic flow, and so on. This method presents mathematical models to numerically evaluate the operational performance by selecting some reasonable measures of effectiveness (MOEs).
Literature review
The freeway is one of the primary components of a transportation network and is categorized as the highest functional hierarchy of the highway system. 7 The grand reliance on this facility promotes the essence of applying a reliable, efficient, and sustainable infrastructure system; thus, the operational performance is obviously an important consideration in freeway exit ramp design.8,9 Many factors are related to operations on freeways and their adjacent facilities. The wide variety of site geometric conditions, traffic volumes, ramp types, and design layouts could increase or decrease operation levels.10–13
Cassidy et al. 14 conducted research on freeway traffic near an exit ramp. He assumed that the freeway section near an exit ramp is a bottleneck. A bottleneck with a diminished capacity is shown to have arisen on a freeway segment whenever queues from the segment’s off-ramp spilled over and occupied its mandatory exit lane.
Newell 15 studied the delays caused by a queue at a freeway exit ramp. This occurs when a queue from an exit ramp backs onto the freeway, causing a partial blockage of the right lane. Exiting vehicles are confined to the right lane but thru vehicles can travel in any lane. The two vehicle types interact, but their queues must be treated separately. This illustrates a special case of a model of “freeways with special lanes” formulated by Danganzo. 16 Whereas Danganzo presented a numerical scheme of calculating flows, the emphasis here is on graphical evaluation of the complete evolution of the queues. The graphical solution more clearly illustrates the practical issues.
Xiao et al. 17 studied the minimum-length-requirement model for expressway off-ramp joint. With the definition and basic hypothesis of off-ramp joint, the characteristic of its structure and traffic flow are analyzed. From a systematic viewpoint, kinematics, gap-acceptance theory, and probability theory were employed to establish the minimum-length-requirement model for expressway off-ramp joint. While modeling, the more difficult traffic maneuver of running off the off-ramp road, finishing its interweaving, and running onto the left-turn lane of downstream intersection was taken into consideration comprehensively.
Bunker and Troutbeck 18 predicted minor stream delays at a limited priority freeway merge. He discussed the development and application of a limited priority gap-acceptance model to freeway merging. In the limited priority model, drivers in the major stream at a merge area may incur delay in restoring small headways to a larger, sustainable minimum headway between them and the vehicle in front. This allows minor stream drivers to accept smaller gaps. The headway distributions are assumed to be distributed according to Cowan’s M3 model, whose terms were calibrated for this system. Minor stream minimum follow-on time was calibrated, and a realistic range of the critical gap was identified. An equation was developed for minimum average minor stream delay.
In general, exit ramp is always an important research interest. Other than the above, research has been identified to focus on many aspects, including driver behavior, 19 waving area operations, 20 ramp configuration, 21 and crash analysis on freeway and ramps. 22 However, specific analysis on operational performance of different types of exit ramps has not conducted yet. Therefore, possible results and conclusions of this research are very helpful for exit ramp evaluation and selection, as well as some geometry design issues.
Data collection
To satisfy the requirements of TSIS-CORSIM and sample size of modeling, field data collection of totally 24 exit ramps was conducted to get all necessary data, some basic information is shown in Table 2. Ramp type and number of through lanes on freeway were detected using Google Earth. Traffic volume during peak hour on both freeway and exit ramp were captured based on video camera, which can also tell ratio of heavy vehicles on traffic. Digital video cameras were used in this study, with high pixels of resolution (1300 × 1030) and frame rate of 30/s. They were all mounted on clear vantage points (e.g. top of buildings, long poles, and freeway overpass) to obtain data, depending on the geometrics and build environment of the selected ramps. The video data of each ramp were examined by three trained observers to ensure its accuracy.
Basic information of 24 exit ramps.

I: Interstate Highway; SR: state road; CR: county road; Ave: avenue; Blvd: Boulevard; St: street; Dr: drive.
Vehicle time headway was observed using a timer, and operational speed on freeway was detected by radar guns, observing positions and major pieces of equipment are shown in Figure 5. All other geometric parameters (lane width, grade, curvature, super elevation, etc.) of freeway and exit ramp were provided by FDOT.

Data collection using video camera and radar gun.
All the information mentioned above, including geometry and traffic data, were reduced and analyzed in a laboratory and prepared for further analysis in simulations.
TSIS-CORSIM simulation
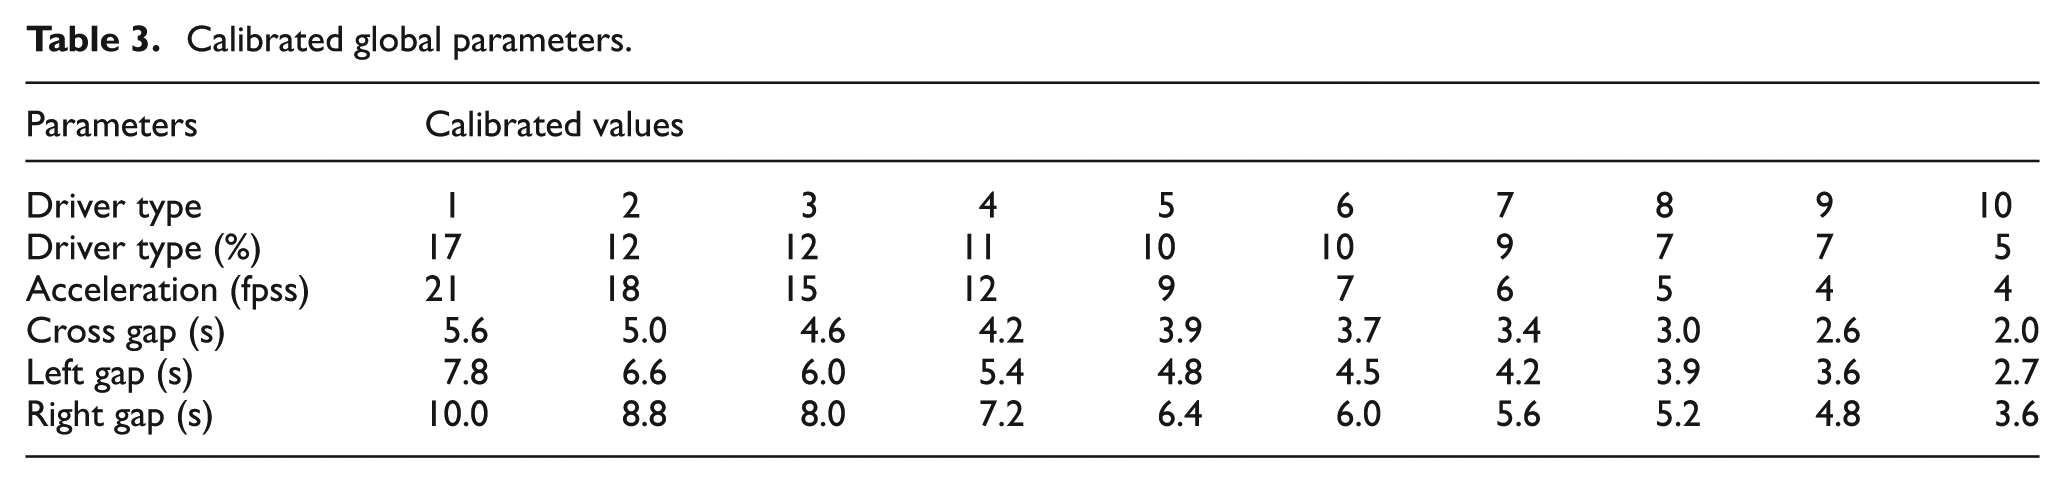
TSIS-CORSIM was chosen for microscopic simulation, which is a popular and integrated software in United States, and provides both freeway and non-freeway logics. Simulation models were set up for these 24 sites according to field data collection (Figure 6 shows the animation window of samples 10 and 11 in Table 2). These models included freeway section and ramp section (cross-section of surface road was not included for analysis). All geometry data, such as number of lanes, lane width, curvature, grade, super elevation, were imported to TSIS-CORSIM, as well as traffic data, like hourly volume on freeway and exit ramp, ratio of heavy vehicles, average time headway, and so on. In addition, travel time was used for model calibration. Simulation results showed that the average error of travel time compared from field data and simulation output is 11.2%, which is a little larger than general threshold 10%. According to the characteristics of traffic flow in Florida, the dispersion of different types of drivers was changed because Florida has a high rate of older drivers than the default settings in TSIS-CORSIM. And the calibrated value changed to 8.9%, which was lower than 10%. The calibrated parameters are shown in Table 3.

Animation output of a complete interchange in TSIS-CORSIM.
Calibrated global parameters.
On each site, some parameters were changed after running for real data. These parameters were traffic volume both on freeway and ramp, number of through lanes on freeway, and operational speed on freeway. This kind of change extended simulation samples, saved time, and labor force for more field data and provided extra data for data analysis. For example, after data calibration, validation, and simulation running on one site at I-75 at SR 56, parameters of freeway volume, ramp volume, freeway speed, and number of through lanes were changed, respectively, and combined for more simulation models, which could create hundreds of new ones. All these results would be reserved for the analysis.
TSIS-CORSIM can generate lots of MOEs. Four MOEs out of these were selected for operational analysis: number of lane change on freeway before exit ramp, speed variance on freeway before exit ramp, average speed on freeway, and delay time per vehicle on freeway before exit ramp.
Number of lane change is a very important parameter for operational evaluation. Because more number of lane change happened, traffic flow consistency would be decreased and higher probability of side swipe and rear end crashes would be caused. Speed variance is another parameter that would affect both operations and safety. Previous researches had shown the larger value of speed variance, the higher crash rate, especially for rear end type. Average speed indicated the difference with design speed and the traffic efficiency. Delay time per vehicle is another parameter for operational performance, lager delay time to lower degrees of level of service (LOS) on freeway.
Mathematical model
Mathematical models were built up to evaluate and forecast the possible value for the four MOEs mentioned above. A linear regression model (equation (1)) was developed, which fitted large number of dependent variables well. The format of the model is shown as following. This model was based on outputs from all simulation results
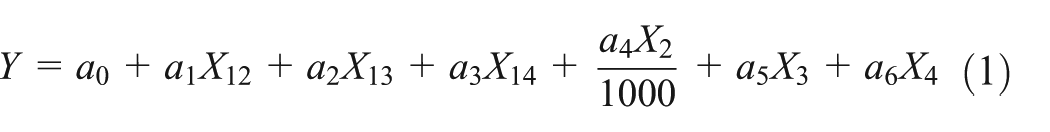
where Y is the dependent variable, selected MOEs, ai the coefficients, X12 the ramp type II, X13 the ramp type III, X14 the ramp type IV, X2 the freeway volume (vph), X3 the exit rate (%), and X4 is the number of thru lanes on freeway.
Equation (1) attempts to link the relationship between MOE and ramp type, freeway volume, exit rate, and number of thru lanes, which were considered to significantly affect the traffic operation of freeways. All outputs from simulations (including field data) were sorted into format of comma separate value (CSV) and input to statistical software R-Gui. R-Gui provided whole process of regression, like estimate values, errors, tests, and so on (Tables 4–7). Significant test for all independent variables of the four models indicated very low p values. And the adjusted R2 values were around 0.7, which were also acceptable. The linear regression models show good standing and performance to delineate relationships between presented dependent variables and independent variables. And these estimates of exit ramp type X12, X13, and X14 tell clearly the impacts of ramp types upon operational performance.
Coefficients for number of lane change.
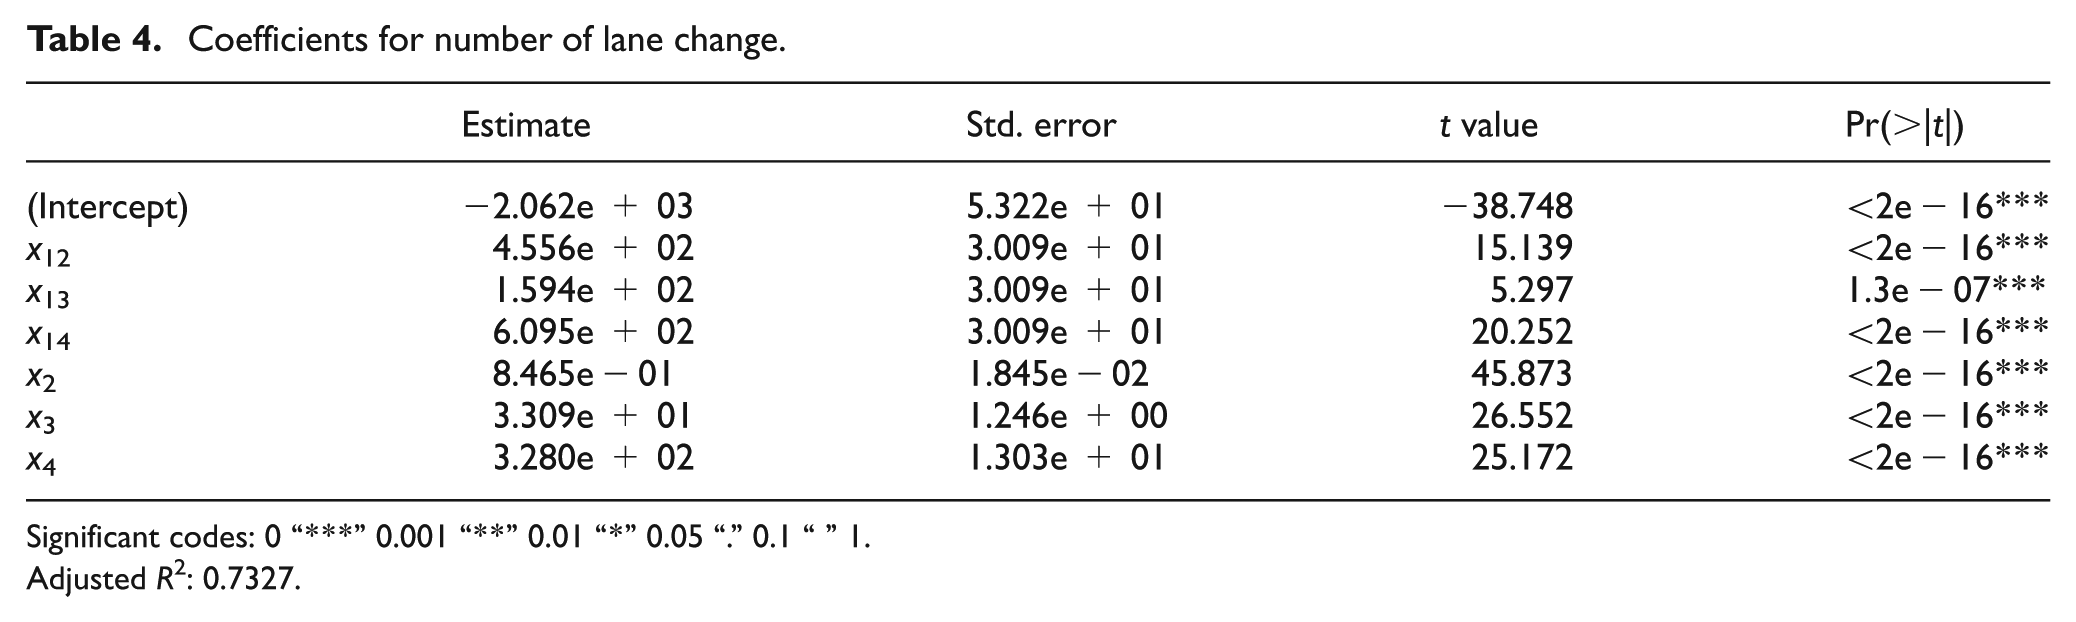
Significant codes: 0 “***” 0.001 “**” 0.01 “*” 0.05 “.” 0.1 “” 1.
Adjusted R2: 0.7327.
Coefficients for speed variance.

Significant codes: 0 “***” 0.001 “**” 0.01 “*” 0.05 “.” 0.1 “” 1.
Adjusted R2: 0.7132.
Coefficients for average speed.

Significant codes: 0 “***” 0.001 “**” 0.01 “*” 0.05 “.” 0.1 “” 1.
Adjusted R2: 0.7653.
Coefficients for delay time.

Significant codes: 0 “***” 0.001 “**” 0.01 “*” 0.05 “.” 0.1 “” 1.
Adjusted R2: 0.6929.
Evaluation
According to the results from Tables 4–7, it is clear that ramp type I has the least number of lane changes out of the four types, and type IV has the largest. For the MOE of speed variance and average speed, the performance is the opposite: ramp type IV is the best, and type I the worst. For delay time, ramp type II is the best, and type I the worst. Table 8 shows the comparisons as below. It seems that the performance sequence of number of lane change is quite different from other three MOEs, which indicates that number of lane change caused by exit ramps will not affect obviously the performance of traffic flow, but it does impact safety performance based on previous experience.
Comparison for four selected MOEs.

MOE: measures of effectiveness.
All these models supplied a quantitative estimation for the four MOEs. However, for decision makers who choose exit ramps in field, it is hard to summarize the four models in an aggregate way supporting determinations. The point is how to assign the weights upon the four MOEs, and then aggregate them for analysis. The analytical hierarchy process (AHP) was used herein to solve such issues.
The AHP was developed by Thomas L. Saaty in the 1970s, and it is a structured technique for organizing and analyzing complex decisions. It has particular application in group decision-making and is used around the world in a wide variety of decision situations. The AHP helps decision makers find one that best suits their goal and their understanding of the problem. It provides a comprehensive and rational framework for structuring a decision problem, for representing and quantifying its elements, for relating those elements to overall goals, and for evaluating alternative solutions.
A questionnaire was designed in Florida for civil engineering professionals, graduate students, senior consultants, and so on to ask for the relative significance out of number of lane change (B1), speed variance (B2), average speed (B3), and delay time (B4). A total feedback of more than 200 replies was received, and the aggregate values are sorted as shown in Table 9.
Relative comparison matrix.

Values 1: equally important; value 3: moderately more important; value 5: strongly more important; value 7: very strongly more important; value 9: extremely more important; values 2, 4, 6, and 8: intermediate judgment values.
A consistency test was conducted to make sure the information provided for the matrix is reasonable. The consistency index (CI) was calculated as 0.8889713 due to the matrix, and the random consistency index (RI) was 0.9. Thus, the consistency ratio CI over RI equals 0.09877459, which is lower than the maximum criterion 0.1, and it proves that the AHP application is acceptable and reliable.
According to the questionnaire observation in the state of Florida, the number of lane change is considered to be the most important to operations, followed by speed variance, average speed, and delay time by orders.
Take exit ramp type I as the reference and compare other ramp types with type I, which means considering value of the four MOEs as 1 for type I. Therefore, the average relative values of the four MOEs for other types were calculated in Table 10 in terms of all simulation results. A good performance is the ramp type with the least number of lane change, speed variance, and delay time, and the largest average speed. Thus, the value of average speed was labeled as negative value to keep the accordance. Finally, exit ramp type I has the best operational performance, types II, III, and IV follows by sequence.
Aggregate values for performance evaluation.

Conclusion
The regression models show different impacts of four types of ramps upon number of lane change, speed variance, average speed, and delay time. And the impacts of number of lane change have different orders by comparing the impacts of other three MOEs.
The AHP analysis method indicates the significant weights of the four MOEs, respectively, which reveal that the number of lane change and speed variance are the two most important parameters for operational evaluation.
According to the weight assignment in the state of Florida, exit ramp type I has the best operational performance, which is much better than types II, III, and IV. Therefore, exit ramp type I is the first priority for construction if all other considerations permit. And this conclusion is accordant with the large percentage of type I in Florida.
In general, this research provides valuable information on how different exit ramp types could potentially affect operational performance of freeways and thus help traffic engineers to make a better decision on freeway design.
For the transferability, it is not known that the proposed model can be directly used to evaluate highways in other countries, especially some developing countries with high traffic demand. Future research should be focused on this topic. In addition, other weight assignments can be applied according to specific conditions or concerns, which might lead a different order of ramp type.
Footnotes
Acknowledgements
The Florida Department of Transportation (FDOT) is greatly appreciated for providing help on the information provided. The authors also would like to thank all Research Assistants at the Department of Civil and Environmental Engineering of the University of South Florida for their assistance in field data collection and data reduction.
Academic Editor: Xiaobei Jiang
Declaration of conflicting interests
The author(s) declared no potential conflicts of interest with respect to the research, authorship, and/or publication of this article.
Funding
The author(s) disclosed receipt of the following financial support for the research, authorship, and/or publication of this article: This research project was partly sponsored by the Florida Department of Transportation (FDOT). Additionally, this research project was also partly sponsored by “Shanghai Pujiang Program” (15PJC093) and “the Fundamental Research Funds for the Central Universities” (1600219254).