
Abstract
In this article, the safety implication of freeway exit ramps is examined using a newly developed conflict-based safety metric. A multi-step Monte Carlo simulation procedure is proposed to estimate the crash probability of a conflict (i.e. the conflict metric), considering the stochastic nature of human reaction (i.e. reaction time) and vehicle capability (i.e. maximum braking rate). Motion prediction methods are introduced to determine possible crash occurrence during the Monte Carlo procedure, for the two main conflict types (i.e. rear-end conflict and lane-change conflict) frequently occurring within freeway exit ramps. Notably, the conflict metric is able to differentiate two types of crash occurrences of lane-change conflicts: sideswipe and rear-end crashes. Safety evaluations on 16 freeway exit ramps based on microscopic traffic simulation is conducted; based on the proposed safety metric, a traditional time to collision–based conflict metric, as well as actual crash data, was proposed. The proposed metric shows the power in identifying relative safety among multiple freeway exit ramps and potential in directly predicting actual crashes. Thus, it could be considered as a promising tool for safety evaluation on freeway exit ramps, providing practitioners and professionals valuable information in traffic design, control, and management of freeway exit ramps.
Keywords
Introduction
Freeway ramps are potentially crash-prone area, where a large number of merging and diverging movements occur. 1 According to crash statistics, 2 18% of freeway crashes, 17% of injury crashes, and 11% of fatal crashes occurred within freeway ramp area. Especially, crash rates within exit ramp area are four to six times higher than other roadway sections and two to three times higher than on-ramp sections. 3 In light of these facts, the safety of freeway exit ramps should be largely improved.
In order to improve ramp safety, researchers have made a lot of efforts in terms of crash modeling, driving behavior studies, and safety evaluation. Among them, the main purpose of crash modeling is to identify factors associated with crash frequency2,4–7 or crash severity of ramp areas.8–11 As such, safety counter-measures and interventions could be proposed for freeway ramps.
Behavior studies mainly focus on relating drivers’ behaviors (e.g. car following and lane changing) with ramp geometrics and traffic characteristics.12–16 With the understanding of driving behaviors (e.g. merging and diverging) within ramp area, specific traffic design and control strategies can be implemented for safety improvement.
As for safety evaluation, a variety of methods have been proposed to estimate and predict the safety implication of freeway ramps. The motivation of such studies comes from the fact that crash data are oftentimes lacking or incomplete. In this case, crash modeling and prediction based on historical data cannot be conducted, and surrogate safety methods should be used instead. A number of research have been identified focusing on this topic.17–23 However, the current safety evaluation methods mainly use traffic flow characteristics (e.g. speed difference) to analyze safety without considering vehicle interactions. Vehicle interactions (i.e. traffic conflicts) caused by merging and diverging behaviors should be investigated. Traffic conflict is oftentimes used by researchers to examine vehicle interactions and thus traffic safety. Traditional conflict studies were based on field observations or video techniques.24–26 In recent years, traffic simulations have been utilized in safety analysis. Compared to field observations, traffic simulations significantly reduce the workload of data collections and improve data accuracy in terms of eliminating human errors. 27 To develop a promising simulation-based conflict metric, stochastic models have been introduced to predict crash propensity of vehicles’ interactions for video-based conflict studies.28–32 However, to our knowledge, there is no such simulated conflict-based safety metric dedicatedly developed for freeway ramp area.
To fill the gap, in this study, a new conflict-based safety metric will be developed to evaluate the safety performance of freeway exit ramps. The proposed model is based on the previous work by Wang and Stamatiadis. 29 The proposed metric is expected to identify the actual safety implication of exit-ramp area.
Methodology
The general procedure
A lane-change process could cause two types of crashes, including rear-end and sideswipe. Thus, for a certain lane-change conflict, it is important to estimate its potential crash probability, by capturing drivers’ possible behaviors as well as predicting vehicles’ trajectories. In this article, a Monte Carlo procedure is proposed based on motion prediction methods. The basic idea is based on the previous work by Wang and Stamatiadis. 28 First of all, the proposed procedure is a general process that can be applied for various conflict types, including crossing, rear-end and lane-change conflicts. For freeway ramp area, lane-change conflicts and rear-end conflicts are the two major conflict types, caused mostly by merging and diverging behaviors. For a simulated conflict, there could be a number of different results due to variation of drivers and vehicles. Suppose that for a certain conflict, there are various combinations of drivers and vehicles going through it. Different scenarios could result in different consequences in terms of crash occurrence (i.e. crash or not). Thus, the aim of this procedure is to find out how many scenarios will generally lead to crashes for a particular conflict, if we consider millions of different scenarios by introducing the uncertainty in drivers and vehicles. In doing so, the estimated crash probability of the conflict can be derived as the equivalence of the proportion of crash scenarios, which is the proposed safety metric in this study. The procedure (Figure 1) consists of the following four steps.

The general procedure of deriving the conflict-based metric.
Step 1. Create a scenario by assigning two drivers into a conflict event at the moment when it occurs. Each driver will be given a random reaction time (RT) Xi (i = 1, 2) based on empirical reaction time distributions (RTDs). Then, compare drivers’ RT to the time to collision (TTC). TTC is a conflict indicator that indicates the remaining time to the crash by assuming that two vehicles remain in their velocity.
If the two drivers both have their RT larger than TTC (i.e. Xi > TTC), they will fail to respond to the emergency, and a crash will certainly occur. In this case, skip Step 2 and jump to Step 3. Otherwise, if any driver could make an early reaction (X1 or X2 < TTC), a crash could be possibly prevented when proper evasive actions are applied. For the latter case, the scenario needs to be further examined in Step 2.
The RTD was determined as log-normal distribution in previous research.33,34 In this study, the log-normal distribution for lane-change conflicts is set to be with mean of 1.3 s and standard deviation of 0.6 s. For rear-end conflicts, the mean and standard deviation are chosen to be 0.92 and 0.28 s, respectively.
Step 2. When X1 or X2 < TTC, the scenario is further examined, by assigning each driver a random maximum braking rate (MABR) of Yi (i = 1, 2) based on empirical MABR distribution. Compare MABR with the required braking rate (RBR) under this particular scenario and determine crash occurrence. For a specific conflict, the conflict information (speed, TTC, distance, etc.) can be directly extracted from surrogate safety assessment model (SSAM). Since both RT and MABR have been randomly selected for this scenario, the RBR can be derived based on motion prediction methods, which are discussed in section “The motion prediction methods of determining crash occurrence for rear-end and lane-change conflicts.”
MABR distribution was determined as a truncated normal distribution based on previous research 30 and the Road & Truck database. The mean and standard deviation was 9.7 and 1.3 m/s2, respectively. The lower limit and upper limit were determined to be 4.2 and 12.7 m/s2, as suggested by the literature. 30
Step 3. If the scenario is determined to be a crash in either Step 1 or Step 2, then store the record and create a new scenario (i.e. go back to Step 1). If not, then directly go back to Step 1.
Step 4. Repeat the first three steps for a number of times (e.g. 10,000 times) to generate sufficient scenarios. Add up all stored crash scenarios and calculate their proportion. Convert the proportion into crash probability, which is named as conflict risk index (CRI).
Thus, for every single conflict, there is a unique CRI derived based on this procedure. This process can be considered as the application of Monte Carlo simulation process. It is a general process that can be applied to any type of conflicts involving two parties. In this study, we focus on exit-ramp areas and the two dominating conflicts: rear-end conflicts and lane-change conflicts. Thus, for the two conflict types, CRI can be mathematically specified as an integral form

where
The aggregate crash propensity metric (ACRI) is the aggregation of CRI of the conflicts belonging to the same category

where ACRIi is the safety index of the ith type of conflicts, CRIij is the CRI of the jth conflict in the ith type, and N is the total number of ith type of conflicts.
It should be noted that ACRI is not a crash prediction but rather an indicator of the relative level of safety for the location. This metric can be used in comparative analyses and evaluations of locations and, as discussed later, has the potential to be a predictor of crash frequency.
The motion prediction methods of determining crash occurrence for rear-end and lane-change conflicts
In the first two steps of the procedure, a conflict needs to be determined if it would lead in a crash. In Step 1, it is simple to compare RT with TTC. However, in Step 2, the decision on cash occurrence could be somewhat complicated. Thus, for the two main types of conflicts within ramp area, decision methods are proposed separately. These methods can also be found in our recent works.29–31 Since only rear-end and lane-change conflicts are studied for ramp area, the leading vehicle is assumed to retain their speed, while the following one will apply brakes with full force once the driver reacts, during a conflict process. This assumption is reasonable and covers most of rear-end and lane-change conflicts, because drivers in the front do not realize the dangers behind. Another important assumption is that once the subject vehicle applies brakes, the deceleration of the vehicle remains unchanged. Although it could be sometimes unrealistic, we believe that in most urgent cases, drivers will keep such behaviors. To develop motion prediction models, let li and wi be the length and width of the vehicle i, respectively; Vi be the speed of vehicle i; D be the distance; and
Lane-change conflict
A lane-change conflict may lead to either a sideswipe crash or a rear-end crash. Figure 2 shows the process of a lane-change conflict. In this case, vehicle 1 needs to exit the ramp and is making lane-change movements. If two vehicles retain their velocity, the conflict will turn into a sideswipe crash at time TTC with angle
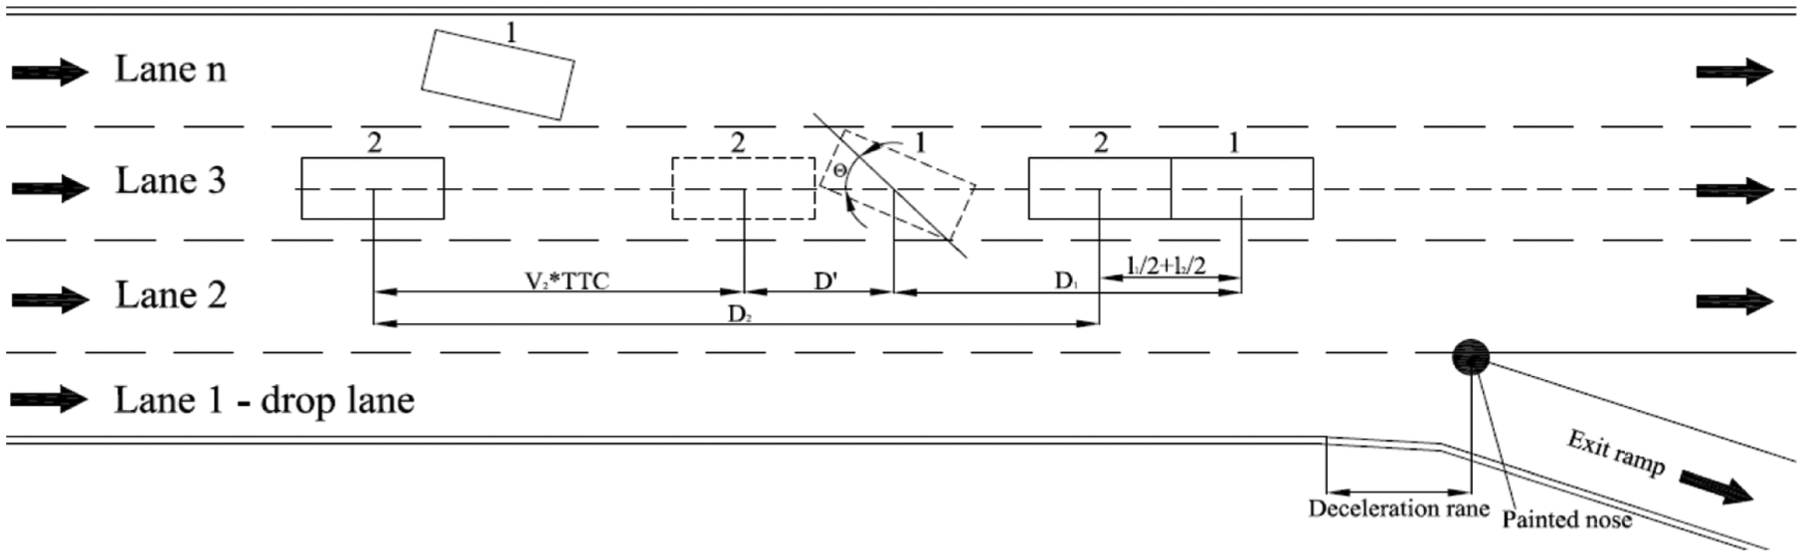
A lane-change conflict occurring at a freeway exit ramp.
The total time period of lane-change movement of vehicle 1 can be calculated by

To avoid a sideswipe crash, vehicle 2 cannot crush vehicle 1 when vehicle 1 is making a lane-change movement
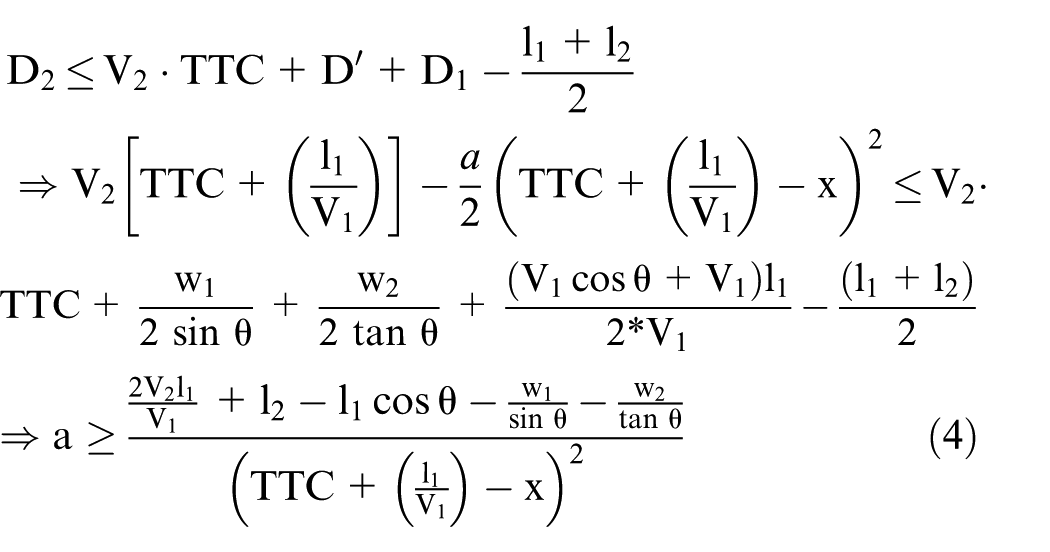
In this case, the RBR can be specified as

When vehicle 2 successfully makes lane change, the conflict between the two changes into a rear-end conflict. In this case, vehicle 2 cannot collide with vehicle 1 before vehicle 2 decelerates the speed to the same as vehicle 1

The RBR for this condition is

In general, if the MABR < RBR (lane change), a lane-change crash would occur; if the MABR > max (RBR (lane change), RBR (rear end)′), no crash would occur; if RBR (lane change) < MABR < RBR (rear end)′, a rear-end crash would occur.
Thus, with this method, a lane-change conflict can generate two safety metrics for rear-end crashes and sideswipe crashes, respectively. To our knowledge, this is the first conflict-based safety metric linking lane-change conflicts to the two prominent crash types (i.e. rear end and sideswipe).
Rear-end conflict
In Figure 3, vehicle 2 (following) and vehicle 1 (leading) are driving approach to exit ramps. Vehicle 2 has larger speed than vehicle 1. However, with the presence of ramps, vehicle 1 may not be able to make lane change and overtake. In this case, vehicle 1 has to decelerate to avoid the crash. A crash will occur in the event that vehicle 2 cannot decelerate at least to the speed of vehicle 1 at the point where their distance headway will be 0 ft. In this case


A rear-end conflict occurring at a freeway exit ramp.
So, the RBR for rear-end type is

If the maximum braking rate of the vehicle 2 is no less than RBR, the collision would be prevented; otherwise, the collision would occur.
Safety evaluation on freeway ramps using CRI/ACRI
Field data of 16 off-ramp areas with similar geometric features (shown in Figure 4) were used to evaluate the proposed safety metric. The 16 exit ramps are along a section of national freeway G20 (Figure 5) in Shanxi Province. A VISSIM model was developed for this freeway section based on actual data, including geometric layout, traffic volumes, and truck percentage. The default settings in VISSIM were tested if they could be directly used for simulation. It was found that the field data fell out of the simulation data with default parameter settings. Thus, model calibration is very necessary. Traveling speed was used for model calibration, and the relationship between traveling speed and each parameter in the driver behavior model in VISSIM was examined by analysis of variance (ANOVA) tests. After that, significant parameters were calibrated, using the genetic algorithm with a fitness function identifying the relative error between field and simulated traveling speed. To validate the model, travel time was employed, and the prediction error was controlled under 5%. The simulation experiments were repeated for 10 times with random seeds, accounting for the stochastic nature of simulation. SSAM was introduced to extract trajectory data, and the proposed procedure in this article was employed to generate CRI for each simulated conflict and ACRI for each exit freeway ramps. Five-year crash data (2008–2012) were available for validating the strength of CRI/ACRI. Meanwhile, a traditional TTC-based metric was utilized for comparison. This metric has been widely used as a benchmark for safety evaluations, 35 which can be derived by selecting conflicts with TTC value <1.5 s. Two sets of tests were conducted, including safety rank tests and crash prediction tests. The safety rank tests were undertaken in order to examine the ability of ACRI to identify relative safety of exit freeway ramps. The crash prediction tests were used to identify the potential of ACRI in predicting actual crashes.
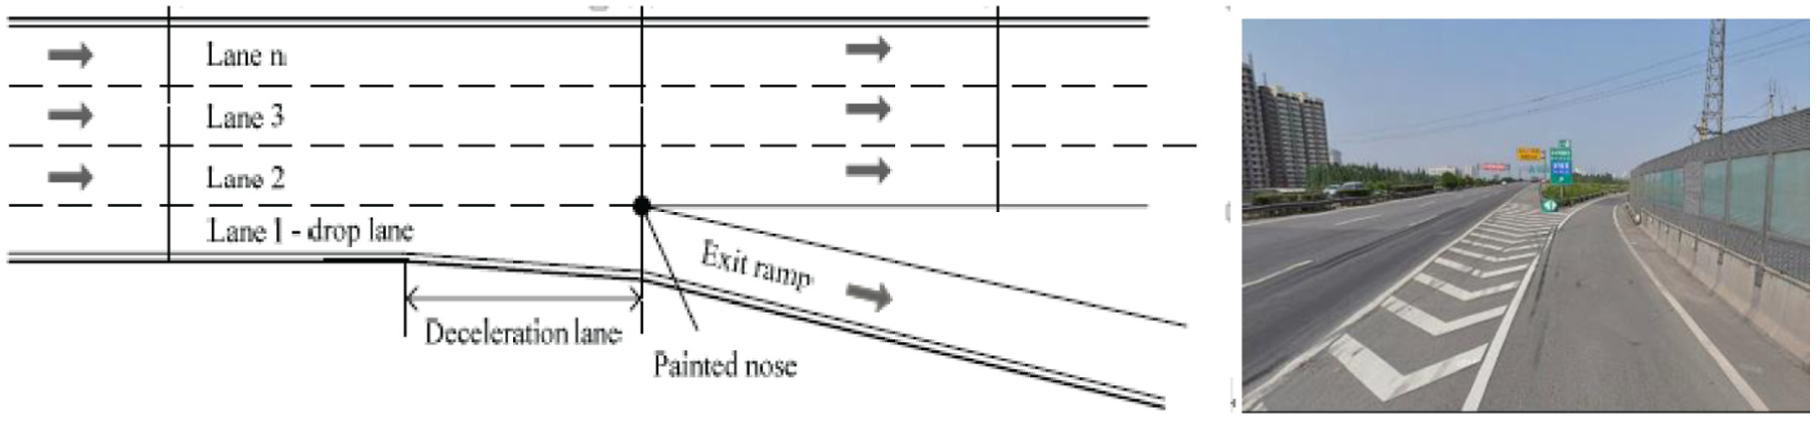
Typical geometric features of freeway exit ramps in G20.

The selected roadway section of freeway G20.
Safety rank tests
Tables 1 and 2 show the annual crash frequency, ACRI, and TTC-based metric (i.e. conflict numbers with TTC < 1.5 s) for rear-end type and sideswipe type, respectively. The safety performances of the 16 freeway exit ramps were ranked based on the three metrics. In the two tables, freeway ramps are specified with colors based on ranks: top 3 as red, 3–8 as yellow, and bottom 8 as green. For rear-end type, ACRI successfully identifies two of top 3 crash-prone locations and seven of top 8 crash-prone locations. However, the TTC-based metric only identifies one of top 3 crash-prone locations and five of top 8 locations. For sideswipe type, ACRI successfully identifies two of top 3 crash-prone locations and six of top 8 crash-prone locations. However, the TTC-based metric identifies one of top 3 crash-prone locations and three of top 8 locations. Intuitively, ACRI can better identify relative safety among multiple freeway exit ramps than the traditional TTC metric.
Rear-end crash frequency, ACRI, TTC metric, and rank for each exit ramp.

ACRI: aggregate crash propensity metric; TTC: time to collision.
Sideswipe crash frequency, ACRI, TTC metric, and rank for each exit ramp.
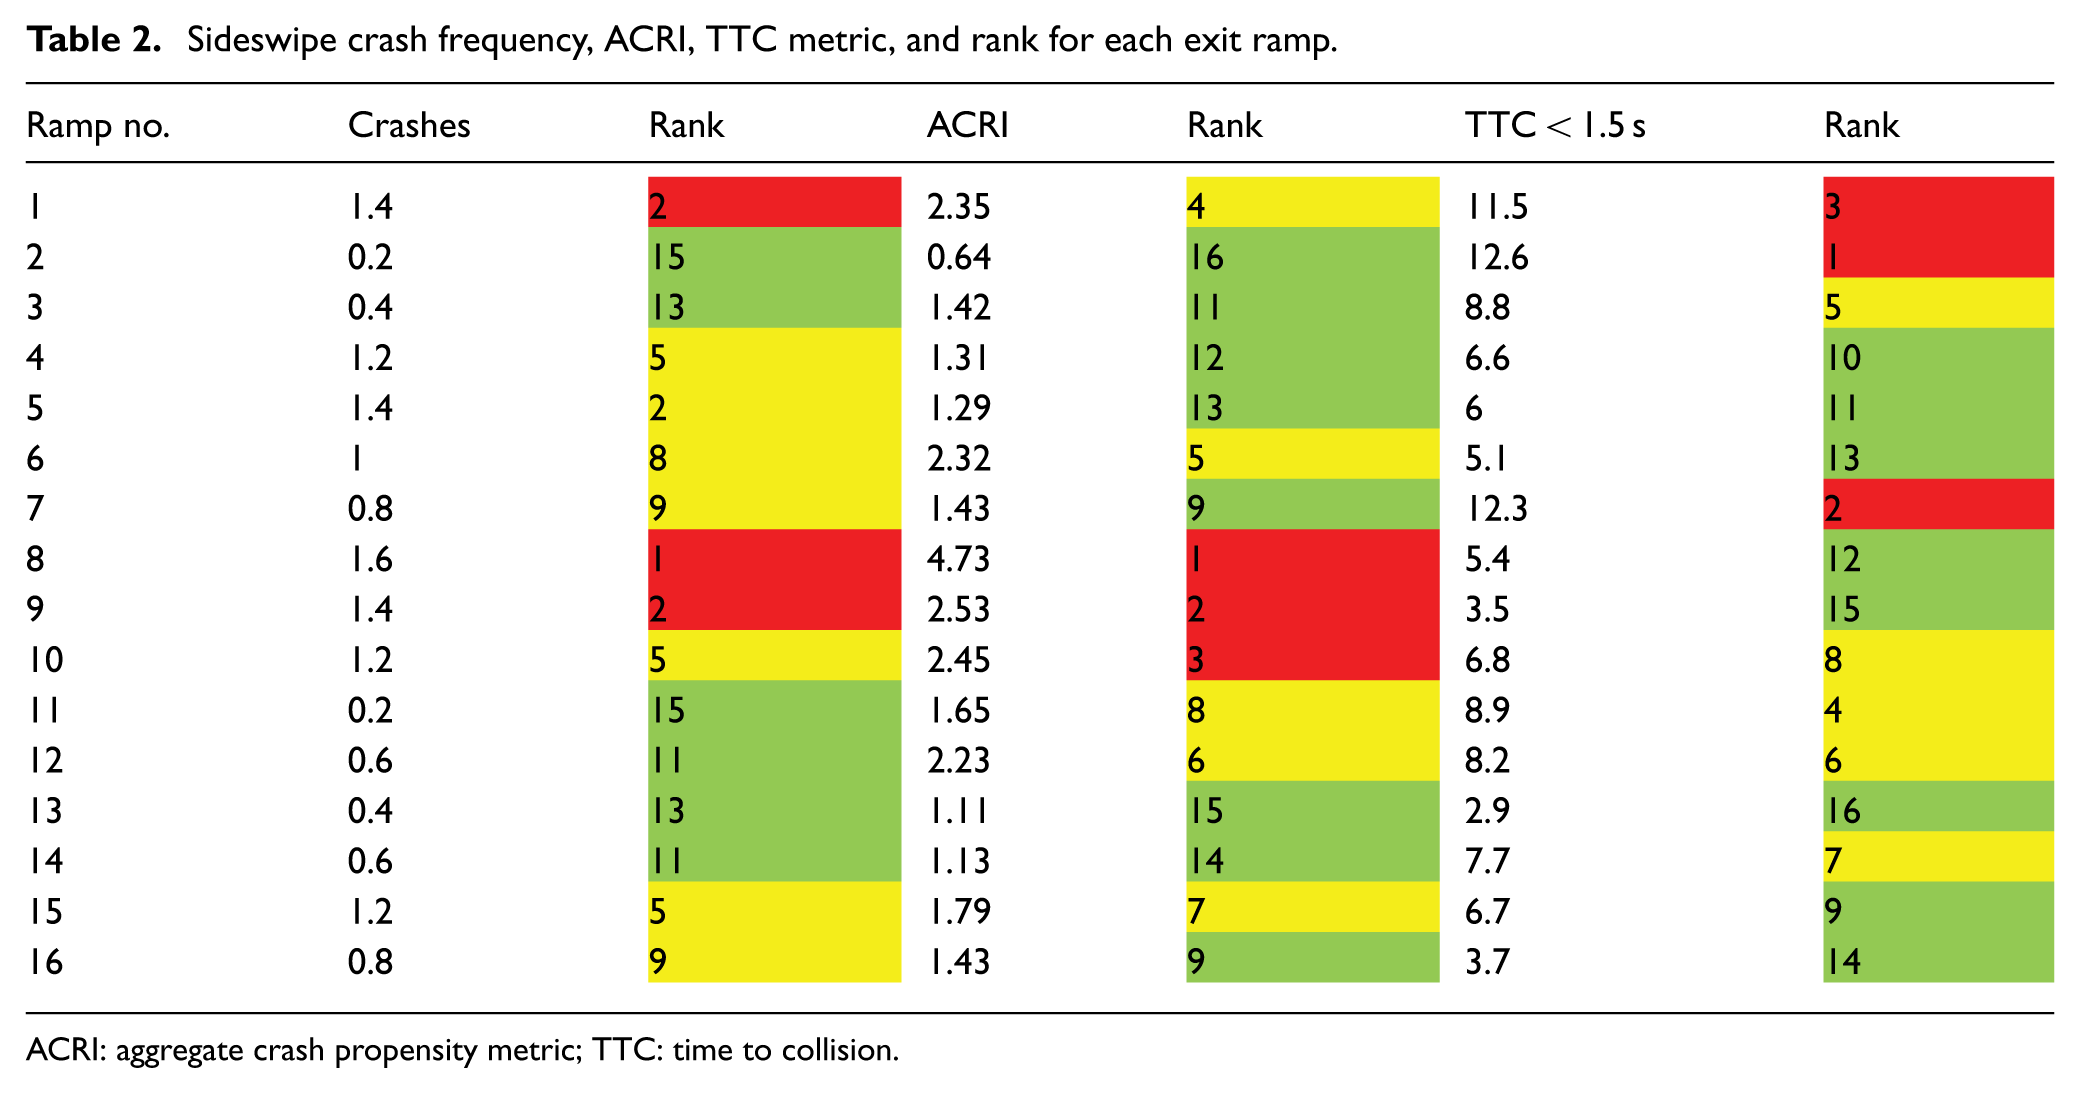
ACRI: aggregate crash propensity metric; TTC: time to collision.
Spearman rank tests were conducted to compare the rank order of ACRI and the TTC-based metric. Rank tests were applied to examine the performance of different safety indicators in the report of SSAM. 27 They are nonparametric statistical tests for examining the correlation between two noncontinuous variables. Compared with parametric methods, nonparametric tests make no assumption of probability distributions of variables being assessed. 36 According to the tests, ACRI shows considerably high rank correlation coefficient: 0.854 for lane change and 0.730 for rear end. A coefficient of 1.0 means a perfect correlation between two variables, and a score of 0 indicates no correlation. Meanwhile, rank tests were also conducted for traditional TTC metric (TTC < 1.5 s) and the Spearman rank ρs are −0.252 for lane change and 0.399 for rear-end. It can be found that the proposed conflict metric significantly outperforms the traditional TTC metric.
In general, both descriptive rank comparison and statistical tests show that ACRI is good at identifying crash-prone locations by correctly estimating relatively safety among multiple freeway exit ramps. Moreover, it largely outperforms the traditional TTC-based metric in safety rank tests.
Crash prediction tests
Different regression models were applied to fit the data, including linear, power, and exponential. To compare prediction models, leave-one-out cross validation (LOOCV) was conducted. In this case, 15 out of 16 exit ramps were randomly chosen as the reference, while the remaining 1 was used for testing. Based on the reference, regression models were developed, and predictions were estimated and compared with the testing one. This process was repeated to ensure that all 16 intersections were used for testing. Model performance was determined based on the mean square errors (MSEs). Power models were identified as the most proper models with the lowest MSE.
Figure 6 shows the rear-end crash predictions and sideswipe crash predictions based on power models. Generally, the actual crash numbers fall within the 95% confidence intervals of predictions. Thus, the prediction models show the potential to provide reasonable predictions on actual crashes. The only issue is that the data sample is limited. Thus, the power models cannot be directly used, and they are not performed here.

Rear-end and sideswipe crash predictions.
Discussion and conclusion
This study develops a conflict-based safety metric for freeway exit ramps. Since lane-change and rear-end conflicts often occur within ramp exit area, a procedure of estimating crash probability of a conflict is proposed, based on which the safety metric is derived. The procedure is able to predict two types of possible resulting crashes, namely, rear-end and sideswipe crashes, for lane-change conflicts. By conducting field validation experiments, the metric is shown its capability of quantifying conflicts while considering multiple factors including conflict characteristics, human differences, and vehicle heterogeneity.
Although the results are very encouraging, there are some issues that need to be addressed here. The first concern is that traffic simulation generates normal traffic interactions instead of near-crash conditions. Thus, simulated traffic conflicts have to be pre-screened before used for surrogate safety measure. In our experiment study, it is proved that simply using traditional conflict metric (TTC < 1.5 s) is unable to properly identify the true safety implication of freeway exit ramps. However, the proposed metric is able to adjust the severity of conflicts by applying stochastic process and thus provides a better performance. Admittedly, since some important factors may not be considered in this process (e.g. driver errors and aggressive behaviors), the proposed metric are unable to directly estimate the expected number of crashes.
Another issue is that SSAM classifies conflicts by setting up fixed thresholds. This could be sometimes problematic because those were intuitively determined. For instance, 2° was often suggested as a boundary for determining rear-end conflict and sideswipe conflict. However, there is no justification on such rule based on previous literature. Moreover, for different geometric layouts, the boundary could also vary. Thus, a fixed threshold between two conflict types may not even exit. Other selection criteria may need to be added to improve the classification of different conflict types.
Moreover, the validation experiment is only based on a limited number of ramps. Thus, although CRI/ACRI has shown encouraging results in identifying relatively safety as well as predicting traffic crashes, further studies with larger sample size are still necessary. Crash prediction models based on the proposed metric could also be developed and used as complementary tools for safety engineers.
In addition, the proposed procedure can be used for crossing conflicts, assuming both drivers would take actions. However, for ramp area, only rear-end conflicts and lane-change conflicts need to be considered. For simplicity, leading drivers were assumed to keep speeds during the process. Thus, future studies could be focusing on improving the procedure by considering the actions of both leading and following drivers. Also, the strength of the proposed metric could be examined for evaluating crossing conflicts at intersections. The proposed metric can also be compared with other surrogate safety measures in the future.
In general, the proposed conflict-based safety metric successfully identifies relative safety among a variety of freeway exit ramps and shows the potential in predicting actual crashes. Moreover, it is capable of estimating the probability of two potential crash types (i.e. rear-end and sideswipe crashes), caused by lane-change conflicts. Thus, it could be considered as a promising tool for exit-ramp safety evaluation. Using the proposed metric, the safety implication of various geometric design and speed control strategies could also be examined.
Footnotes
Academic Editor: Hai Xiang Lin
Author note
Author Tao Wang is also affiliated with School of Architecture and Transportation, Guilin University of Electronic Technology, Guilin 541004 China.
Declaration of conflicting interests
The author(s) declared no potential conflicts of interest with respect to the research, authorship, and/or publication of this article.
Funding
The author(s) disclosed receipt of the following financial support for the research, authorship, and/or publication of this article: This research was supported by national Natural Science Foundation of China (nos 51408145 and 51608114), the Key Project of National Natural Science Foundation of China (no. 51238008), and Guangxi Natural Science Foundation (no. 2014GXNSFBA118255).