
Abstract
Connected vehicles (CVs) and their supporting infrastructure are expected to play an important role in the management of traffic congestion. As highway expansion projects are becoming less common, deploying emerging technologies is essential to make the most of the current road infrastructure. Most published studies report that CVs improve traffic performance only marginally. Here, we propose that CVs drive cooperatively with cooperative adaptive cruise control (CACC)-enabled vehicles by designating a CACC lane for periods with high flows of slow-moving heavy-duty drayage trucks. To assess if this approach could help absorb year 2035 projected drayage traffic increases at the Ports of Los Angeles and Long Beach, which is the largest port complex in the U.S.A., we analyze three 2035 scenarios for I-710, a key freeway for freight transportation in Southern California: (1) CACC-enabled vehicles are deployed under mixed traffic conditions; (2) CACC-enabled vehicles are restricted to the first lane (left-most lane); (3) the first lane is reserved for CACC-enabled vehicles, and access is optional. Our results suggest that substantial speed improvements can be obtained, but only when the first lane is CACC reserved with optional access, because this approach creates more platooning opportunities and thus helps maximize the benefits of CACC.
Keywords
The advent of vehicle connectivity in transportation promises to improve road safety, mitigate congestion, and create opportunities to manage traffic more efficiently as communication technology enables real-time freeway traffic management. One of the possible applications of traffic management is managed lanes ( 1 – 8 ). Variable lane eligibility based on known demand (i.e., when the vehicle position and classification are recorded in a connected environment) can potentially support the deployment of connected and autonomous vehicles (CAVs), even at a low market penetration. More specifically, lane management could support the deployment of vehicles equipped with cooperative adaptive cruise control (CACC) (Society of Automotive Engineers (SAE) Level 1) to enhance safety, add capacity, and improve performance by coordinating their deployment on dedicated lanes during selected periods.
While the deployment of CAVs is typically impeded by infrastructure and technology requirements, Level 1 CAVs could be deployed without major infrastructure changes ( 9 ). Some of the technologies that can support lane management or CACC-equipped vehicles driving on dedicated lanes for selected periods include the following: (1) variable-message signs, which can support variable lane eligibility during early deployment stages; (2) cellular vehicle-to-everything (C-V2X) communication (i.e., communication with other vehicles, infrastructure, pedestrians, and the cloud, enabled by third-generation partnership project [3GPP] frequency bands); and (3) contactless in-lane charging, which may be convenient for zero-emission (ZE) CACC-equipped trucks operating on dedicated lanes ( 9 – 11 ).
Combining these technologies is attractive for Southern California freeways, which are increasingly congested as the regional population and the economy continue to grow ( 12 ). This is particularly the case for I-710, which connects the country’s largest port complex (the San Pedro Bay Ports, or SPBP, i.e., the Ports of Los Angeles and Long Beach) with regional warehouses and logistics centers. Caltrans, Gateway Cities, community organizations, and environmental justice activists have clashed for years over how to manage increasing freight traffic on I-710 and the resulting air pollution, congestion, and accidents ( 13 – 16 ). However, to the best of our knowledge, little research has been done on the systemwide impacts of deploying CACC-enabled vehicles jointly with lane management, particularly in Southern California. This paper aims to start filling this gap.
Performance improvements and deployment strategies for managed lanes have received much attention ( 1 , 2 , 5 , 6 , 8 ). The implementation of managed lanes as a strategy for connectivity deployment has been more limited; however, some studies have analyzed the impacts of managed lanes under a connected environment with different objectives, such as tolling, safety, and lane-changing behavior ( 3 , 4 , 17 ).
Our main objective here is to realistically simulate the systemwide impacts of deploying CACC-enabled vehicles jointly with lane management to explore if this approach could absorb the 2035 projected growth in cargo demand on I-710 and other freeways connecting the SPBP complex to the Inland Empire (the Southern California metropolitan area centered around the cities of San Bernardino and Riverside, east of Los Angeles County), which houses large warehouse complexes. We focused on I-710 to implement lane management with an emphasis on drayage trucks (i.e., trucks that transport containers to and from the SPBP) because of the critical role of I-710 in regional freight movements. Figure 1 shows our simulation network and the segments on which we tested lane management strategies. We considered three scenarios for 2035, including a baseline scenario where we deployed CACC-enabled vehicles under mixed traffic conditions. Performance indicators such as travel time and average speed by vehicle class shed some light on the potential importance of connectivity and automation in road infrastructure planning and the deployment of CAVs. To the best of our knowledge, our regional network, which spans most of the South Coast Air Basin, is one of the largest microscopic simulation networks in the transportation engineering literature. While we only implemented lane management strategies on I-710, we used a regional network to estimate potential traffic spillage onto surrounding freeways.
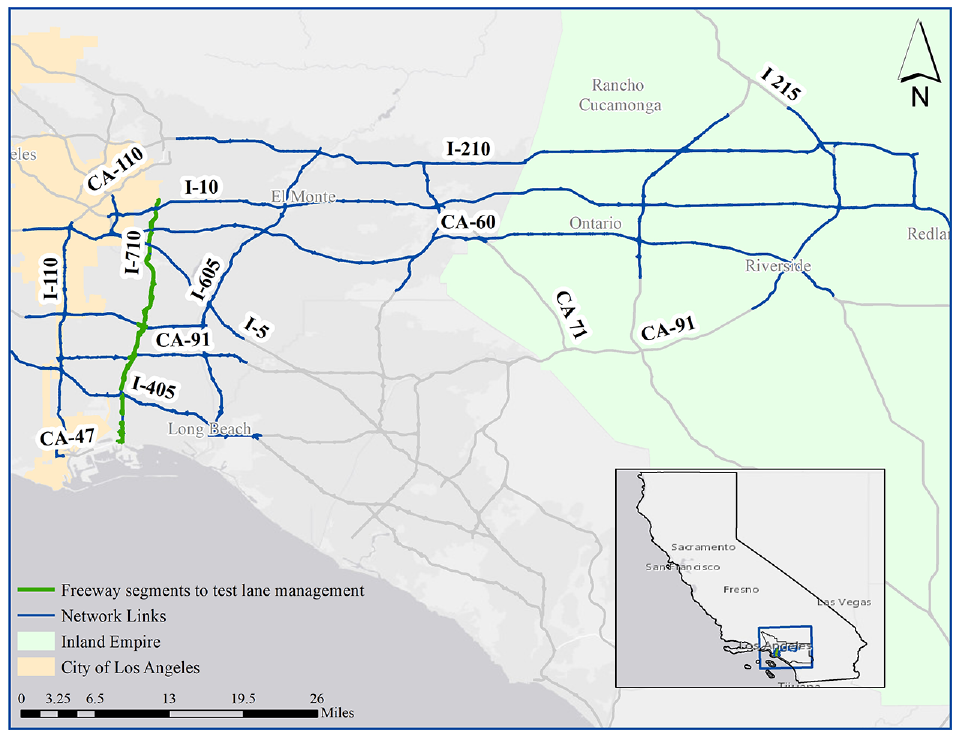
Study area.
In the second section, we review background information and select papers relevant to our analysis. The third section presents our study area, briefly discusses our demand data, introduces our methodology, and presents our scenarios. In the fourth section, we summarize our results before concluding in the fifth section.
Background and Literature Review
Some Key Definitions
The Society of Automotive Engineers ( 18 ) classifies automated vehicles using a scale that ranges from level 0 (no automation) to level 5 (full automation, where onboard systems perform all driving functions under all conditions). The focus of this study is on port heavy-duty drayage trucks (HDDTs) connected via CACC, that is, trucks whose longitudinal motion, braking, and acceleration are controlled by onboard systems when their driving is synchronized with a leading CACC-enabled HDDT using short-range wireless communication (a C-V2X technology); a human driver handles all other driving tasks. While CACC-enabled trucks travel in a string by maintaining a constant time gap (CTG), they can be distinguished from vehicles traveling in a platoon, where consecutive vehicles strive to maintain a fixed distance gap ( 19 ). CACC-enabled vehicle strings are formed by opportunity, as vehicles equipped with CACC or other radio access communications could cluster together based on their location ( 9 ). Alternatives to short-range radio signals include establishing communication between vehicles using other devices, the surrounding infrastructure, or the internet ( 9 ). By taking advantage of the widespread deployment of long-term evolution (LTE) cellular technology, C-V2X technology offers a roadmap for the deployment of connected vehicles (CVs). By communicating with the network (vehicle-to-network [V2N]), transportation authorities could broadcast safety and traffic conditions and manage traffic in real-time ( 10 ).
Expected Benefits and Challenges of CACC-Enabled Vehicles
A fully connected transportation system is expected to substantially enhance the safety of U.S. roads and thus decrease the external costs of using motor vehicles, which reached US$242 billion or 1.6% of the U.S. gross domestic product in 2010 (US$836 billion if the value of the quality of life is included) from fatalities, injuries, and damages to vehicles. Approximately 12% of this cost corresponds to congestion, which accounts for travel delays, added fuel usage, and adverse environmental impacts ( 20 ).
By organizing trucks in platoons, connected and automated technologies promise fuel efficiency improvements, a potential benefit that has already been widely analyzed ( 21 – 25 ). Moreover, engine propulsion changes and aerodynamic drag reductions could help reduce carbon emissions. A third motivation for introducing CAVs is congestion relief, which is our main focus here. Congestion reduction requires enough CACC-enabled vehicles and the formation of stable platoons ( 26 ).
The feasibility and the potential safety and fuel efficiency benefits of CACC-enabled vehicles have already received much attention ( 27 – 30 ). Several studies have also relied on simulation to assess how the characteristics of various control systems for trucks could affect vehicle interactions, traffic flow, and traffic management ( 30 – 35 ), but to our knowledge, these are almost exclusively modeled as one-directional stretches and during relatively short periods (1–3 h). While these studies had different objectives, their results suggest that connected truck technologies will likely positively affect traffic flow. However, the magnitude of this impact depends on market penetration and how platooning is implemented. For example, excessive platoon size and intensity could block merging and diverging areas, cause unnecessary lane changes, or result in other vehicles missing off-ramps.
While several technical, societal, and institutional challenges of autonomous vehicles are still unresolved ( 36 – 42 ), particularly for establishing liabilities ( 43 – 45 ), the deployment of CACC-enabled vehicles, which only utilize the lowest level of autonomy and require a human driver on board, is mostly bounded by the infrastructure requirements needed to maximize their benefits.
Lane Management Opportunities
While performance improvements and optimal strategies for managed lanes have received much attention ( 1 , 2 , 5 , 6 , 8 ), inquiries into systemwide operational improvements associated with the implementation of managed lanes in a connected environment have been more limited. Some studies have analyzed managed lanes under a connected environment to understand their impact on tolling, safety, and lane-changing behavior ( 3 , 4 , 17 ). Furthermore, Abdel-Aty et al. ( 7 ) built a 3-hour microscopic simulation model to test how deploying CVs under different lane management strategies could improve safety on a Florida freeway stretch. However, their focus was on safety improvements ( 7 ). To the best of our knowledge, little research has been conducted on systemwide performance improvements resulting from their adoption to support the deployment of CACC-enabled vehicles, which is a key contribution of this paper.
Data and Methods
To set a traffic baseline, we calibrated a regional microscopic simulation model with projected freeway traffic conditions in 2035. We selected 2035 because it has been used to forecast the region’s cargo growth ( 46 – 48 ), and we focus here on understanding the role of CACC-enabled vehicles and managed lanes in absorbing the 2035 projected cargo growth from the SPBP. We then defined a set of driver behavior, lane eligibility, and vehicle classification parameters in our model to study the operational impact of CACC-enabled vehicles driving under mixed and restricted traffic conditions for different lane management strategies. We evaluated performance based on speed improvements, vehicle hours saved, and overall system speed.
Regional Transportation Model
We selected microscopic traffic simulation to capture the complex vehicle interaction created by a mixed fleet of vehicles driving under different levels of automation and a connected environment. We relied on TransModeler because it seamlessly transitions origin–destination (OD) demand data from TransCAD, works with geographic information system (GIS) data, enables the simulation of CACC with a CTG car-following model, and allows performing dynamic traffic assignment (DTA) relatively easily.
Study Area Network and Demand Data
Our study area (see Figure 1) includes parts of 13 freeways in the Southern California Association of Governments (SCAG) region. We selected these 13 freeways because they have the highest container truck traffic based on sensor data from the Truck Activity Monitoring System ( 49 ). Using data from a representative month (July 2017), we identified Interstate 710 (I-710), State Route 60 (SR 60), I-110, I-10, I-605, I-210, SR 57, and I-5 as the busiest in the region for heavy-duty traffic. We completed our network by including intersecting freeways.
We obtained data on freeway configuration, sensors, and ramp meters from Caltrans and coded them into TransModeler. Freeway geometry and the location of healthy loop detectors come from Caltrans’ Performance Measurement System (PeMS) data, and the location of ramp meters is from Caltrans’ 2017 Ramp Metering Development Plan, which includes a list of all operational ramp meters in California. We performed geometry validation with Google imagery. We programmed ramp meters with global parameters. Since operation data are unavailable, we assumed that a ramp meter releases two vehicles per 4-s cycle ( 50 ).
We obtained our initial 2012 OD data for 24 h from SCAG. We performed a sub-area analysis using TransCAD to extract OD data for the freeways in our study area before breaking down the output of this sub-area analysis, time-period (AM, MD, PM, EVE, and NT) OD matrices, into 15-min intervals by applying the distribution of individual freeways by direction using loop detector data from Caltrans PeMS as an initial guess for OD estimation. We then calibrated the 15-min demand using incremental DTA and PeMS data for a representative day in 2012. Calibration was evaluated using the Geoffrey E. Havers (GEH) statistic criteria against road sensor data and found a good match for ∼60% of detectors. Validation results and additional details about the calibration process are reported by Remirez-Ibarra and Saphores ( 51 ).
Further, given the size of our network and its computational times, we address the stochasticity of simulation by using DTA outputs as inputs for individual simulation runs. DTA outputs are historical segment travel times and turning delays. By using historical travel times as inputs, the speed variation between successive simulation runs is less than 1%.
Our 2012 calibrated and validated demand data against real-life traffic flows served as a baseline for current traffic conditions and for applying growth factors based on regional cargo growth forecasts.
Demand for 2035 was adjusted based on the cargo growth forecast, which predicts a 145% growth in container traffic at the ports. The number of 20-foot equivalent units (TEUs) processed at the SPBP in 2012 was 14.1 million ( 52 ). We relied on a SCAG report ( 48 ) (Table 4.6, pp. 4–19) to obtain a partition of this cargo into on-dock (container yards located inside the ports), off-dock (container yards located outside the ports), and trucks. By 2035, cargo at the SPBP is forecasted to increase to 34.5 million TEUs ( 47 ). SCAG estimates that 10.2 million TEUs (29.7%) of this volume will be handled by port terminals (on-dock), while 24.3 million TEUs (70.3%) will leave the ports by truck to be later transloaded at nearby off-dock rail yards (16.2 million TEUs) or handled exclusively by truck (8.1 million TEUs). We note that historical forecasts have overestimated SPBP container traffic growth ( 53 ), but recognize the complexity of forecasting container traffic because it depends on U.S. trade policies, global economic growth, local infrastructure, and ship technology improvements. We adopted these forecasts to represent a worst-case scenario (upper bound) for 2035.
To capture this projected demand, we implemented OD matrix changes for HDDT demand using two growth demand factors for 2035. Firstly, we applied 140% growth to trips with origins or destinations at Burlington Northern Santa Fe (BNSF) or Union Pacific Railroad railyards within our study area ( 54 ). Secondly, we applied a 101% growth to the remaining HDDT trips to represent the share of containers moved exclusively by truck. As a result, the number of truck trips needed to serve the SPBP went from 48,000 in 2012 to 97,000 in 2035. We applied different growth factors to rail and non-rail based on the SCAG data ( 40 ; Table 4.6) to project the share of on-dock and off-dock cargo handled at the SPBP complex by 2035.
We kept the demand for all other vehicle classes unchanged based on the assumption that SCAG’s efforts to reduce vehicle miles traveled (VMT; e.g., by promoting alternative modes of transportation and access to services through emerging technologies) would be successful by 2035 ( 55 ).
Modeling Connected and Autonomous Trucks
Based on SCAG demand data, we defined six vehicle classes to represent all vehicles in our network, lane eligibility, and vehicle attributes for simulation: light-duty vehicle (LDV; CACC-enabled and conventional LDV), light-duty truck (LDT), medium-duty truck (MDT), SPBP heavy-duty truck (HDT; i.e., HDDT), and non-SPBP HDT. SPBP HDDTs are HDDTs that serve the SPBP, identified by starting or ending a trip at the ports, and non-SPBP HDTs are all other HDTs. This enabled us to model different technology deployment scenarios for HDDT and LDV trips.
In TransModeler, the acceleration of individual vehicles is governed by their mass-to-power ratio (MPR) and a car-following model. The National Cooperative Highway Research Program (NCHRP) reports the distribution of MPRs on California freeways of MPRs. It shows 198 lb/Hp as the 90th percentile of the MPR ( 56 ).
For simulating CACC-enabled vehicles, we relied on the CTG model, which provides longitudinal control of vehicles in a “string,” keeping the time headway between vehicles approximately constant according to Caliper’s built-in CTG car-following model. However, vehicle pairing and clustering are based on opportunity. CACC-enabled vehicles of the same class pair whenever they encountered each other. However, TransModeler does not currently allow tracking vehicle pairing and communication ( 19 , 57 ).
For the latter, we used the implementation in TransModeler of the CTG car-following model ( 58 ), which seeks to maintain a CTG, h, between two consecutive CVs. For our purposes, we adopted a value of 0.6 s for h. This value was selected based on our literature review and a sensitivity analysis in which the value for the constant time headway varied between values as small as 0.3 and 0.9 s ( 59 ). As expected, speed improvements were greater at smaller time gaps, and speed decreases were observed at longer time gaps. In the CTG model (1):

where the spacing error (2) is estimated by the following:

In the equations above, Ai(t) is the acceleration of vehicle i at time t; h is the desired following time gap (s); Vi(t) is the speed of vehicle i at time t;
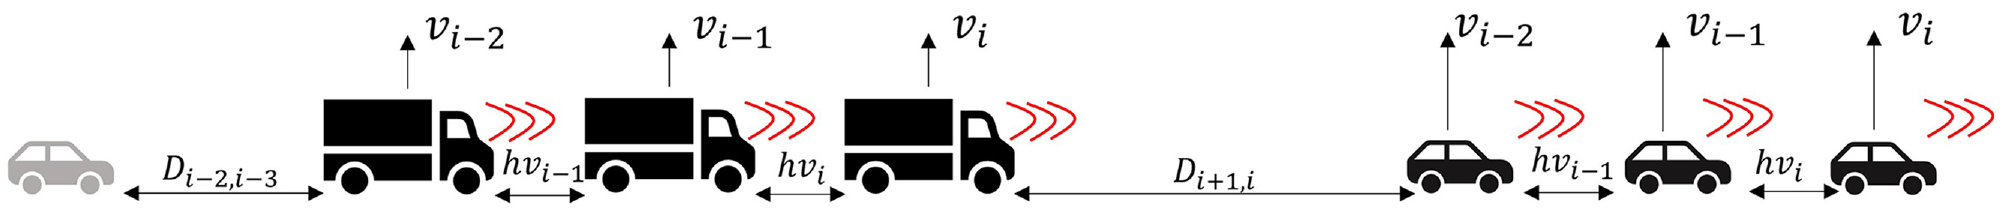
Longitudinal control of cooperative adaptive cruise control (CACC)-enabled vehicles.
The leading vehicle in a string and most of the vehicles on the network follow the Modified General Motors Car Following Model ( 57 , 60 ), for which a driver’s acceleration is broken down into three regimes: emergency, car following, and free flow.
The emergency regime only applies when a vehicle tries to avoid a collision because it has fallen below a predetermined headway threshold. Emergency deceleration then applies unless other factors require a stronger response (e.g., maximum deceleration). If the headway is above the predefined upper bound threshold, or if there is no lead vehicle, the free flow model applies, and the normal acceleration rate applies. Otherwise, if the headway falls between the lower and upper bound thresholds (i.e., the lead vehicle is not close enough to justify emergency braking and not far enough for normal acceleration rates to apply), the car-following regime applies. The lower and upper bound thresholds are 0.3 and 1.5 s, respectively.
I-710 HDDT Flows
To test the effects of lane management in a connected environment, we analyzed the patterns of HDDT traffic on I-710. We processed I-710 trajectories outside TransModeler using Python to determine lane eligibility criteria for each segment and every 15 min considered. For testing, we focused on a segment of I-710. We considered three 2035 scenarios (defined below), including a baseline where CACC-enabled vehicles drive under mixed traffic conditions and two lane management scenarios.
Standard hours of operation at the Port of Long Beach are 07:00–17:00 and 19:00–04:00. Standard hours of operation at the Port of Los Angeles are similar, with one additional hour in the a.m. shift. Trucks account for 10%–15% of northbound (NB) traffic and 4%–6% of southbound (SB) traffic during most of the day. As expected, the flow of HDDT is higher during peak periods. As shown in Figure 3, the highest HDDT flows occur between 09:00 and 18:00.
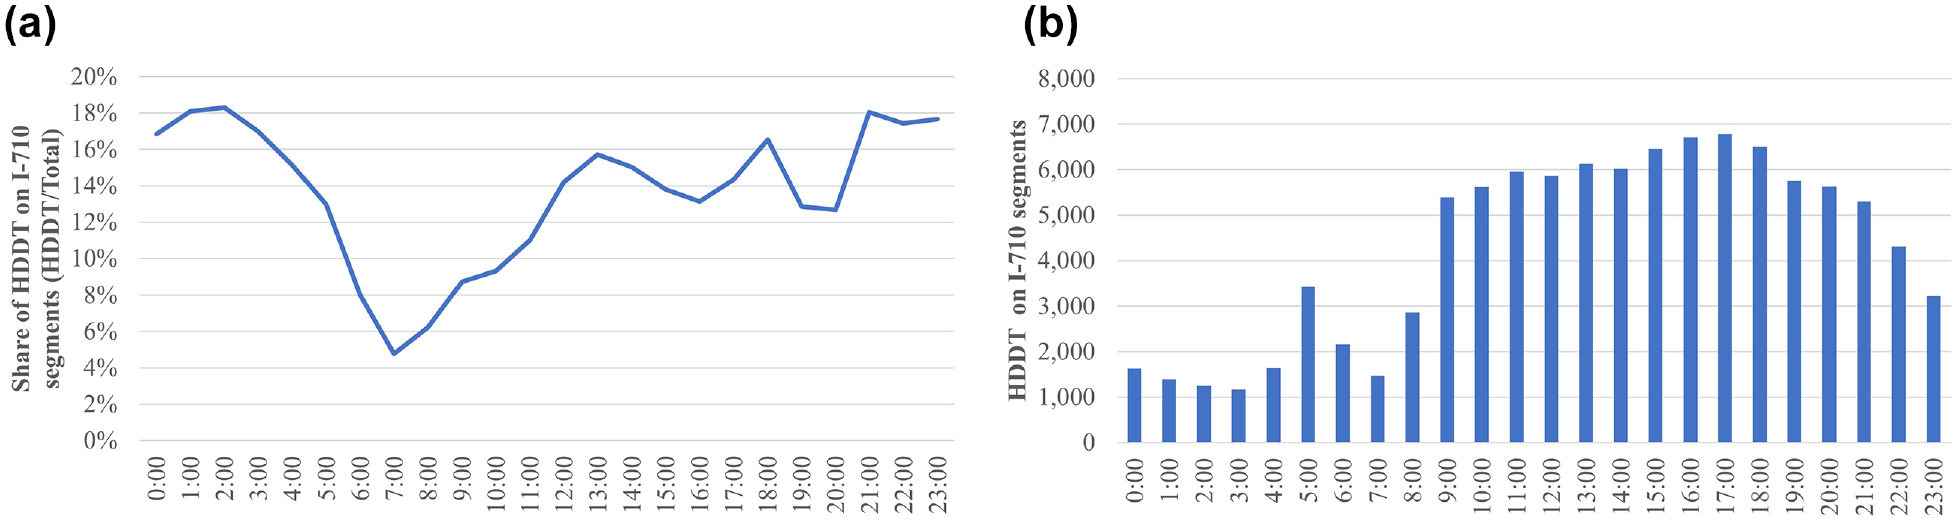
I-710 heavy-duty truck share and flow over all segments: (a) share of heavy-duty drayage trucks (HDDTs) over all I-710 segments and (b) number of HDDTs over all I-710 segments.
Scenarios
After calibrating and validating our network with our demand data against observed 2012 traffic conditions and after applying growth factors to capture 2035 cargo growth forecasts for the region, we implemented three 2035 scenarios for deploying CACC-enabled vehicles (see Figure 4).
A. Baseline scenario: We restricted HDDTs to the two outer freeway lanes (lanes 3 and 4 in Figure 4) as per California regulations and deployed CACC-enabled vehicles under mixed traffic conditions.
B. Dedicated first lane scenario (restricted access): We reserved the first lane (left-most lane) for CACC-enabled vehicles and restricted CACC vehicles from using any other lane except for access and egress.
C. Dedicated first lane scenario (optional access): We reserved the first lane (left-most lane) for CACC-enabled vehicles but allowed CACC vehicles to use any other lane (the first lane is like a high-occupancy vehicle [HOV] lane for CACC-enabled vehicles).
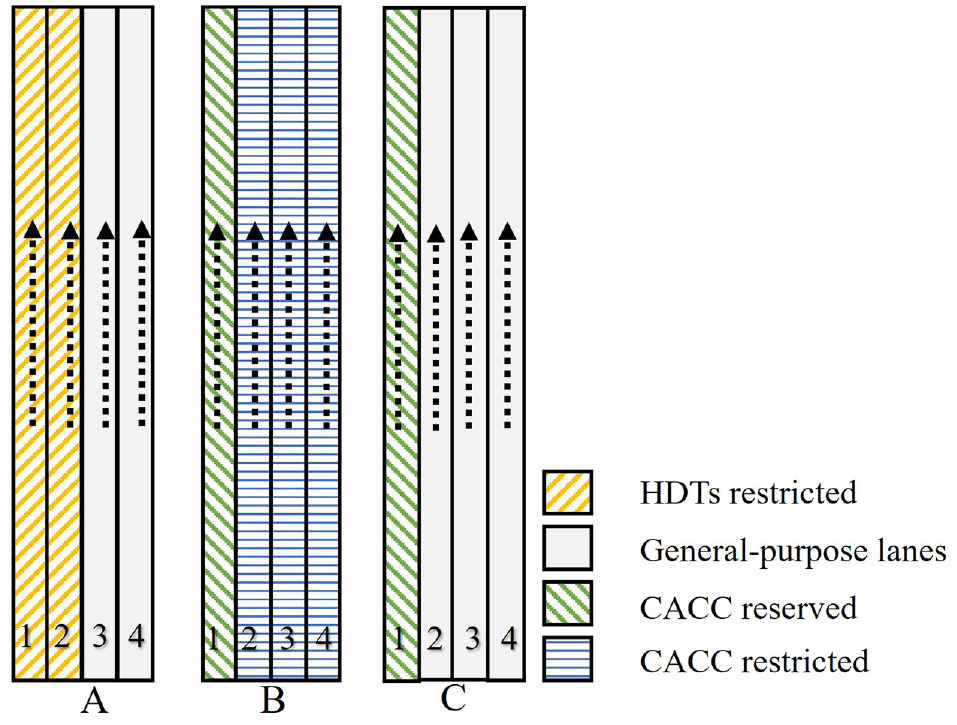
ADM scenario lane configuration.
To select time intervals to test lane management, we analyzed the number of HDDTs on I-710 to identify the periods with the most slow-moving trucks. Based on the distributions of HDDTs over the 24 h of our simulations, we decided to apply lane management strategies (NB and SB) between 09:00 and 18:00. We also tested some lane management strategies on conventional peak periods, but ultimately decided to present only the results for the 9 h of highest HDDT traffic as this was likely to generate the most significant speed improvements. In practice, a strategy like the one presented here, applied to only HDDTs, is likely to be introduced during peak periods to maximize the expected benefits and mitigate the negative effects of slow-moving trucks.
We applied lane restrictions as reserved and restricted access by vehicle categories in TransModeler.
Data Processing
The output from a 24-h simulation for one of our scenarios requires ∼180 GB. We processed it to estimate performance metrics by facility type at the link level. Firstly, we split vehicle trajectories into 15-min bins by vehicle class and estimated average speed by dividing VMT by vehicle hours traveled (VHT). Secondly, we calculated networkwide trip statistics, such as changes in average speed and travel time savings. We also applied this approach to each direction of I-710.
Results
We ran 24-h simulations to test the above scenarios for the 9 h of highest HDDT traffic, from 09:00 to 18:00 (9 a.m. to 6 p.m.). We tested speed improvements when HDDTs and a varying percentage (from 0% to 50%) of passenger vehicles were CACC enabled. Some networkwide statistics are presented in Tables A1 and A2. Selected results are discussed below, with particular attention to I-710 since this is where we implemented lane management strategies. Before proceeding, it is instructive to explore how traffic conditions could change between 2012 and 2035 before the introduction of CACC and managed lanes. Networkwide, changes in average speed are of the order of a couple of mph (results are omitted for brevity), but they are much larger for HDDTs, as shown in Figure 5a, because HDDTs are restricted to using the two right-most lanes. Speed is particularly affected on I-710 (see Figure 5, b and c ) because it carries the largest percentage of HDDTs on our network.
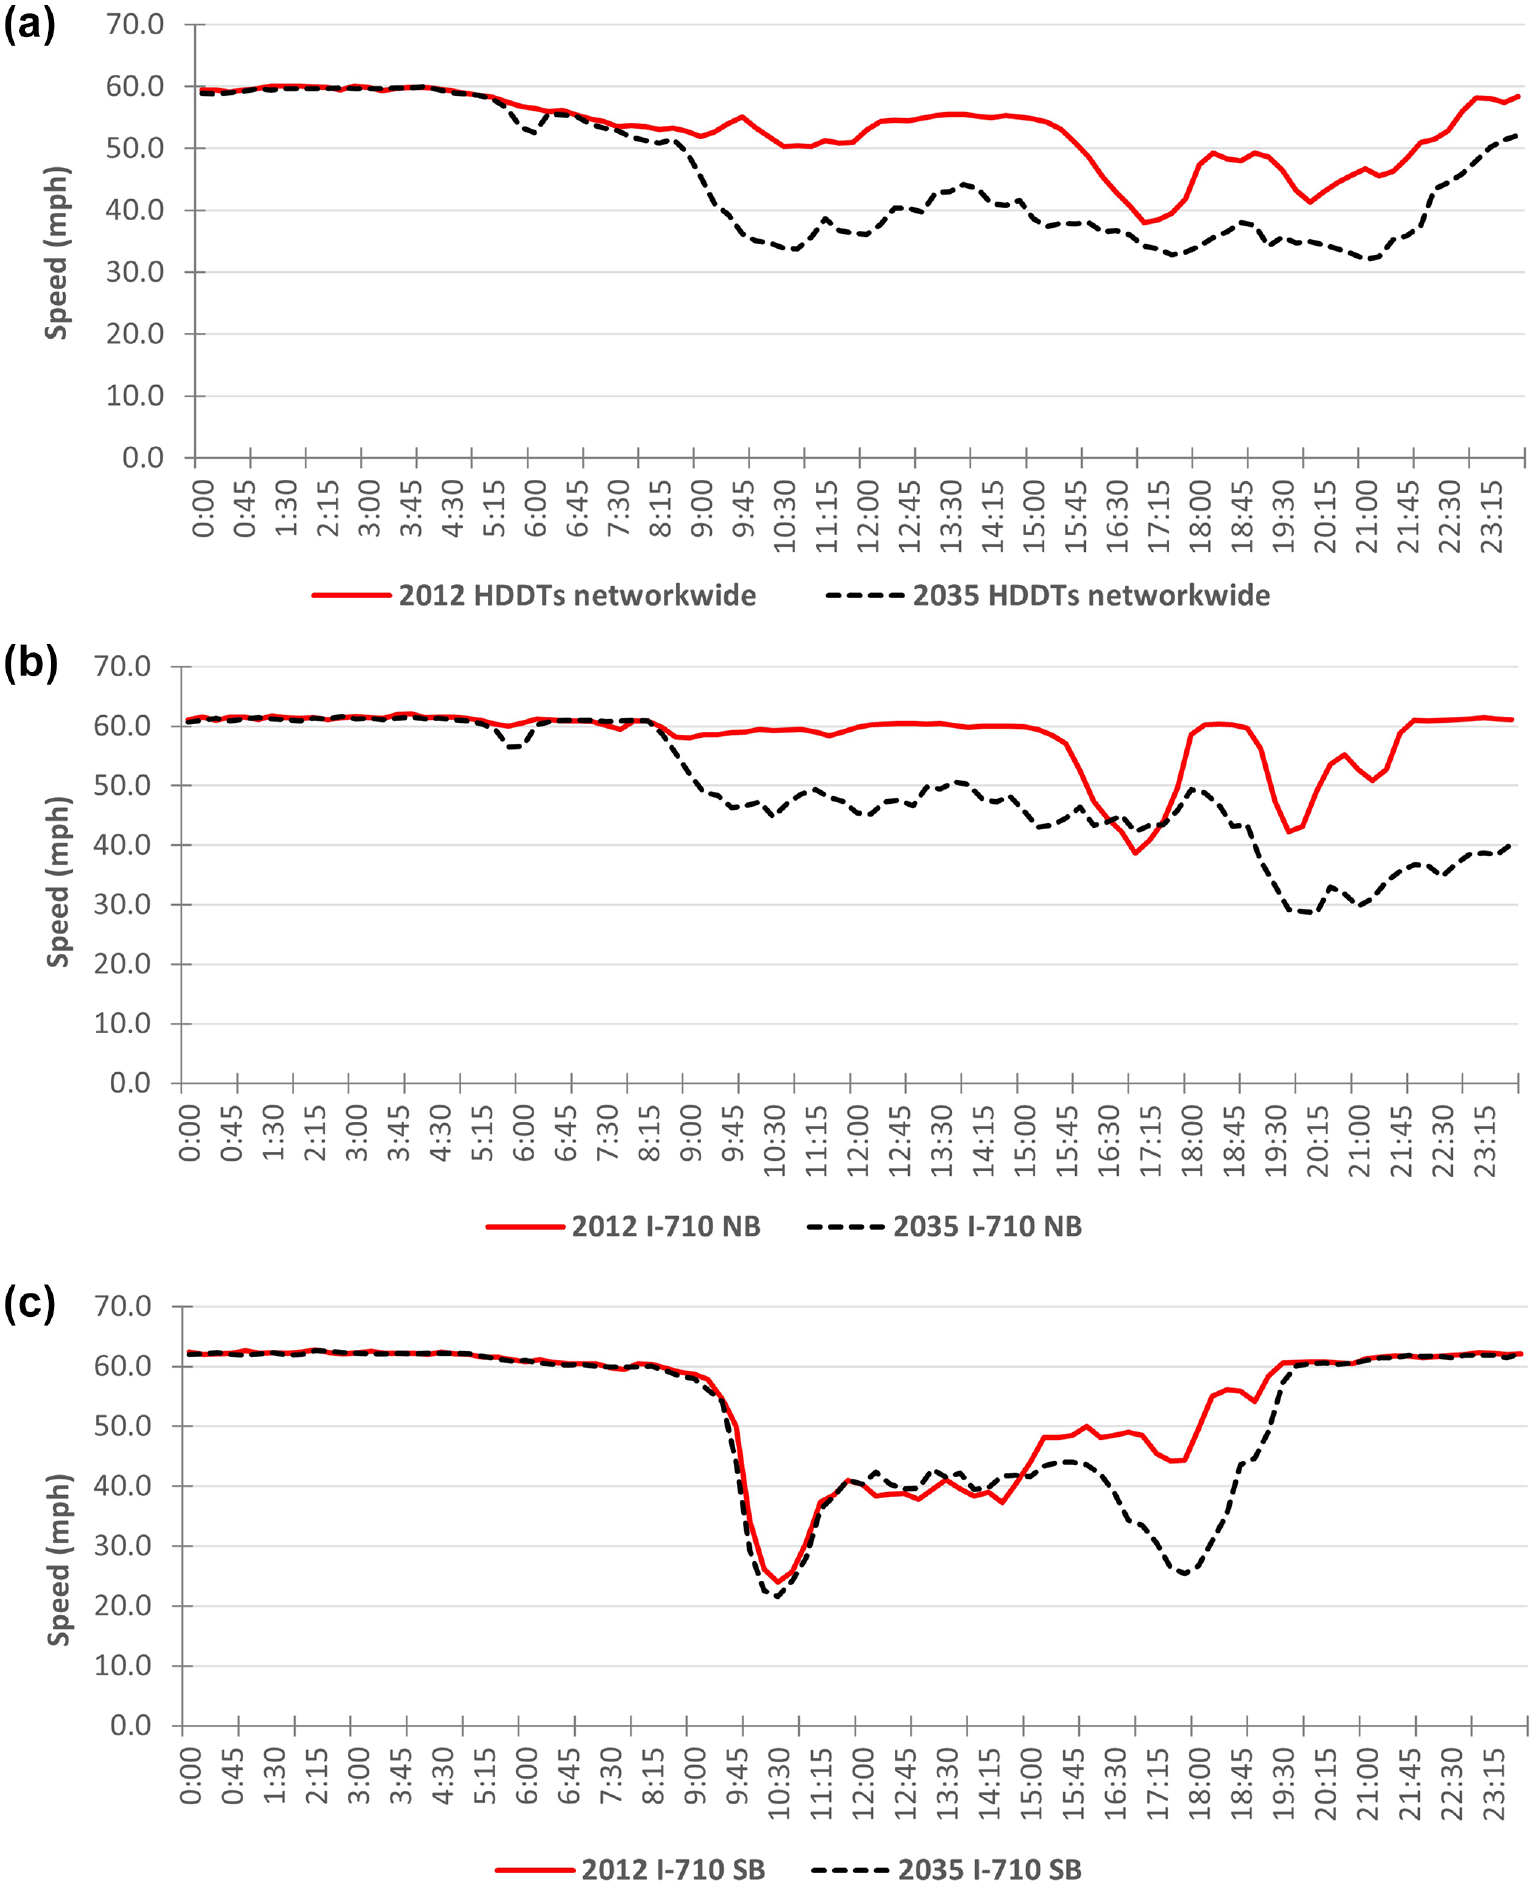
Speed changes between 2012 and 2035 without managed lanes or cooperative adaptive cruise control: (a) heavy-duty drayage truck (HDDT) average network speed (15-min periods), (b) I-710 all vehicle average northbound speed (15-min periods), and (c) I-710 all vehicle average southbound speed (15-min periods).
CACC Performance Improvements
Networkwide Improvements
Let us start with managed lane scenarios where only HDDTs are CACC enabled. Here we compare lane management scenarios (Scenarios B and C) to the baseline where CACC vehicles are deployed under mixed traffic (Scenario A). From Table A1, overall speed decreases by 6.9% when we restrict CACC HDDTs to the first lane (left-most lane) (Scenario B). Still, it does not change much when we restrict the first lane to CACC HDDTs with optional access (Scenario C), increasing only by ∼1% compared to the mixed traffic baseline.
Table A2 shows networkwide results when HDDTs and 10%–50% of LDVs are CACC enabled. To assess the effect of an increasing percentage of CACC-enabled LDVs, we compare the inner lane with optional access scenario (Scenario C) to the baseline where CACC-enabled vehicles are deployed under mixed traffic conditions (Scenario A). The results are similar; we observe only marginal speed improvements (∼1%–3%) for all vehicles. Speed improvements associated with the dedicated lane are highest when the share of CACC-enabled LDVs is between 20% and 30%. Lastly, it is important to clarify that speeds are higher across the board for Scenario C with 50% of CACC-enabled LDVs, highlighting CACC improvements. However, this paper aims to quantify the benefits of a dedicated CACC lane.
Our results suggest that lane management strategies do not significantly improve traffic conditions despite the deployment of a significant number of CACC-enabled vehicles, which contradicts expectations in the San Diego Association of Governments’ (SANDAG’s) regional plans of how to accommodate traffic congestion in the future. SANDAG’s 2021 Regional Plan incorporates managed lanes and active demand management as part of their vision for Complete Corridors, which would incorporate vehicle connectivity to manage traffic more effectively to reduce traffic congestion ( 61 ).
Given the size of our network and since we implemented lane management scenarios only on I-710, we further explored I-710 speed improvements for all vehicles and CACC-enabled vehicles separately to assess their ability to accommodate the expected HDDT demand increase in 2035. While the implementation of lane management does not appear to have a significant impact on overall network performance, HDDT vehicle hours saved for the best-case scenario are significant (i.e., up to a 21% decrease in VHT by HDDTs) when we reserve the first lane for CACC vehicles with optional access. These results suggest that lane management could potentially support the projected cargo growth for 2035.
I-710 Speed Improvements
Let us now examine local speed improvements after implementing lane management strategies, focusing on temporal speed changes on I-710 for the scenario with the best results based on networkwide results. Scenario C, where the first lane with optional access is reserved for CACC-enabled vehicles, is the only scenario contributing to speed improvements when only HDDTs are CACC enabled.
We tested the impact on speed improvements of different percentages of passenger vehicles that are CACC enabled in addition to all HDDTs. We considered 0%, 10%, 20%, 30%, 40%, and 50% of passenger vehicles with connectivity capabilities using the best-case scenario based on our previous analysis (inner lane reserved with optional access during the 9 h of highest HDDT traffic).
Figures 6–9 show the impact on I-710 speeds of all vehicles when all HDDTs and a variable percentage of LDVs (passenger vehicles) are CACC enabled. They contrast Scenario C, where lane 1 is reserved for CACC vehicles, and access is optional, with Scenario A, our baseline, where all CACC HDDTs and passenger vehicles drive under mixed traffic conditions. Since we started our simulations with an empty network, traffic conditions during the first hour are not representative of real traffic conditions.
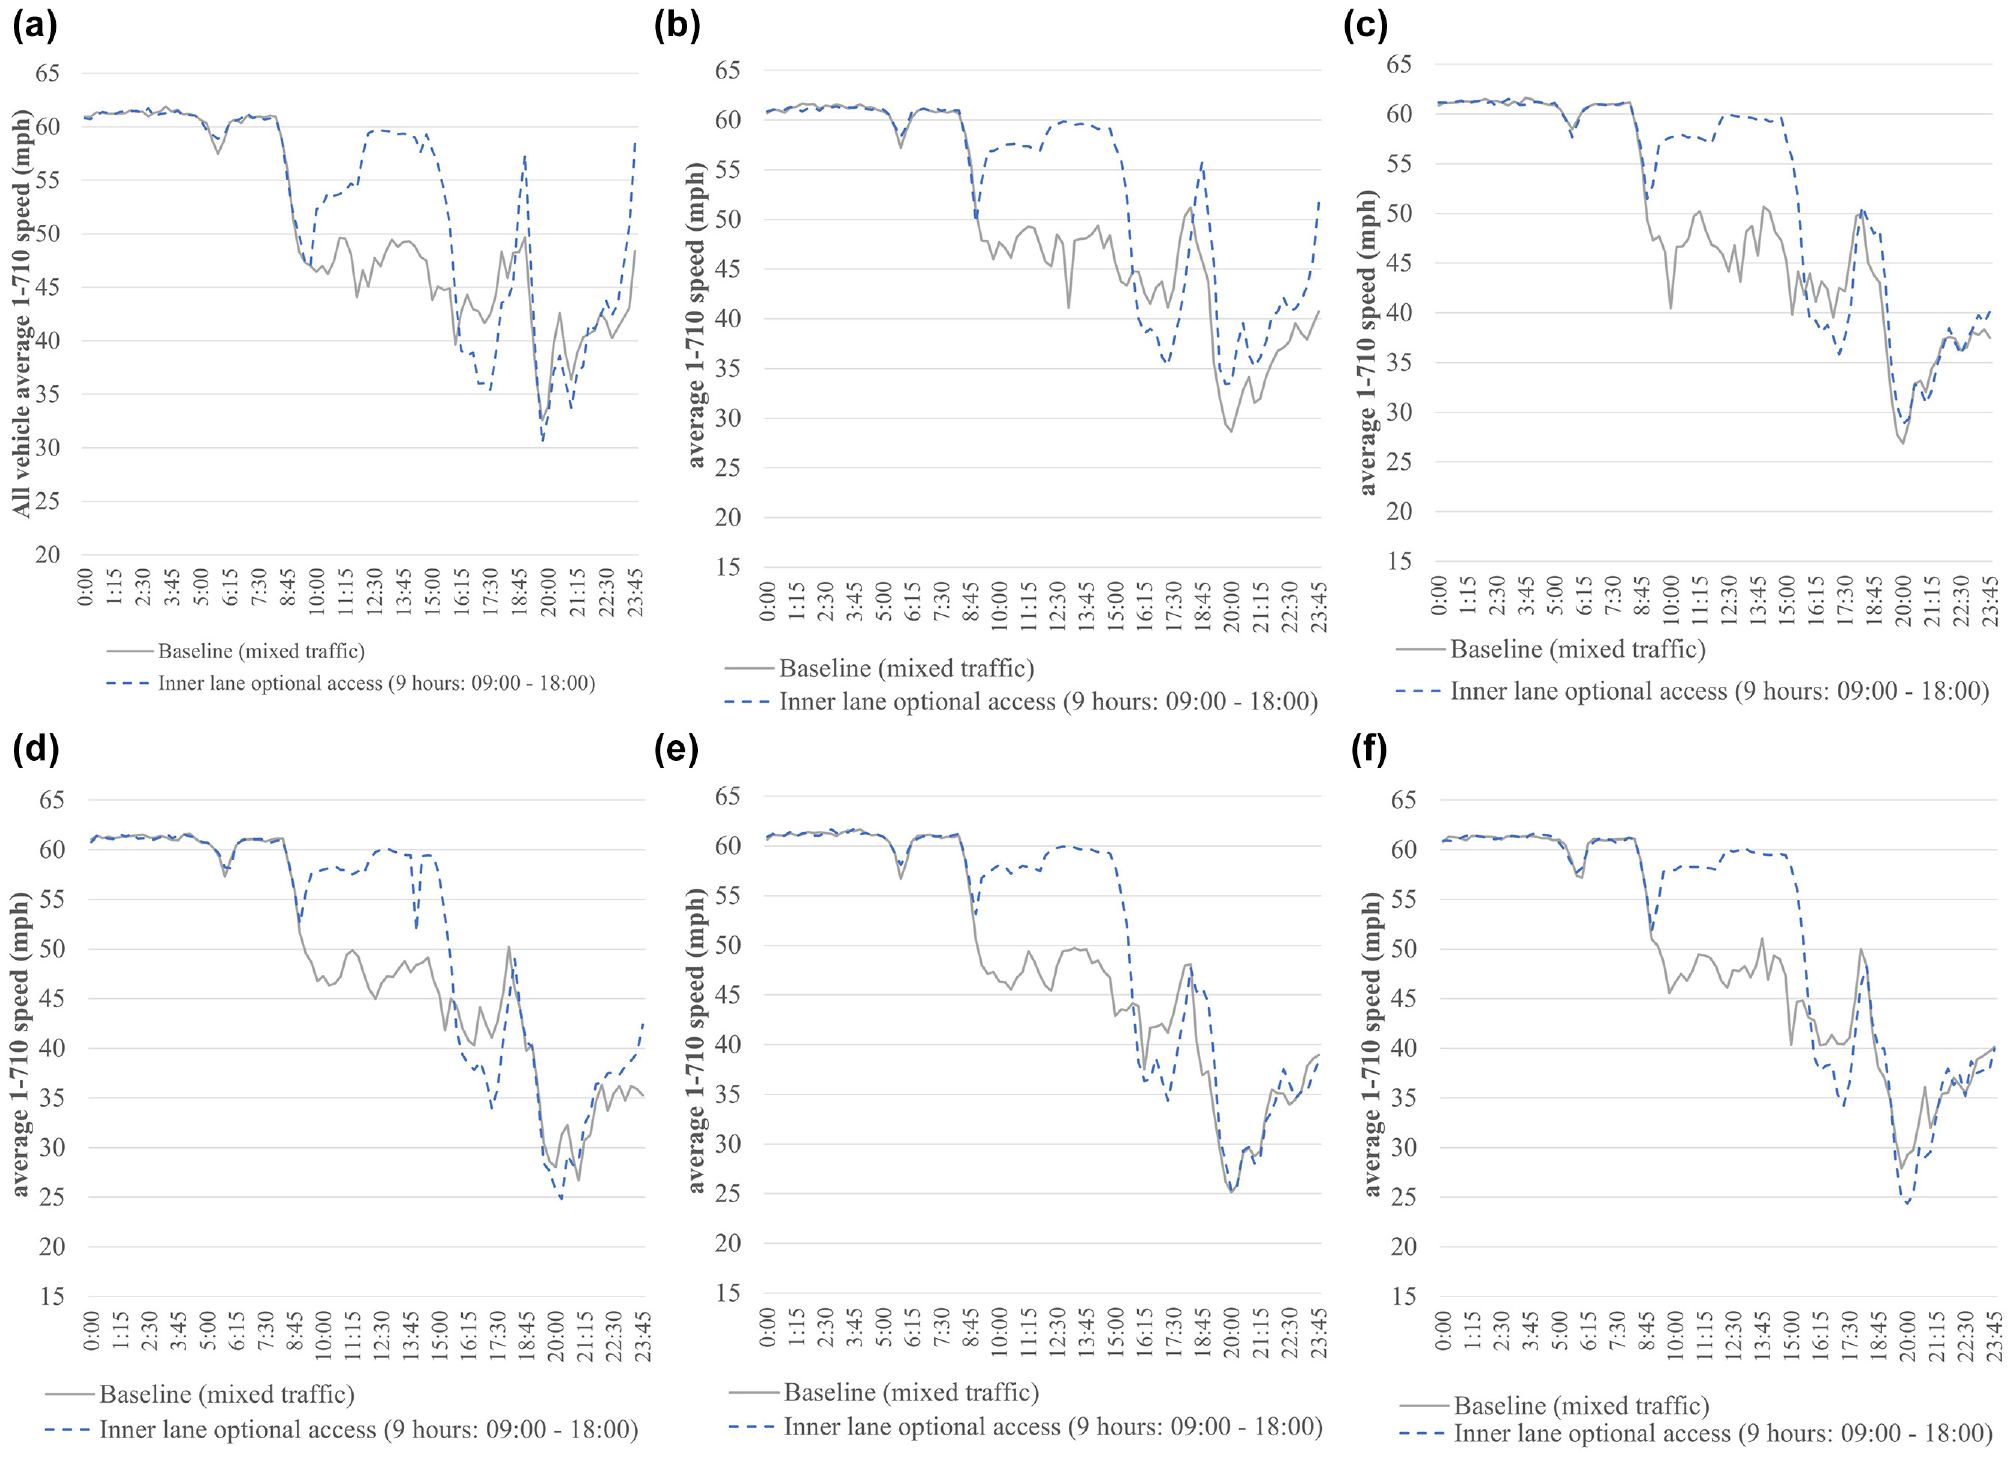
Northbound I-710 temporal speed variations for all vehicles: (a) cooperative adaptive cruise control (CACC): 100% heavy-duty drayage trucks (HDDTs) and 0% light-duty vehicles (LDVs), (b) CACC: 100% HDDTs and 10% LDVs, (c) CACC: 100% HDDTs and 20% LDVs, (d) CACC: 100% HDDTs and 30% LDVs, I CACC: 100% HDDTs and 40% LDVs, and (f) CACC: 100% HDDTs and 50% LDVs.
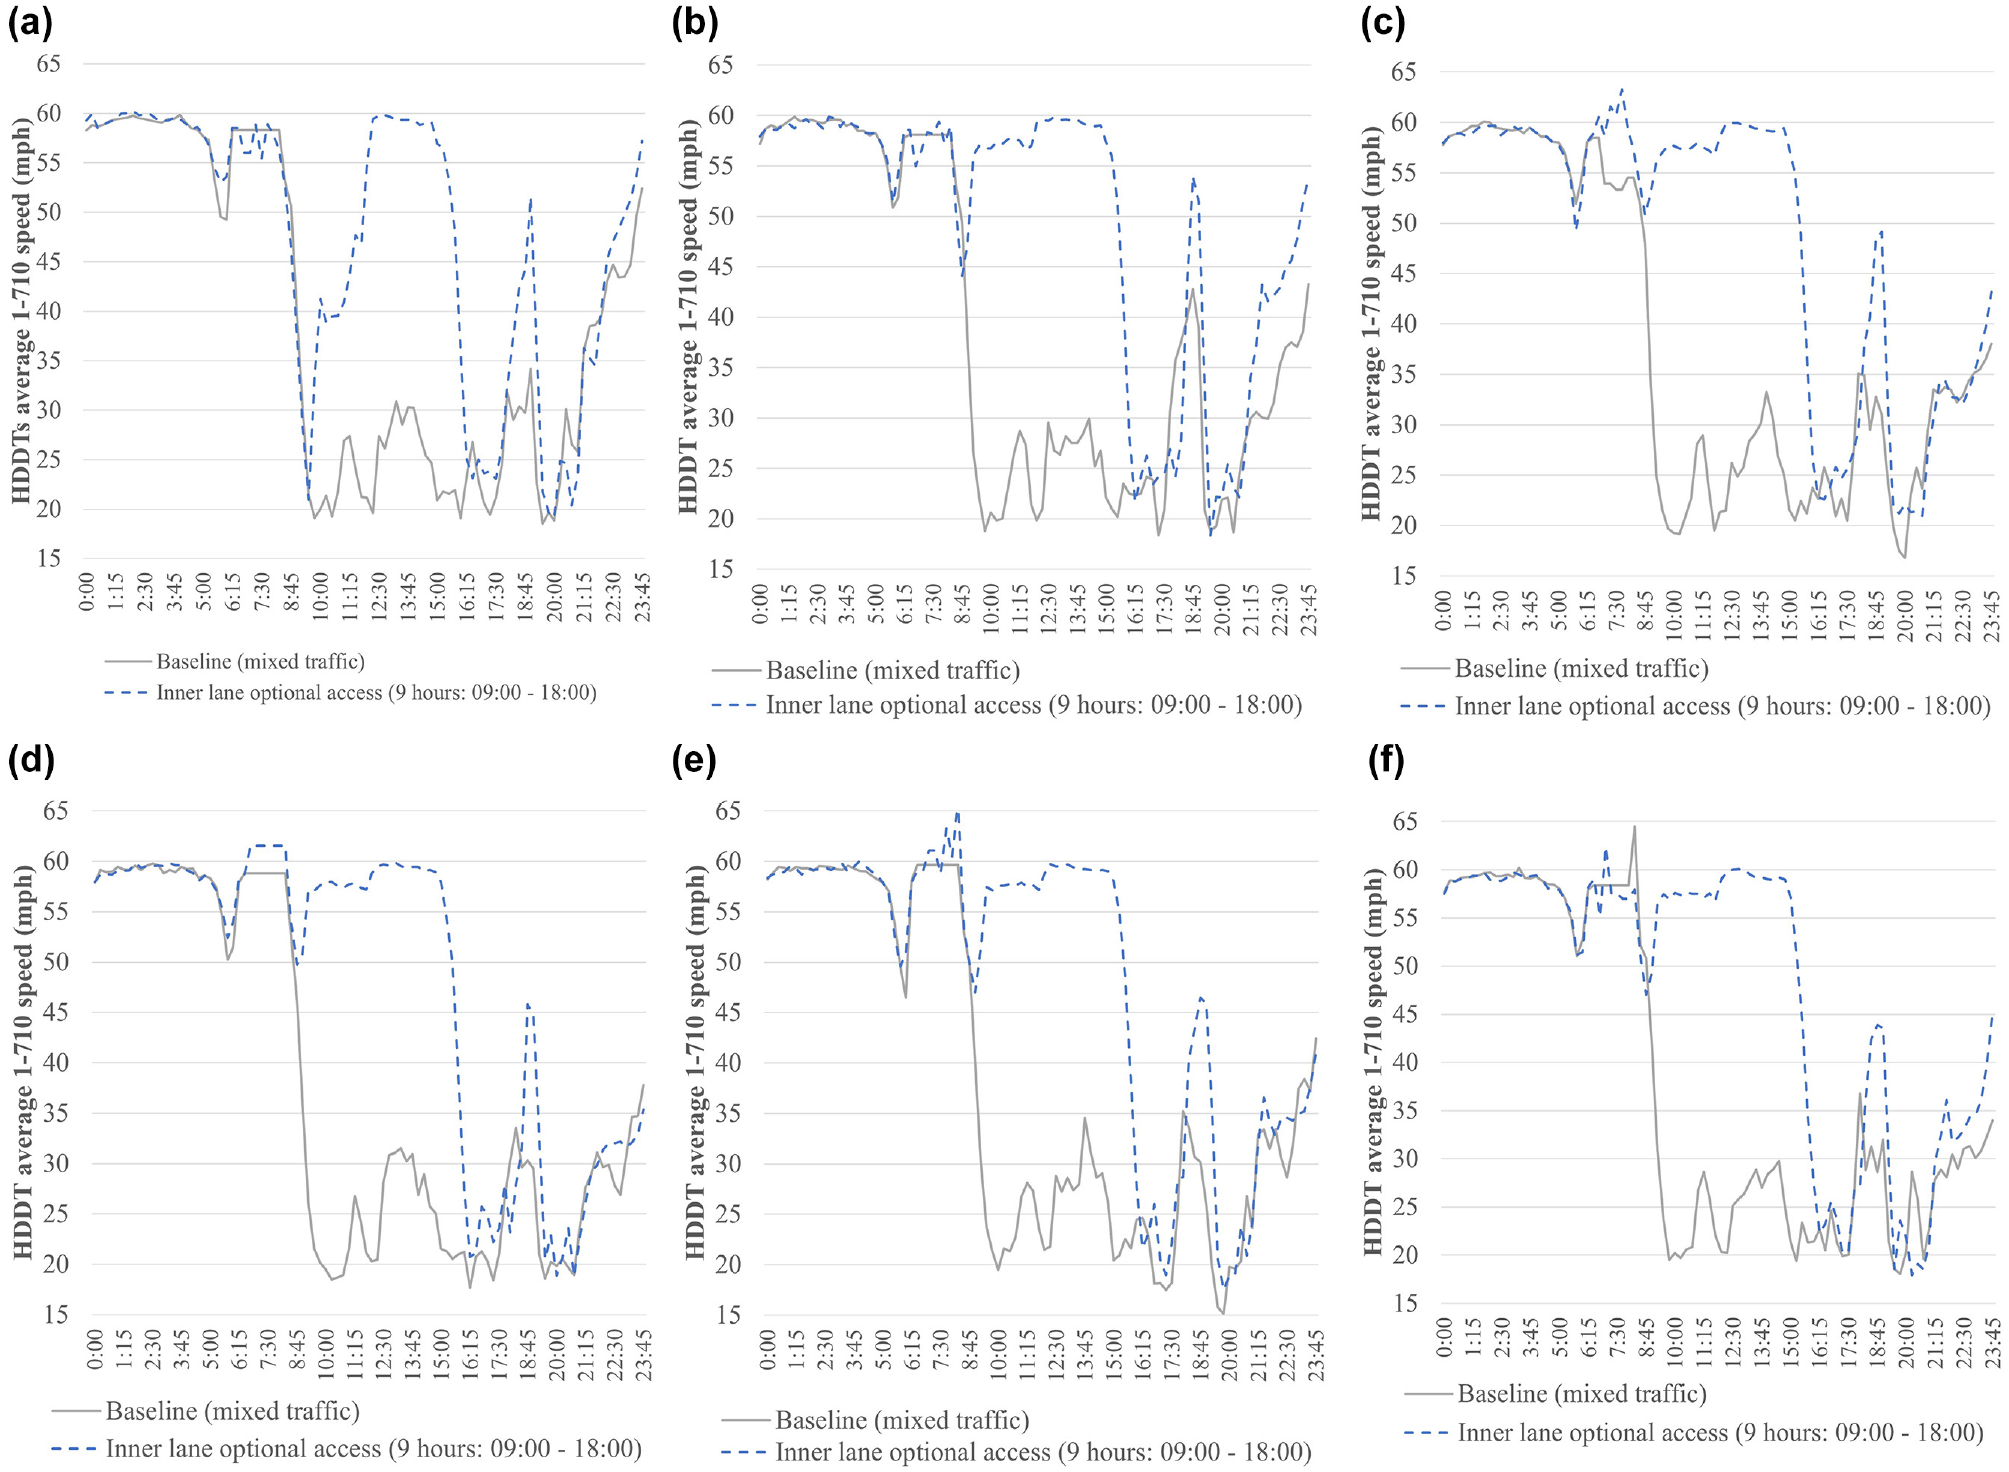
Northbound I-710 temporal speed variations for heavy-duty drayage trucks (HDDTs): (a) cooperative adaptive cruise control (CACC): 100% HDDTs and 0% light-duty vehicles (LDVs), (b) CACC: 100% HDDTs and 10% LDVs, (c) CACC: 100% HDDTs and 20% LDVs, (d) CACC: 100% HDDTs and 30% LDVs, (e) CACC: 100% HDDTs and 40% LDVs, and (f) CACC: 100% HDDTs and 50% LDVs.
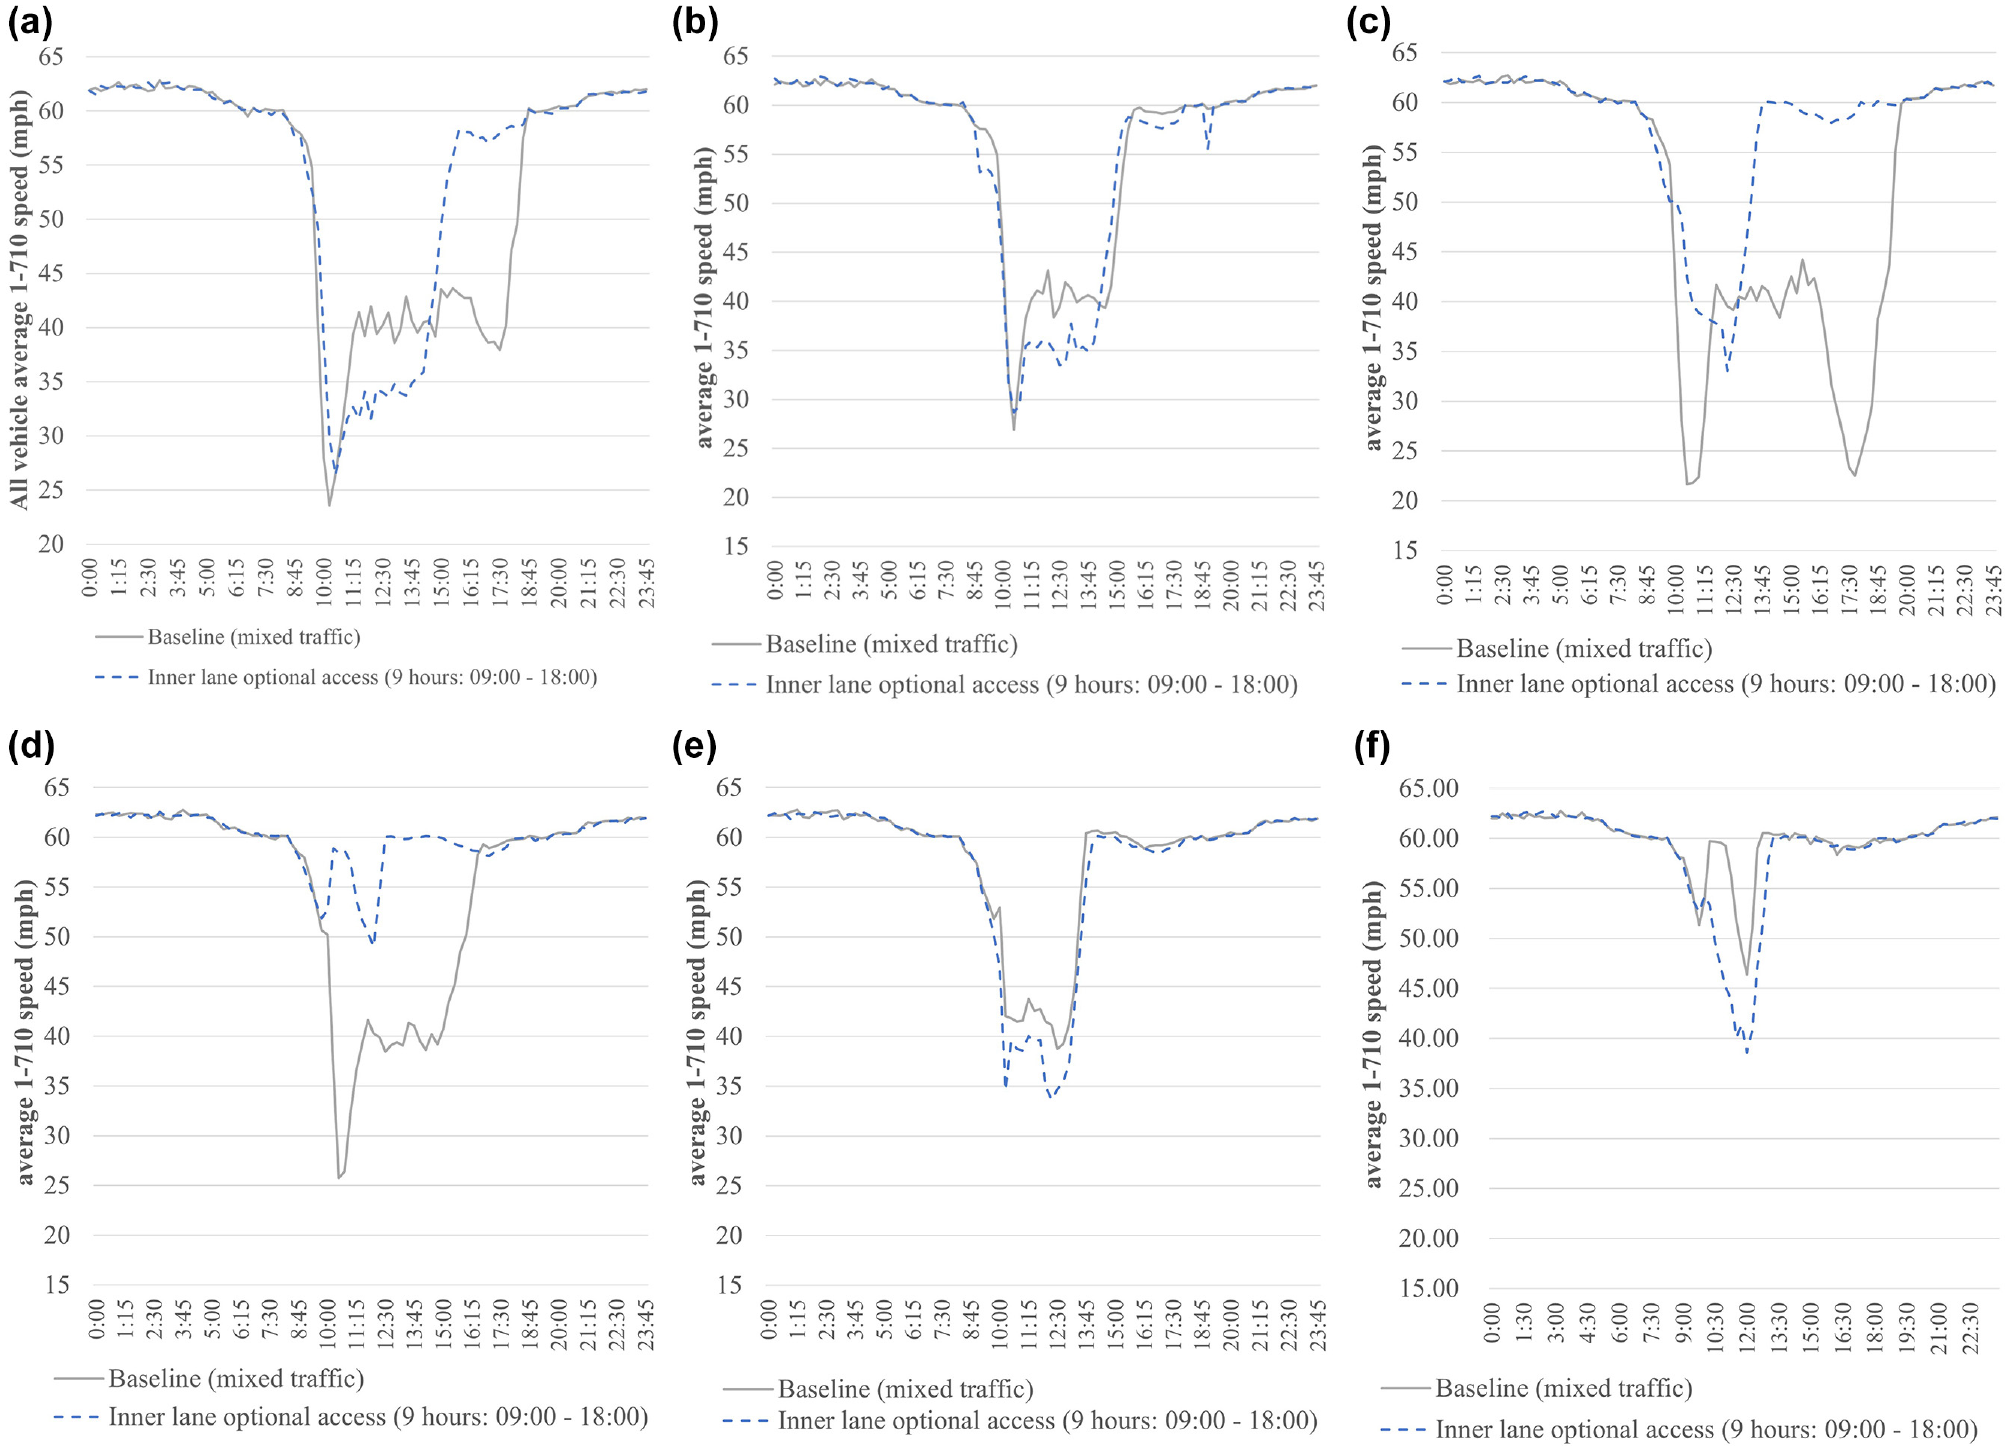
Southbound I-710 temporal speed variations for all vehicles: (a) cooperative adaptive cruise control (CACC): 100% heavy-duty drayage trucks (HDDTs) and 0% light-duty vehicles (LDVs), (b) CACC: 100% HDDTs and 10% LDVs, (c) CACC: 100% HDDTs and 20% LDVs, (d) CACC: 100% HDDTs and 30% LDVs, (e) CACC: 100% HDDTs and 40% LDVs, and (f) CACC: 100% HDDTs and 50% LDVs.
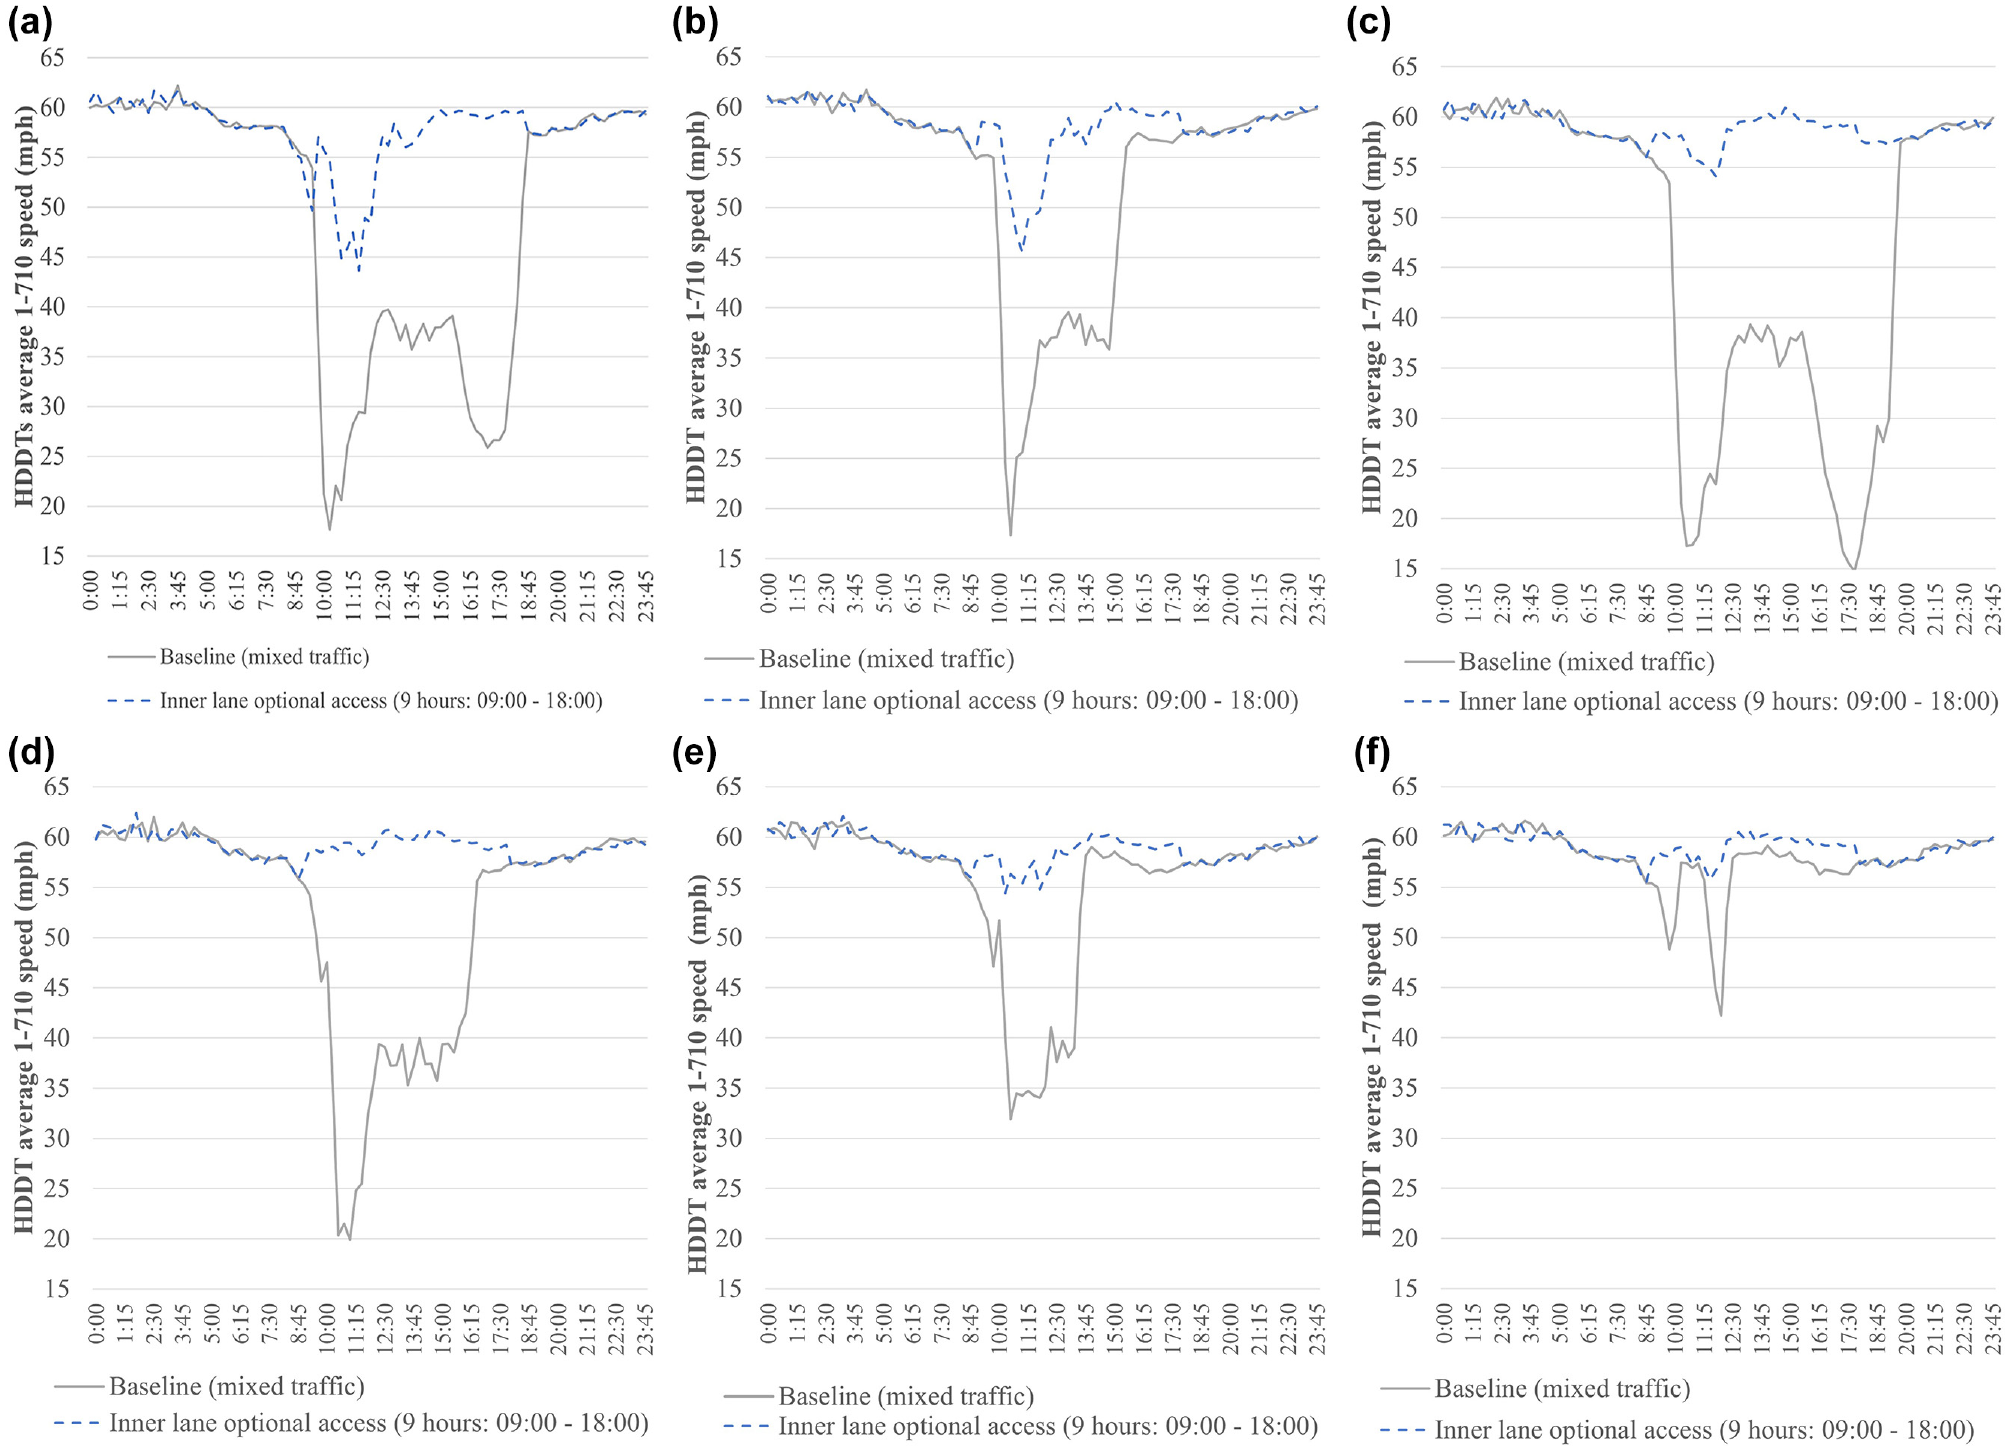
Southbound I-710 temporal speed variations for heavy-duty drayage trucks (HDDTs): (a) cooperative adaptive cruise control (CACC): 100% HDDTs and 0% light-duty vehicles (LDVs), (b) CACC: 100% HDDTs and 10% LDVs, (c) CACC: 100% HDDTs and 20% LDVs, (d) CACC: 100% HDDTs and 30% LDVs, (e) CACC: 100% HDDTs and 40% LDVs, and (f) CACC: 100% HDDTs and 50% LDVs.
Figure 6 displays temporal variations in NB I-710 speed for all vehicles. When only HDDTs are CACC enabled (Figure 6a), the average speed of all vehicles on I-710 NB increases on average by 5 mph (11%), with improvement peaks of up to 14.4 mph (32%), taking average speeds from 45 to 59.4 mph during select periods. After also deploying CACC-enabled LDVs, the impact of the reserved lane does not seem to degrade as the share of passenger vehicles that are CACC-enabled increases, likely because of the congestion level caused by HDDTs in the NB direction. However, the reserved lane speed increased from 45 to 60 mph during implementation. Lastly, as pointed out by a reviewer, speeds drop below the baseline during the p.m. periods between 15:00 and 17:30, which suggests that additional lane management strategies are needed to mitigate the negative effect of CACC during this period.
Figure 7 shows temporal variations on NB I-710 speed for HDDTs only. When only HDDTs are CACC enabled (Figure 7a), HDDT NB speeds increase on average by 20 mph (83%), with improvements of up to 40 mph (204%), taking HDDT speeds from 18 to 59 mph. As before, the impact of the reserved lane does not seem to degrade as the share of passenger vehicles that are CACC enabled increases, likely caused by a larger share of HDDTs on NB segments, which restricts the number of CACC passenger vehicles that can access the reserved lane. However, the reserved lane speeds increased from 20 to 60 mph during implementation.
Figure 8 displays temporal variations in SB I-710 speed for all vehicles. When only HDDTs are CACC enabled (Figure 8a), the average speed of all vehicles on I-710 SB increases on average by 3.4 mph (9%), with improvement peaks of up to 20 mph (53%), taking average speeds from 38 to 58 mph during selected periods. After also deploying CACC-enabled LDVs, the impact of the reserved lane reaches the best output when all HDTTs and 30% of passenger vehicles are CACC enabled, bringing speeds from as low as 25 to over 50 mph. However, when 40% and 50% of passenger vehicles are CACC enabled, the speeds of all vehicles are deep below the baseline.
Finally, Figure 9 shows temporal variations on SB I-710 speed for only HDDTs. When only HDDTs are CACC enabled, speed increases to over 50 mph during most of the implementation period. After also deploying CACC-enabled LDVs, the impact of the reserved lane reached its best output when all HDTTs and 30% of passenger vehicles were CACC enabled, bringing speeds from as low as 20 to over 55 mph during the implementation period.
When 40% and 50% of passenger vehicles are CACC enabled, speed improvements are lower, but the baseline speed continues to increase as the passenger vehicle share increases. I-710 SB speed improvements are more significant than on I-710 NB, given the smaller share of HDDTs.
Another interesting observation comes from our baseline when CACC-enabled LDVs and HDDTs drive under mixed traffic conditions. In the NB direction, HDDT speeds are bounded by a larger share of slow-moving trucks, making baseline speeds (Figures 6 and 7) appear approximately constant as the share of CACC-enabled LDVs increases (Figures 6, a–f , and 7, a–f ). However, in the SB direction, where the number of slow-moving trucks is smaller than in the NB direction, the baseline speeds improve as the share of CACC-enabled LDVs increases. This highlights that the congestion level on the road bounds CACC improvements and that the formation of vehicle strings on congested segments could create negative traffic impacts.
Conclusions
In this paper, we calibrated a regional microscopic simulation to model 24 h of freeway traffic between the SPBP and the Inland Empire in Southern California. We focused on I-710, a key economic artery that connects the SPBP to off-dock rail yards and inland warehouses. Traffic congestion originated from slow-moving trucks, with forecasts for 2035 projecting a 145% increase in drayage traffic. As shown in Figure 5, this increase in HDDT demand will likely affect HDDT speeds networkwide and reduce average speeds for all vehicles on I-710. Our analysis here aims to assess the speed improvements associated with implementing lane management strategies with CACC-enabled vehicles.
We found that vehicle connectivity alone only makes marginal performance improvements when deployed under mixed traffic conditions; other Southern California simulation studies reported ∼2%–6% speed improvements in overall traffic speed after deploying CACC-enabled vehicles under mixed traffic conditions ( 30 ). However, metropolitan planning organizations, such as SANDAG, in its 2021 Regional Plan, proposed implementing managed lanes and active demand management to deploy CVs ( 61 ). We considered three 2035 scenarios, including a baseline scenario where we deployed CACC-enabled vehicles under mixed traffic conditions. Two scenarios reserved the first lane (left-most lane) for CACC-enabled vehicles under restricted and optional access. We tested lane management scenarios when HDDTs were CACC enabled and when HDDTs and 0%–50% of LDVs were CACC enabled. Likewise, our testing periods were selected based on HDDT peak traffic periods (09:00–18:00).
Our results suggest that reserving the first lane (left-most lane) for CACC-enabled vehicles with optional access only provides marginal speed improvements on overall traffic (∼1% improvement compared to our baseline—Scenario A—where we deployed CVs under mixed traffic conditions), restricting CACC-enabled vehicles to the first lane decreases the average speed of all vehicles. I-710 average speed for the best-case scenario, where we reserved the first lane for CACC-enabled vehicles with optional access during the hours of highest HDDT traffic, showed significant improvements during the implementation period for both the average speed of all vehicles and for port HDDTs, bringing the average speed from as low as 45 to 60 mph and the speed of HDDTs from as low as 20 to up to 60 mph. In addition, we found that implementing lane management strategies during the busiest 9 h of HDDT traffic (09:00–18:00) yielded the best results. However, our results also showed that the impact of CACC passenger vehicles is bounded by the share of slow-moving trucks on the road even when a substantial number of passenger vehicles are also CACC enabled.
While typically, the speed benefits of CVs are small, combining lane management strategies to support the deployment of CACC-enabled vehicles could maximize their contribution to traffic performance and safety.
Our results are only as good as our underlying assumptions, the validity of the many sub-models in our simulation software, and our data, particularly our 2035 demand data. Additional limitations include being unable to restrict the number of vehicles in a CACC string and simulating only accident-free days.
More in-depth analyses of the benefits of combining managed lanes with CACC for SPBP trucks and assessing their impact on traffic safety are left for future work. Also left for future work are an analysis of the optimal share of slow-moving HDDTs to maximize CACC benefits and an exploration of the safety benefits of CACC-enabled vehicles.
Supplemental Material
sj-docx-1-trr-10.1177_03611981231175903 – Supplemental material for Lane Management Strategies in a Connected Environment: Analysis of Freight Corridor Scenarios for I-710 in Southern California
Supplemental material, sj-docx-1-trr-10.1177_03611981231175903 for Lane Management Strategies in a Connected Environment: Analysis of Freight Corridor Scenarios for I-710 in Southern California by Monica Ramirez Ibarra and Jean-Daniel M. Saphores in Transportation Research Record
Footnotes
Author Contributions
The authors confirm contribution to the paper as follows: study conception and design: M. Ramirez Ibarra, J.-D.M. Saphores; data collection: M. Ramirez Ibarra; analysis and interpretation of results: M. Ramirez Ibarra, J.-D. M. Saphores; draft manuscript preparation: M. Ramirez Ibarra, J.-D.M. Saphores. All authors reviewed the results and approved the final version of the manuscript.
Declaration of Conflicting Interests
The author(s) declared no potential conflicts of interest with respect to the research, authorship, and/or publication of this article.
Funding
The author(s) received no financial support for the research, authorship, and/or publication of this article.
Supplemental Material
Supplemental material for this article is available online.
References
Supplementary Material
Please find the following supplemental material available below.
For Open Access articles published under a Creative Commons License, all supplemental material carries the same license as the article it is associated with.
For non-Open Access articles published, all supplemental material carries a non-exclusive license, and permission requests for re-use of supplemental material or any part of supplemental material shall be sent directly to the copyright owner as specified in the copyright notice associated with the article.