
Abstract
This paper investigates the socio-economic impacts of the driving restriction zone policy for the Paris region, using the multi-agent transport simulation MATSim. Based on a previous work which has calibrated a first instantiation of the mobility model to the Paris region, we extend it by modeling and simulating two forms of intermodality: Park-and-Walk and Park-and-Ride. After re-calibrating the model, we evaluate two policy scenarios featuring different scales of the restriction zone, using indicators related to mobility, traffic emissions, and social cost. The analysis puts special attention on how modal shift and emissions vary across space, that is, inside and outside the policy zone. We find that the small-scale scenario with a restriction zone limited to the Paris center leads to very limited modal shift, whereas the larger-scale policy scenario encompassing the whole of Paris shifts significantly more trips (about 1.4% of total trips) from cars to public transport and other modes. In both scenarios, traffic emissions decline in the restriction zone and its near surroundings. Far from the restriction zone, however, emissions increase in the small-scale scenario but decrease in the large-scale scenario. These differences are caused by the traffic detour, modal shift, and rebound effects, the magnitudes of which vary depending on the scale of the restriction zone. The driving restrictions also cause the social cost to increase by around 10% in both scenarios. This ultimately implies a trade-off between reducing emissions and increasing user costs, with a substantially greater efficiency (larger reduction for similar cost) in the large-scale policy scenario.
Keywords
The increasing motorized traffic, especially in urban areas, generates large amounts of greenhouse gases (GHG) and air pollutants, leading to climate change and health issues. Over the last decades, a growing number of cities in Europe have implemented urban access regulations to reduce cars at the neighborhood or city scale ( 1 ). Low-emission zones (LEZ) and urban toll or congestion charging are well-known solutions. Other kinds of strategies have been established in local areas, like setting superblocks (i.e., a neighborhood strategy with no through traffic on the interior streets), raising parking fees, and reducing speed levels (e.g., a speed limit of 20 km/h on neighborhood roads during the “No-vehicle day” in Paris) to prioritize walking and cycling ( 2 ). In 2022, the city of Paris, France, announced a ban on motorized traffic crossing the city center in the year of 2024, aiming at reducing local traffic pollutions and noise, as well as freeing up more space for pedestrians and cyclists ( 3 ). This delimited zone (“zone à trafic limité” in French) is referred to as a driving restriction zone (DRZ) hereafter.
Intuitively, the DRZ primarily benefits local residents who enjoy less traffic. Some empirical studies have found that DRZ policies can indeed limit the traffic inside the zone, but also increase outside traffic in the short run because of detours ( 4 – 6 ). For instance, Sleiman studied the impact on the ring road traffic of closing the Paris downtown riverbank, and found that the congestion probability of the ring road lanes increased by 15%. ( 5 ) Some evidence shows that in the medium run, modal shift occurs as some users stop using cars and opt for other modes instead, like public transport and bicycles ( 7 ). Furthermore, strategies for curbing traffic volumes may lead to other rebound effects that reduce the expected benefits. For example, ridesharing services cannot attain the same reduction in traffic as that expected from the original car drivers’ modal shift ( 8 , 9 ). In relation to the environmental assessment, several studies have explored the performance of LEZ, which can be used as a basis for comparison as the impact of DRZ is expected to be similar to, if not more intense than LEZ because of its stricter measures. Dias et al. found that PM10 and NO2 emissions from private cars decreased significantly inside the LEZ, whereas at the city level total emissions increase as a consequence of the changes in traffic patterns induced by the creation of the LEZ ( 10 ). On the other hand, positive effects of LEZ on the reduction of PM10 concentration were observed both at the local and at the global scale for the case study of Munich, Germany ( 6 ).
Previous studies therefore suggest that in the short run the DRZ can bring benefits within the traffic monitoring zone, but at the expense of outside areas. In the longer run, the DRZ may have overall positive effects provided that a sufficient modal shift from cars occurs. This uncertain effect can be explained by several reasons. Besides the reason of the system elasticity in different periods, the heterogeneity of the case studies is another important one ( 11 ). The DRZ effects that differ from one city to another rely on different factor dimensions, such as city structures, stakeholders involved, mobility patterns, and supporting measures. From the literature, there is still limited knowledge of how different socio-economic impacts vary across space (i.e., inside and outside the zone) and across individuals (e.g., residents, commuters, visitors, and so forth). Compared with the traditional methods, such as nested logit model ( 7 ) and trip-based model ( 12 ), agent-based simulation models are especially suited to investigate the expected impacts of DRZ by carrying out a disaggregate analysis. Previous studies have used agent-based simulation methods to evaluate the impacts of DRZ for urban logistics ( 13 , 14 ). A recent study of the mobility and environmental impacts of DRZ was carried out using the agent-based transport simulation tool MATSim with the open Berlin scenario ( 4 ). However, trip intermodality was not considered in the model.
From a methodological point of view, it is challenging to model and simulate multimodal (or intermodal) mobility in the Paris region (also called Île-de-France) because of its large population and complex multimodal networks. Recently, Hörl and Balac applied an agent-based mobility simulation to this region ( 15 ), using a novel discrete mode choice (DMC) extension under the MATSim framework ( 16 ). The proposed approach, named “Eqasim,” provides a pipeline to generate a synthetic population in Île-de-France so that the mobility scenario is reproduced and finally used for simulation. However, intermodal trips, such as Park-and-Walk, that is, car trips with access/egress walking stages, and Park-and-Ride (P+R), are not included yet. It is necessary to consider these two car-related intermodal trips in our case study. Consider that there is a strict rule for non-residents not to drive within the restriction zone. Individuals who used to drive to access the zone must now change their behavior. These drivers could park their car at the zone edge and then walk to their destination if the walking distance is acceptable. Otherwise, they could also consider car–public transport intermodality through P+R facilities. P+R trips are in fact very common in the Paris region, especially for commuters living in the suburbs. In recent years, this intermodality has become more and more popular thanks to the government’s transportation investment. To facilitate motorist access to railway stations and promote intermodality, the regional transport authority has increased the numbers of P+R facilities and parking spots year over year. By 2018, more than 107,000 spots in 550 P&R facilities located near the railway stations had been established in the Paris region ( 17 ). The P+R investment is currently further accelerated with the Grand Paris Express Plan, which consists of the development of new automated metro lines that will go through the suburbs by 2035.
Our study aims to investigate the impacts of the DRZ policy on mobility behavior, traffic emissions, and social costs. The scenarios are simulated using MATSim, specifically with the updated DMC model applied to the Paris region. Special attention is put on modeling intermodality for multi-stage car trips, that is, on car trips with access/egress walking legs or combined with public transit using P+R facilities. Although other forms of intermodality do exist, for example, the micromobility of bicycles and e-scooters connecting to public transit ( 18 , 19 ), they do not fall within the scope of our study. To complement the concerned intermodals in the existing DMC model in Eqasim, we first enrich the car utility function with the cost of the access/egress walking time and add a new utility function of the P+R mode. Then, we calibrate the related parameters in the two utility functions. We finally simulate two DRZ scenarios with different scales for the restriction zone, and evaluate mobility, emission, and social cost indicators at different scales also, that is, inside/outside the zone as well as for the whole regional area.
The rest of the paper is organized as follows. The next section introduces the modeling and simulation, particularly for intermodality and its calibration. The DRZ policies in the Paris case study are then presented, followed by the simulation results and the analysis of scenario performance. The final section provides a discussion and conclusions for this work.
Modeling and Simulation
MATSim
MATSim is an open-source framework for agent and activity-based transport simulations. This tool enables to simulate individuals’ daily activity-travel plans for large-scale scenarios ( 16 ). In the process, each individual’s plan is updated during the iterations, using the global algorithms for departure time choice, mode choice, route choice, and so forth. The plan is selected by some rules, usually by maximizing the score (or utility). Each individual is then simulated along the selected plan that is either an old plan or a new updated plan, and interacted with others in the current transportation system. At the end of the iteration, representing one-day mobility, all individuals’ executed plans are evaluated with their accumulated utilities from the activities and travels carried out on that day.
MATSim has been successfully applied to many scenario studies all over the world. In the case of Paris, the model is based the Eqasim version of MATSim, which features a novel DMC module (see Figure 1). In Eqasim, the agents can modify their initial plans by changing transportation modes through the DMC in the re-planning step, according to the travel impedance information. The DMC model in the Île-de-France scenario defines utility functions for each single mode of car, public transport, bike, and walk ( 20 ). The multinomial logit mechanism is applied to the mode choice. Eqasim can simulate large-scale human mobility and it still gives a room for the model development, such as the intermodal mobility mentioned in our study. Therefore, we enrich the model first by modeling the trip intermodality before applying the model to the DRZ case study.
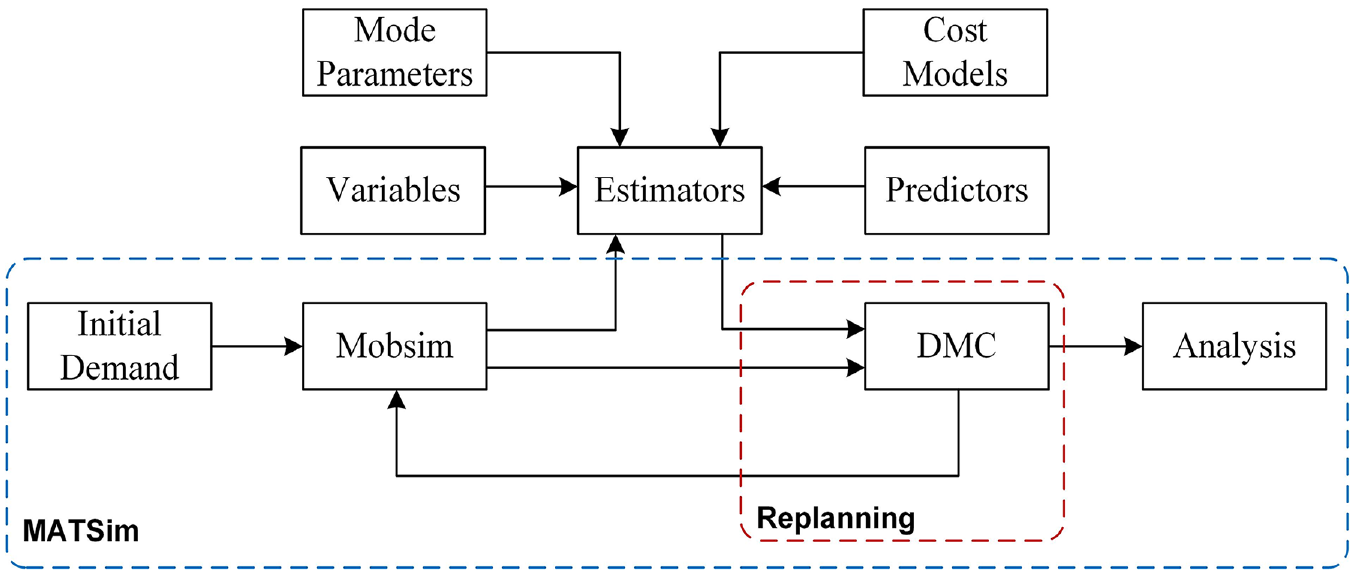
Coupling discrete mode choice (DMC) module in MATSim ( 21 ).
Traffic emissions are then estimated using HBEFA (Handbook Emission Factors for Road Transport), which is available for many European countries ( 22 ). The emission model and its integration with MATSim can be found in Kickhöfer ( 23 ). In our study, the traffic emissions are calculated offline after the mobility simulation. In detail, the warm and cold-start traffic emissions are calculated, according to (1) the simulated mobility event file where each vehicle’s movement states are recorded time-dependently on the links, and (2) the related emission factors from HBEFA, including common GHG emissions, such as CO2, CH4, and N2O, and air pollutants, such as CO, NOx, SO2, and PM2.5. The corresponding traffic emissions at the event level are then aggregated by vehicle, link, time, or space for the purposes of analysis.
Intermodality Specification
For a long time, transport modelers have studied on the access and egress modes connecting to public transport ( 18 , 24 ). It is said that the access and egress stages often contribute substantially to the travel disutility of a multimodal public transport chain ( 25 ). Intermodal router for public transport (e.g., walking or other micromobility + transit) using the SwissRailRaptor is already integrated into MATSim ( 26 ). However, our study focuses on car intermodality, and most of the access and egress stages are made by walking as people would park their cars close to the origin or destination location for picking up conveniently. Besides, the user travel with the combined modes of car and transit through P&R facilities is further studied here.
Park-and-Walk
For the default Île-de-France scenario, in Eqasim, the simulation of walking stages for car trips is not active. Therefore, in the DMC, a constant walking time (e.g., 4 min) is assumed for the car trip, which is integrated to the definition of car travel utility. In the case of no DRZ policy, this constant setting is conservative to simplify the car utility function. However, when the DRZ policy is implemented in our case study, this constant walking time will overestimate the utility for car trips if their destinations within the restriction zone are located far away from the nearest link at the zone edge where they park their cars. In this case, the long walking time between the place where the car is parked and the final destination within the restriction zone would involve a substantial disutility that must be accounted for. As the general configuration of the access and egress walking stages for car trips is available in MATSim, we can activate this setting in Eqasim as well. After we consider the walking stages for car trips, the assumed constant walking time is replaced by the more precise one, which depends on each individual’s walking distance in simulation and the walking speed defined in MATSim.
Therefore, we calculate access and egress walking times for each car trip during the simulation. This time cost is taken into account within the car utility function in the DMC. To amplify the disutility caused by very long walking access and egress distances as it could happen in the DRZ scenario, we update the car utility function by adding the following penalty

Park-and-Ride
In the current MATSim, the same as in Eqasim, P&R trips are also not considered. Recently, Diallo et al. ( 27 ) simulated P&R trips with twelve facilities located throughout the Lille Metropolitan Area, France. Beyond this work, we add similarly the car+pt (i.e., the combined mode of car and public transport) to the Île-de-France scenario in Eqasim. Together with the above Park-and-Walk, a complete car+pt trip should consist of the multiple stages as walk–car–walk–pt–walk for a going trip or walk–pt–walk–car–walk for a returning trip. The pt stage may have multiple sub-segments, for example, switching transit lines. Thus, the car+pt routing process for a simple going trip is created by the following steps: (1) to find the closest P&R facility from home, (2) to perform the car route choice from home to the facility using the default car routing algorithm in MATSim, and (3) to perform the pt routing from the facility to destination using the SwissRailRaptor in MATSim. For the returning trip, we reverse the above three steps; meanwhile, the tour constraint rule is executed so that people should return to the same P&R facility to take their car back home. Note that the multimodal transportation network and the transit departure time that should be satisfied in the routing process are produced from the open datasets of OpenStreetMap and GTFS of the region. As most P&R facilities are located along the rail lines outside Paris, we adopt in total 500 P&R facilities around the railway stations for the car+pt simulation.
For the car+pt utility function, we sum the car and pt utilities that are calculated from the corresponding stages. Then we remove the two alternative specific constants

Model Calibration
In the previous study (
15
), the parameters in the original DMC model were calibrated with the regional household travel survey (HTS), EGT 2010. For each modal utility function, the coefficients in utility terms are associated to travel time and travel distance (converted to monetary cost, except for walking), as well as other special concerns, like differentiation in space for car and bike trips, the number of transit transfers, and the amount of transfer time. After considering the above intermodal trips, in the updated DMC, we keep using almost of them but with two updates: (1) the original car utility is updated by considering the variable of access and egress walking time
To perform the manual calibration, a set of parameters are tested in a sensitivity analysis. The calibration performance is measured by the mean absolute percentage error (MAPE) of modal shares between the results in simulation and in the HTS. That is,
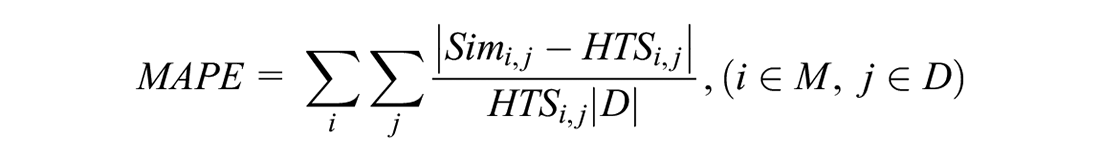
where M is the set of modes and D is the set of distance classes with an interval of 0.5 km. Finally,
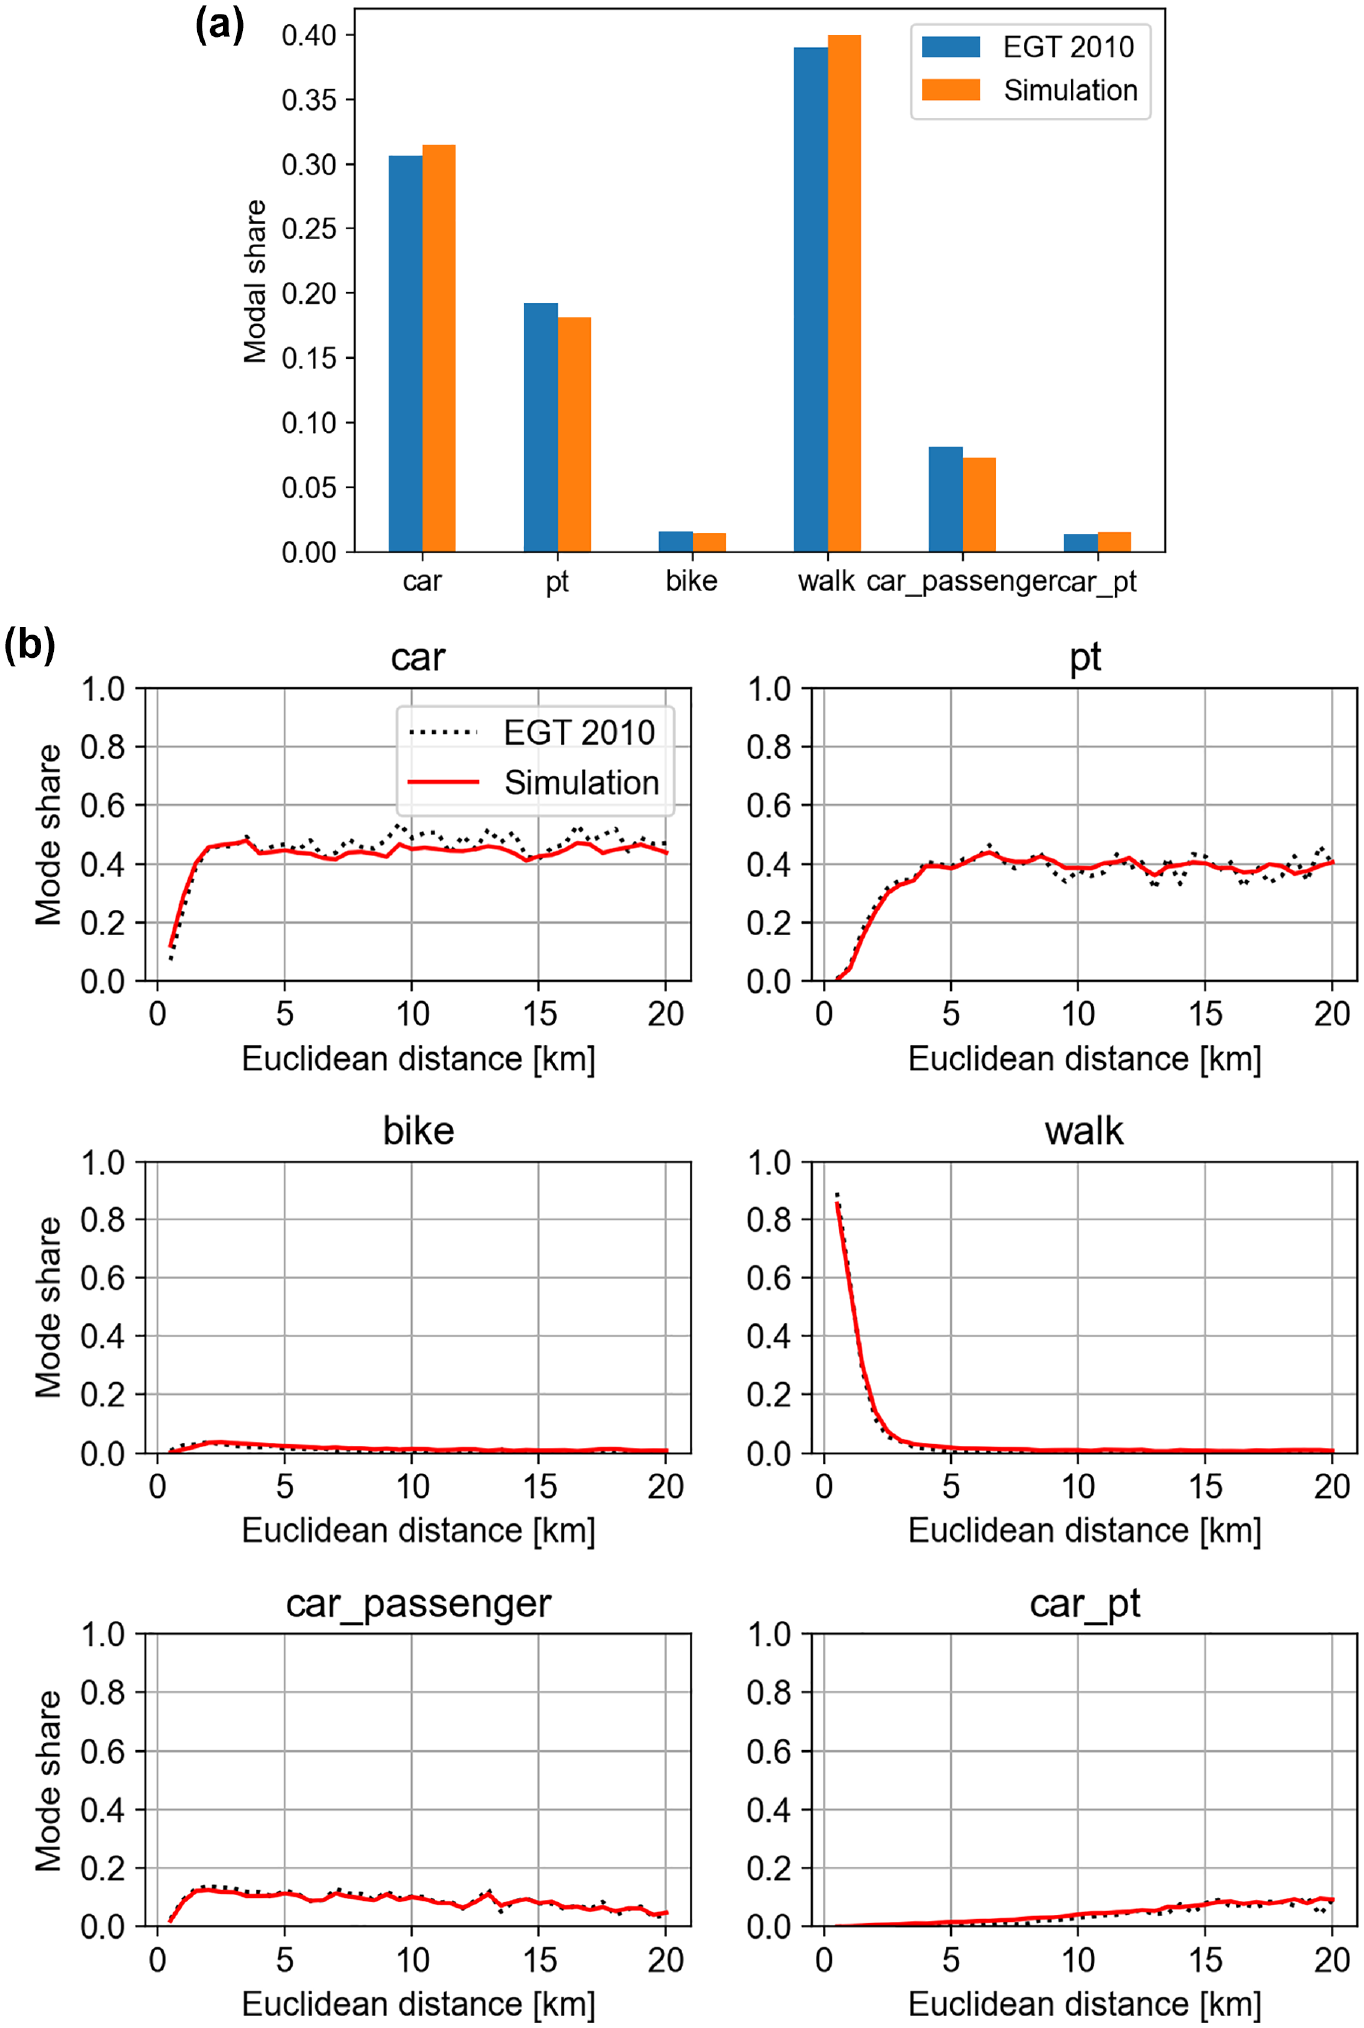
Calibration of modal shares: (a) in total number of trips and (b) in number of trips per distance class.
Case Study
Overview of the Paris Region
The Paris region covers the surface of about 12,000 km2, including the city of Paris and its suburbs. This region had approximately 12.2 million inhabitants in 2018 ( 28 ). The city of Paris has a high urbanization level with a very dense population, about 23,000 inhabitants/km2 over 105 km2, see department code of 75 in Figure 3, followed by the inner-ring departments around it, about 7,000 inhabitants/km2 over 657 km2, see codes of 92, 93, and 94 in Figure 3. The outer ring of departments (codes of 77, 78, 91, and 95) contains most outer suburbs, together with some secondary cities scattered in the rest of the region, that is, above 90% of its geographical space accommodating less than 45% of the regional population. The entire area includes in total 1,276 municipalities.
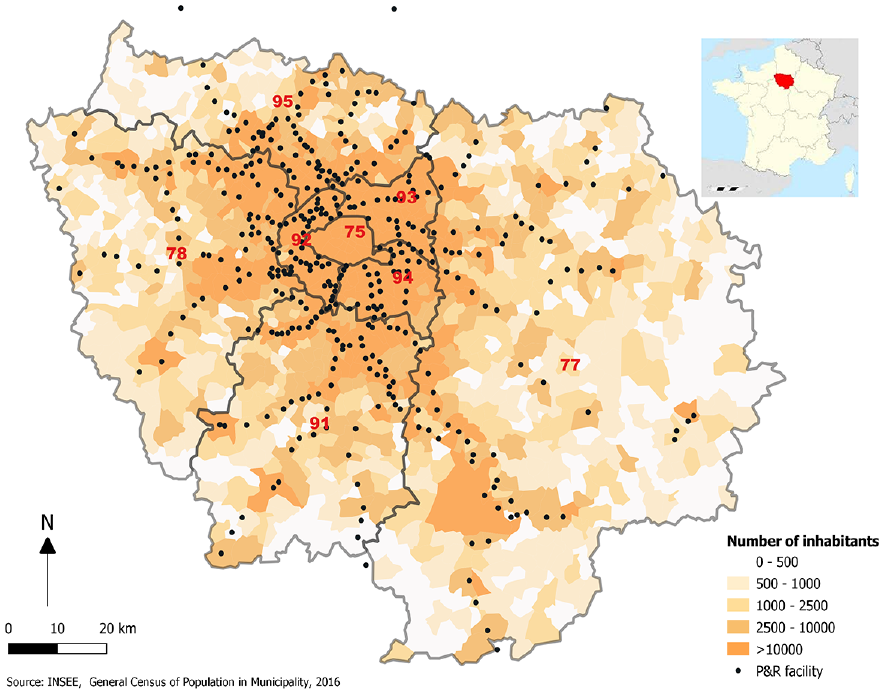
The Paris region.
This strongly monocentric pattern of urbanization is supported by the structure of transportation networks. Both the motorway and the regional railway networks exhibit star-like patterns with radial connections from the urban center to the peripheral areas. As of 2018, motorways have a total length of 613 km and transit services are supplied in a variety of sub-modes: there are sixteen subway lines (mainly in Paris city), fifteen regional rail lines (including regional express railways and other “Transilien” lines), nine tramway lines spanning the inner suburbs, together with more than 1,400 bus lines.
Despite its dense population and complex transport system, various transport planning models are developed by the regional organizations for specific purposes, such as the tour-based model of ANTONIN from the regional mobility organizing authority IDFM, the trip-based models of GLOBAL from the major transit operator RATP, and the four-step model of MODUS from the public agency of the regional and inter-departmental transport, land-use planning, and environment DRIEAT ( 29 ). In recent years, the multi-agent simulation model MATSim has been applied to the scenario study in this region ( 15 ).
Scenario Design
A 5% sample of the Paris region population is simulated in our case study. This setting generates enough agents to provide robust results during the simulation, with relatively efficient computation. Here, two DRZ scenarios are designed, see Table 1. They are compared with the reference scenario, which is the calibrated one without any DRZ setting.
Studied Scenarios
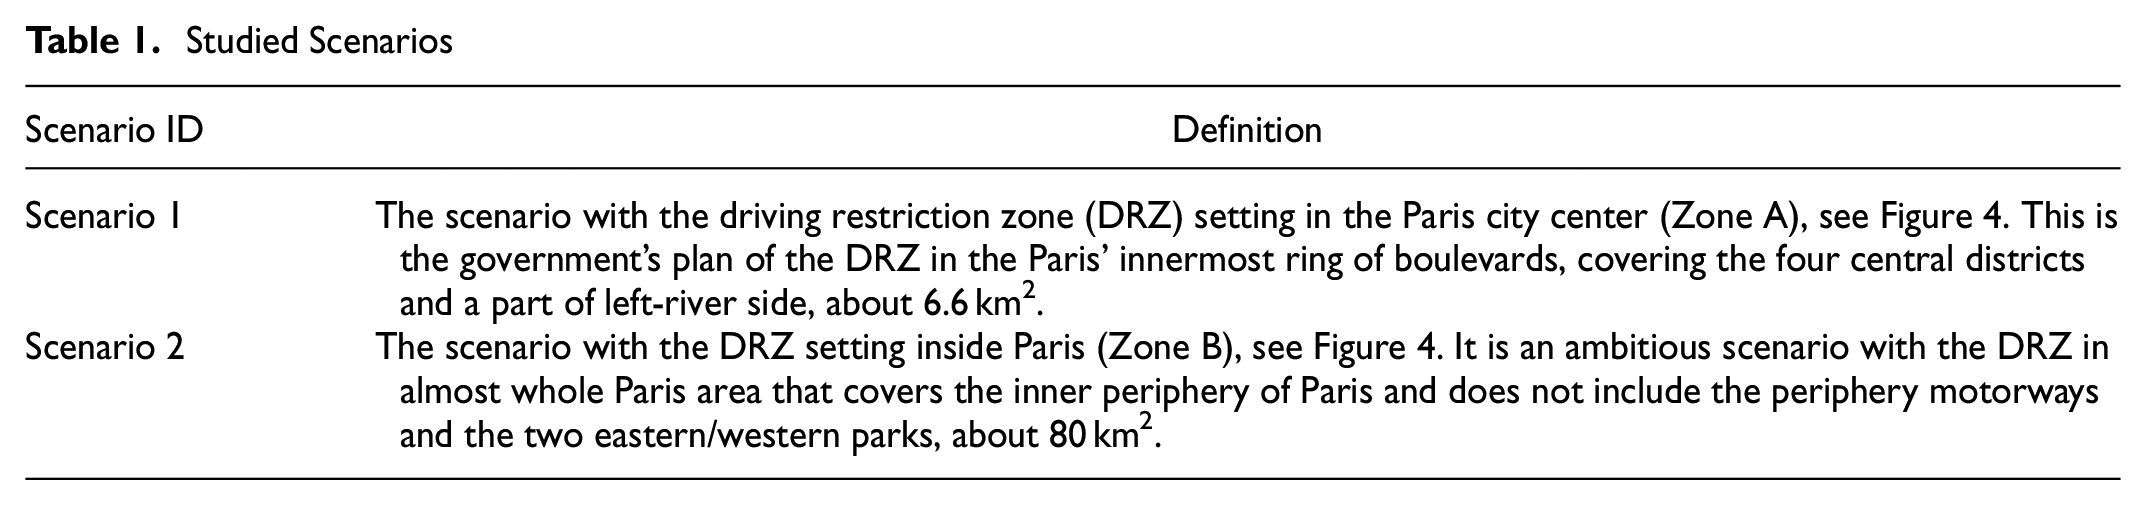
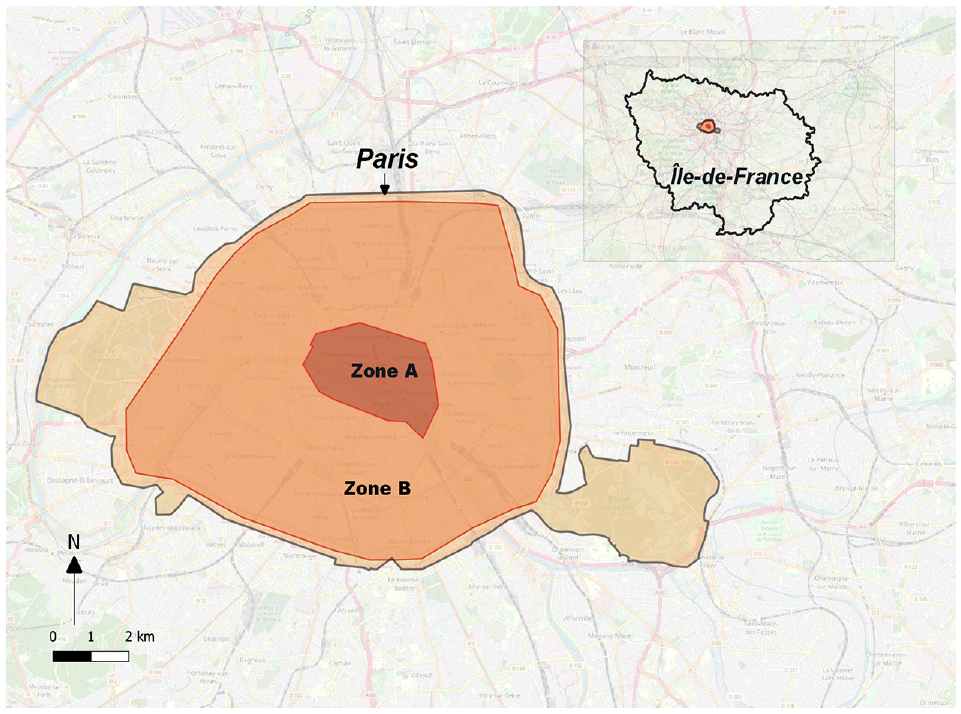
Driving Restriction Zone policies for Paris city center (Zone A) and inner Paris (Zone B).
For both DRZ scenarios, we assume there exists a strict traffic limit for the zone access. That is, among private car drivers, only local residents can drive within the zone. To execute this condition, the availability of car usage in the DRZ is only labeled for the sub-population who are local residents and who have the car mode access. We need to modify two input files from the reference scenario so as to constitute the two DRZ scenarios. One is the population file where we detect the local residents in the restriction zone and label them as “Person_internal,” otherwise “Person_external.” The other modified file refers to the transport networks. In the Paris region, we add to all car permitted links a specific mode of “Car_internal” that is used exclusively by “Person_internal,” that is, local residents, and remove the mode of car if it exists for all links within the DRZ and keep the car mode outside the DRZ. In this way, private car drivers living outside cannot drive in the DRZ, as a result of the zone links without any car attribute. Here, the “Car_internal” mode in the DRZ scenarios has the same attributes and settings as the car mode in the reference scenario.
Results
In this section, we compare the three scenarios in relation to modal share, traffic emissions, and socio-economic key performance indicators (KPIs). The results of modal share and emissions are further investigated across three scales: (1) Zone A, (2) Zone B–Zone A, and (3) Outside Zone B within the Paris region. Afterwards, the overall performance is evaluated by the socio-economic KPIs. Note that the simulation results are not scaled up by the corresponding factor to the 5% population simulated in the Paris region.
Mobility Analysis
In Figure 5, we compare the modal share of trips among the three scenarios. For each scenario, about 2 million trips are simulated. In total, six modes are analyzed. The shares of private cars decrease by 0.1% in Scenario 1 and 1.4% in Scenario 2 compared with the reference scenario. Whereas modal shift remains very limited in Scenario 1, in Scenario 2 a large part of removed car trips (about 0.8% out of 1.4%) shifts to public transport and a smaller part (0.2% ∼ 0.3%) to walking and the new car+pt mode. The mobility impact is therefore substantially larger if the DRZ policy is implemented across all inner Paris and not just in its center.
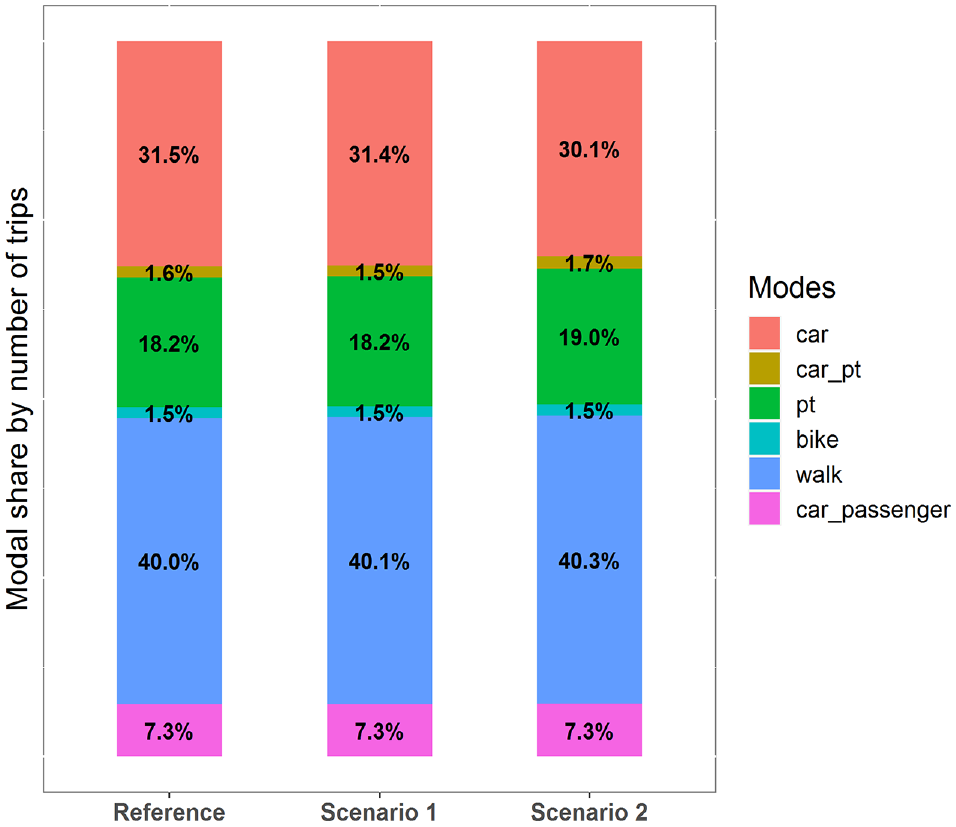
Comparison of modal shares in different scenarios for the Paris region.
Unexpectedly, car+pt trips decrease by 0.1% in Scenario 1. To find the reason behind this, we extract the commuters who work in an analysis zone but live outside and compare the modal share of their trips between the reference scenario and Scenario 1. The compared results are shown in Figure 6. In Figure 6a, the commuters who work in Zone A, that is, the Paris center, make about 17,000 trips in total and their car trips are reduced largely from 16.6% to 5.6% (this is not to 0% as they can still use the car for other trip purposes outside Zone A). Meanwhile, as a result of the DRZ policy, car+pt trips are increased (+2.7%) as expected, although most car trips shift to public transport (+7.2%). In Figure 6b, the commuters who work outside Zone A but within Paris, that is, Zone B–Zone A, make about 86,000 trips in total. The car share increases by 0.9% and the car+pt share decreases by 0.7%. This counterintuitive result could stem from traffic conditions outside Zone A improving after the policy is implemented in the city center, and thus attract more commuters outside Zone A to use their cars. Some commuters even give up their original car+pt trips by driving directly to this area. This is why, in Figure 5, a slightly reduced car+pt share against the global trips is observed in Scenario 1. We call this phenomenon a rebound effect, which also appears in other transport policy analysis ( 8 , 30 ).
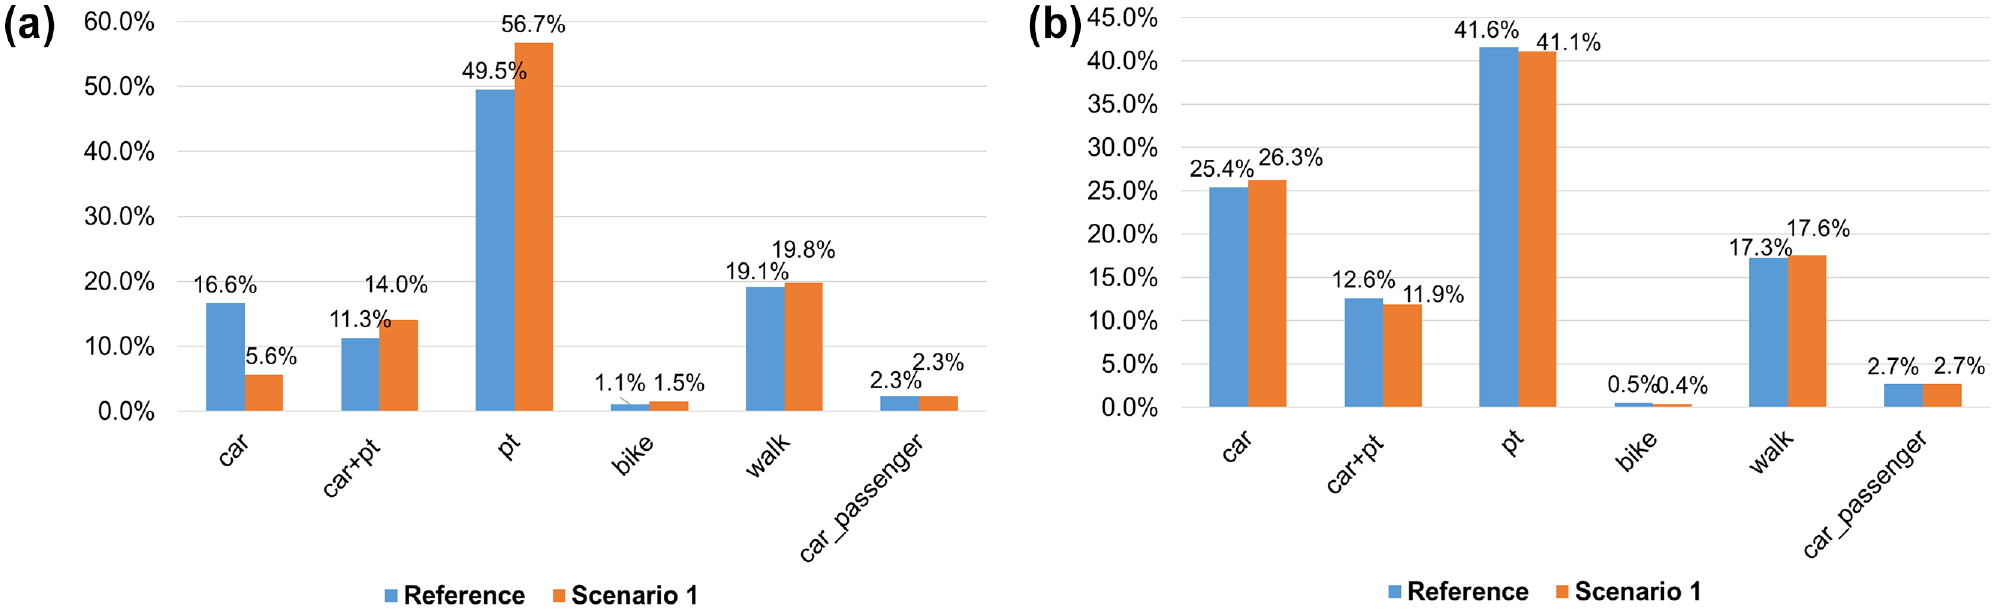
Comparison of modal shares for trips of commuters working in: (a) Zone A and (b) Zone B–Zone A.
From the above analysis, we also find that in a different analysis space, the mobility impacts of the DRZ policy are different. To analyze the scale effects, we explore further the modal share of trips that are made by residents who live in different areas. As shown in Figure 7, the residents living in Zone A use more cars (+0.4%) after implementing the DRZ in this zone (Scenario 1) or in the larger zone in Paris (Scenario 2). The better traffic conditions within the restriction zone lead to a rebound effect for residents (who are not constrained). For residents living in the area of Zone B–Zone A, the DRZ policy in the city center (Scenario 1) reduces their car use (−0.5%), and in contrast, the policy in Scenario 2 increases the car share by 1.2%. The former car decrease is because of two reasons: (1) the direct modal shift from the previous car trips that end in the policy zone (i.e., Zone A), and (2) the indirect modal shift from the extra cost of traffic detours of the previous car trips that pass through the policy zone. The latter car increase is because of the rebound effect. For the outside Zone B, the traffic detour and the modal shift play important roles in decreasing the modal share of car trips, especially by the larger-scale DRZ policy in Scenario 2, where the 2% reduced car share (from 36% to 34%) switches 1.1% to pt and 0.3% to car+pt.
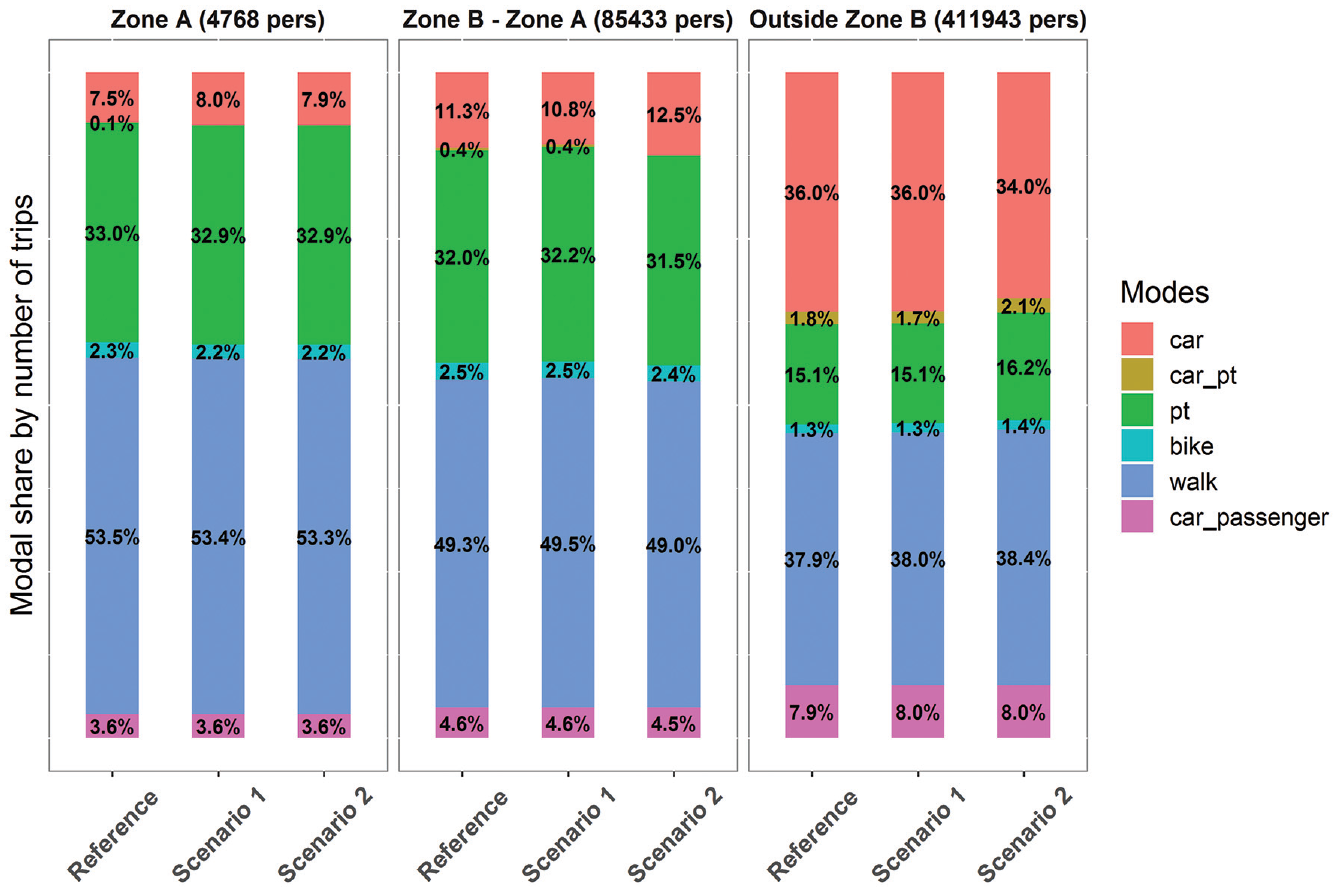
Comparison of modal shares for different scales of residents’ living area.
Environmental Impact
CO2 emissions
Variations of CO2 emissions throughout the day are illustrated at three different scales of analysis, as well as for the overall area (Figure 8). In the city center, that is, Zone A in Figure 8a, Scenario 1 reduces CO2 emissions drastically (about 85% in aggregation during the day), and Scenario 2 reduces it at a medium level (about 55%), compared with the reference scenario. In other words, the reduction of CO2 emissions in Zone A is mitigated by a rebound effect in Scenario 2, compared with Scenario 1. For the space between the city center and the Paris periphery, that is, Zone B–Zone A in Figure 8b, the reduction ratios of CO2 are 4% and 47% for the two DRZ scenarios, respectively. This implies that the DRZ policy in the city center (Scenario 1) can still reduce slightly CO2 in the adjacent districts of Paris, especially during the two peak hours. For the outside of Paris, in Figure 8c, the total CO2 volume increases a little in Scenario 1, by about 2%, whereas it reduces by 6% in Scenario 2. The increased CO2 in Scenario 1 might be caused by some traffic detours as aforementioned. That is, car users that were driving through the city center before the DRZ policy would use the Paris ring roads when the DRZ is enforced, thus increasing traffic in the periphery of Paris (Outside Zone B). This is consistent with the empirical results from Sleiman ( 5 ), which find an increase in congestion on the ring roads and a decline in air quality around this area following the closure of the riverside road section in Paris downtown. Overall, we find that CO2 emissions throughout the whole Paris region decrease more strongly when the DRZ is applied to the whole city of Paris (Scenario 2) than when it is only applied to the city center (Scenario 1), as shown in Figure 8d.
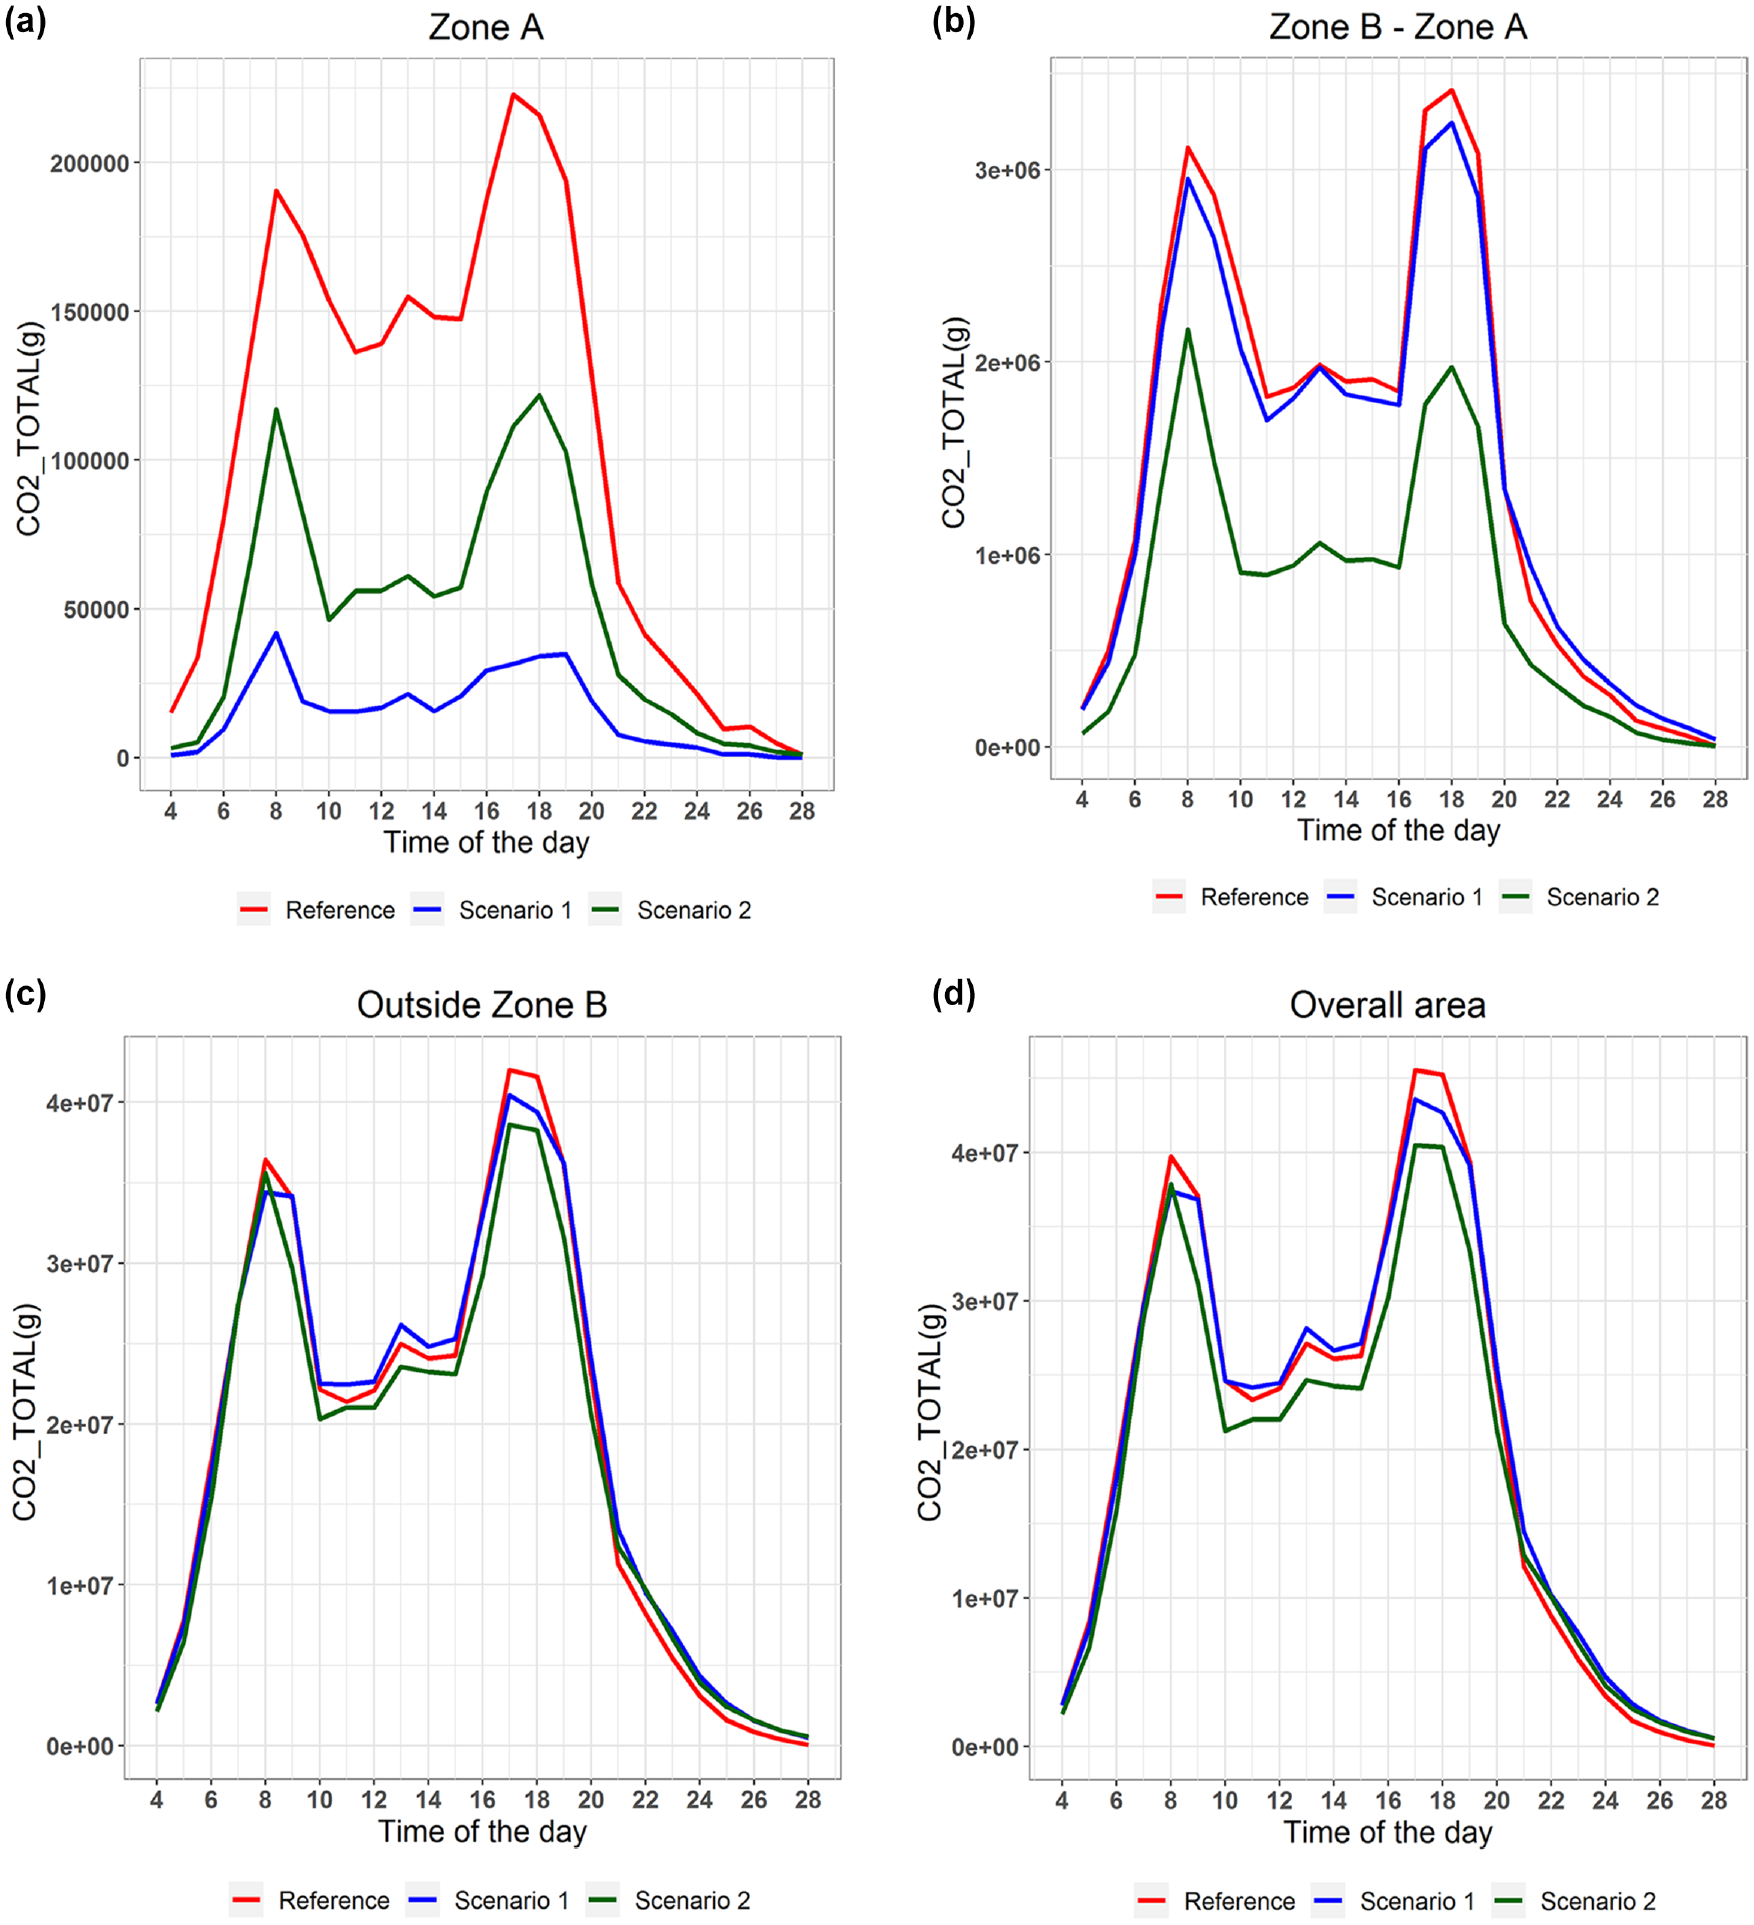
Comparison of CO2 emissions in different scales: (a) Zone A, (b) Zone B–Zone A, (c) Outside Zone B, and (d) overall area.
Air pollutants
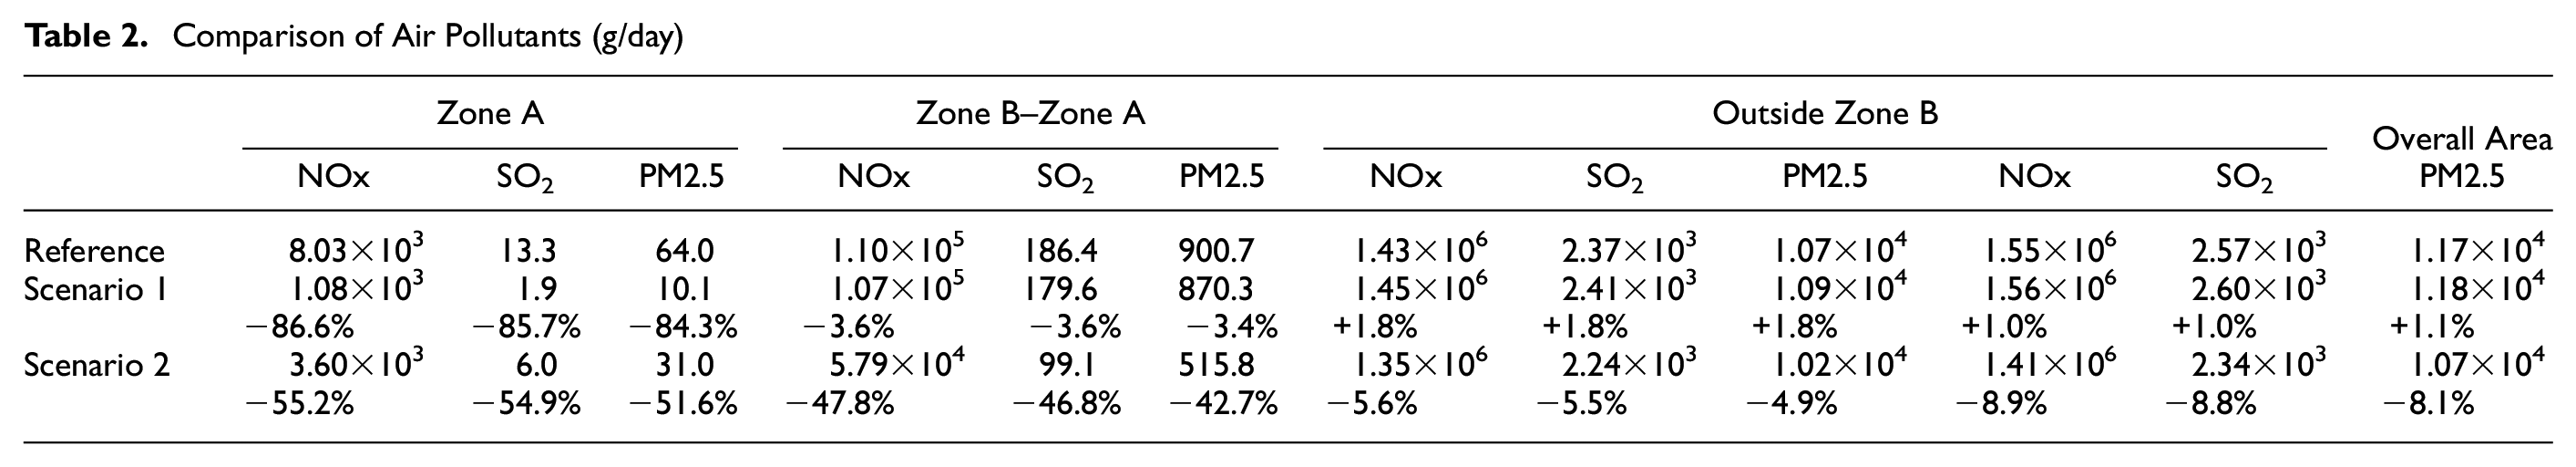
Table 2 gives the main air pollutants of nitrogen oxides (NOx), sulfur dioxide (SO2) and fine particles (PM2.5) from the three scenarios across the three scales of spatial zones, as well as the overall performance. The greatest amount of pollutants comes from NOx, followed by PM2.5 and SO2. In each analysis scale, the relative changes among the three pollutants from each DRZ scenario are more or less similar, compared with the reference scenario. On average, Scenario 1 reduces about 85% of the pollutants in Zone A, 4% in Zone B–Zone A, although it increases a little, about 2%, outside Zone B. For Scenario 2, all pollutants in the three scales are mitigated, with reduction ratios of 54%, 46%, and 5%, respectively. The scale effects on the changes of air pollutants from the two DRZ scenarios are consistent with those on CO2 emissions above. Compared with the reported air pollutants from the local air quality monitoring organization AIRPARIF, the simulated amounts of air pollutants match relatively well. For example, a 20% reduction of NO2 concentrations was observed on Sunday September 18, 2022, during the “No-vehicle day” event in Paris ( 31 ). Considering that road traffic contributes to about 56% of NOx emissions in the Paris region, and that traffic on Sundays is usually about 30% lower than on a regular weekday, the implied reduction ratio for road NOx emissions is about 46%, which is close to the NOx reduction in Scenario 2 observed inside Paris (i.e., inside Zone B).
Comparison of Air Pollutants (g/day)
Comparing the before and after implementing the DRZ policy, in Figure 9, we summarize the scale effects of the air pollutants from Scenario 1 and Scenario 2. Note that for the analysis of environmental impacts, the scale of outside Zone B only reaches 20 km away from the periphery of Paris as it covers the most urbanization area in the Paris region.
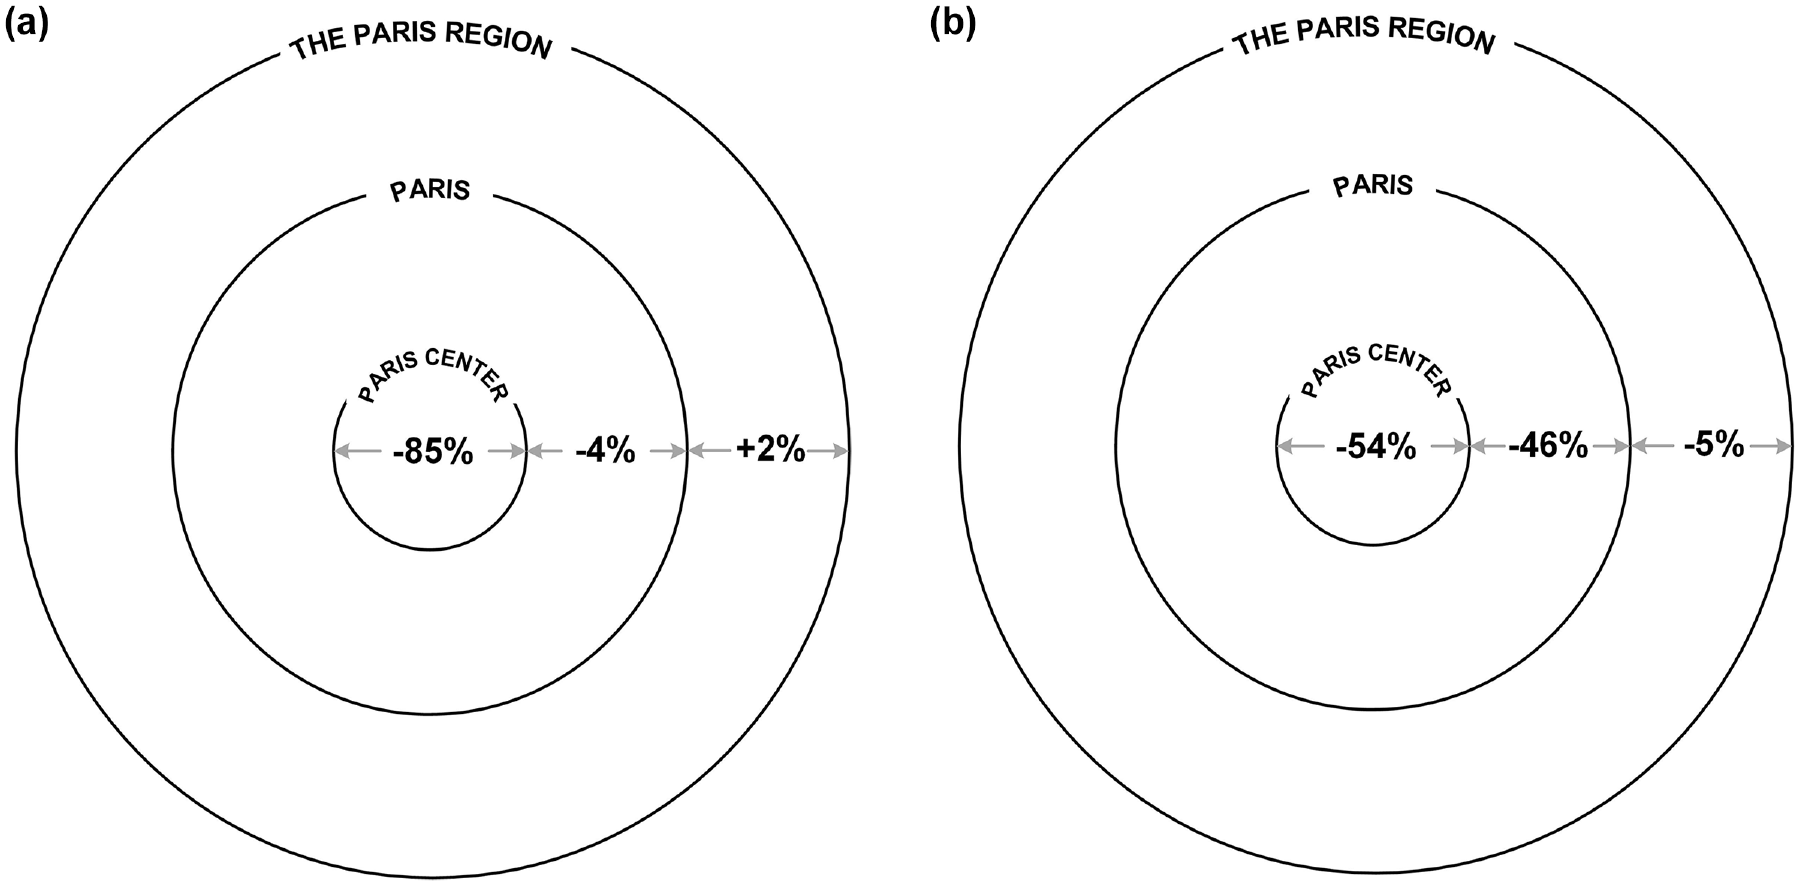
Scale effects on the air pollutants in: (a) Scenario 1 and (b) Scenario 2.
Socio-economic KPIs
Figure 10 presents the main socio-economic KPIs with a radar chart. Accordingly, in the whole Paris region, the CO2 emissions and air pollutions have significant cost reductions in Scenario 2. Besides the environmental benefits, other economic indicators are measured to evaluate the DRZ policies. The related parameters for the costs calculation are the same in Coulombel et al. ( 8 ), using the French national guides for the economic appraisal of transport projects. Compared with the baseline, the DRZ in Scenario 1 has a negligible effect on monetary costs, and in Scenario 2 they decrease by 7% in line with the reduction of vehicle kilometers traveled (VKT) on roads. User total time costs increase by 13% in both scenarios, which is consistent with the passenger travel time (PTT) of all modes as user time costs just multiply PTT by the value of travel time savings. This is because the larger DRZ scale has more effect on modal shift of car trips, leading to lower monetary costs. However, the user travel time does not decrease but increases, because of the traffic detours caused by the DRZ as well as the substitution of the fast car mode with lower speed transportation modes, that is, public transport, bike, and walk. Taking into account overall the previous costs (note that the environmental and monetary costs from transit are ignored here as they are not expected to change much between the three scenarios), the total social cost increases by about 11% if the DRZ is only in the Paris center and 10% if it applies to the whole city of Paris. This substantial increase of the social cost in connection with the DRZ policy should be heeded by policy makers, to find a proper solution to reduce the cost, especially in relation to additional travel time.
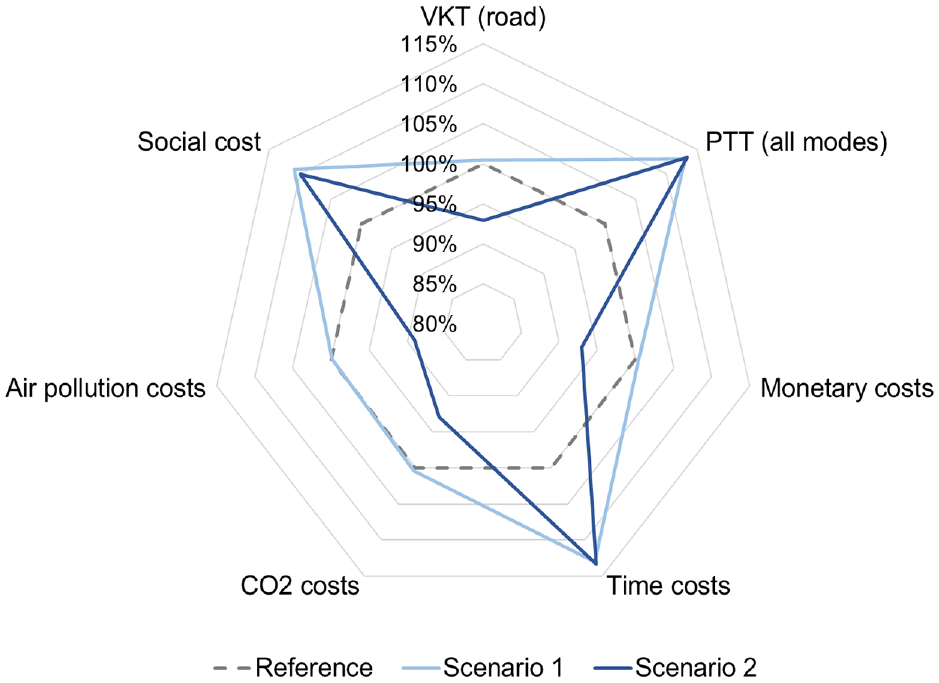
Comparison of socio-economic key performance indicators.
Discussion and Conclusions
This study mainly investigated the economic impacts of two DRZ scenarios: the projected scenario for the Paris center (Scenario 1) and the ambitious scenario for the whole inner Paris (Scenario 2). We first enriched the existing multi-agent simulation model with two integrated intermodal trips: Park-and-Walk and Park-and-Ride. Then, we compared the scenario performance on mobility, environment, and social cost. The main findings from the simulated results refer to following three aspects.
For Scenario 1, that is, the DRZ in the city center, there is very limited impact on modal shift, thus resulting in negligible environmental benefit in the Paris region. CO2 emissions even increase a little outside Paris. Moreover, this scenario is very costly for users’ travel time.
Scenario 2, that is, the DRZ inside the Paris periphery, is more effective than Scenario 1. Substantial environmental benefits in relation to CO2 emissions and air pollutants are found, especially inside Paris. The social cost (i.e., the total cost of environmental cost, time cost, and monetary cost) increases by about 10%. This is still less than the cost in Scenario 1, which is about 11%.
The impacts greatly vary among the three scales of analysis: the Paris center, between the center and the Paris periphery, and outside Paris.
For each DRZ scenario, the (co-) effect from the traffic detour, modal shift, and rebound effect can explain the reasons behind these findings. For example, in Scenario 1, the effects of modal shift and traffic detours result in less traffic in the local area, and the detoured traffic burdens arterial and periphery roads and thus the CO2 emissions increase. In Scenario 2, the modal shift is evident from cars to other modes, mainly public transport. Further, the reduced traffic in Paris leads to more local residents returning to use their cars because of the improved road condition. In this way, the effect of traffic reduction is mitigated by the rebound effect.
As social costs are both increased in the two DRZ scenarios, a four-time valuation of environmental benefits would be expected to offset the extra time cost. Ideally, we anticipate more environmental benefits and less extra time cost from auxiliary strategies with the DRZ policies, such as encouraging ridesharing and e-vehicles, improving transit accessibility, and congestion pricing.
The discovered scale effects in this study also evoke equity issues after DRZ implementation. This is even notable in the Paris region because of its star-like pattern of land use. With reference to the various scale effects, the local benefits are undoubtedly achieved. However, they are possible only with sacrifices of mobility and environment in other areas. The public needs transparency on this point. The government should provide an appropriate scheme to compensate for some negative and inequity impacts caused by the local policy. Besides, city planners may need research on the hosting in the territory (commercials, housing, and so forth) and social economists may need research on local residents’ living preference and their acceptance ( 32 ). The DRZ feasibility needs a multi-disciplinary systematic assessment.
This paper initially evaluates the DRZ impacts based on the mobility simulation using MATSim. Expected results are obtained and then explained in theory with the transportation effects. Some limitations still need to be considered for our future work. First, we only added two forms of car-related intermodality to the existing agent-based mobility model. Other types, for example, micromobility + PT, should also be generalized. Second, car-parking constraints, such as parking space capacity and parking fees, are not considered in this study. A global search for parking locations is also needed to improve the model. Third, we need to simulate a more complex case with a comprehensive DRZ policy. For example, the implemented DRZ only prohibits vehicles passing through the zone, and for people who have activities inside it driving is allowed. Other special vehicles and mobility services can also traverse the zone, such as taxis, buses, cars for persons with reduced mobility, ridesharing, emergency and rescue services.
Footnotes
Acknowledgements
The authors would like to thank Sebastian Hörl and Hao Wu for their technical support on the model programming.
Author Contributions
The authors confirm contribution to the paper as follows: study conception and design: BY, AD, and NC; data collection: BY, AD, LL, and TS; analysis and interpretation of results: BY, NC, and TS; draft manuscript preparation: BY, NC, and LL. All authors reviewed the results and approved the final version of the manuscript.
Declaration of Conflicting Interests
The author(s) declared no potential conflicts of interest with respect to the research, authorship, and/or publication of this article.
Funding
The author(s) disclosed receipt of the following financial support for the research, authorship, and/or publication of this article: This work is supported by the Chair of ParisTech-VINCI.