The flat plate slab system is widely used in construction fields due to its excellent constructability and savings in story height compared to the conventional beam-column moment-resisting system. Many researchers are, however, concerned about the punching shear failure that can happen in a two-way flat plate slab system, for which many shear-strength-enhancement techniques have been suggested. One of the effective alternatives is the application of steel-fiber-reinforced concrete. However, most previous studies on the punching shear strength of steel-fiber-reinforced concrete flat slabs had presented empirical formulas based on experimental results. On the other hand, theoretical models proposed in previous studies are difficult to be applied to practical situations. Therefore, in this study, a punching shear strength model of the steel-fiber-reinforced concrete two-way flat slab is proposed. In this model, the total shear resistance of the steel-fiber-reinforced concrete flat slab is expressed by sum of the shear contribution of steel fibers in the cracked tension region and that of intact concrete in the compression zone. A total of 91 shear test data on steel-fiber-reinforced concrete slab–column connection were compared to the analysis results, and the proposed model provided a good accuracy on estimating the punching shear strength of the steel-fiber-reinforced concrete flat slabs.
The flat plate slab structure consists of slabs and columns without any beam, which is widely used due to its considerable savings in story height and excellent constructability. Many researchers are, however, concerned about the punching shear failure that can happen in a two-way flat plate slab system, and consequently, they have suggested many alternatives for enhancing its brittle failure characteristics.1–4 Previous studies suggested the use of conventional shear reinforcement, shear head steel, shear stud, helix reinforcement, and lattice reinforcement to enhance the punching shear capacity of flat slab structures.5–10 Many recent studies suggested instead the use of steel-fiber-reinforced concrete (SFRC) in the entire slab or partial area around the column near the slab–column connection.3,4,11–14 This is based on many test results of SFRC flat slabs, in which their punching shear strength and deformation capacity were markedly improved compared to the conventional reinforced concrete (RC) flat plate slabs.
Although many experimental studies have been conducted on the punching shear strength of SFRC flat plate slabs, concise theoretical models for assessing the punching shear strength during the design process are still very limited. As shown in Table 1, there are few models for estimating the punching shear strength of SFRC flat plate slabs proposed in previous studies.3,15,16 Narayanan and Darwish15 derived a semi-empirical equation for the punching shear strength of SFRC slabs, based on their experimental observations, considering the splitting tensile strength of the SFRC (), shear contribution of the steel fiber (), longitudinal reinforcement ratio (), and perimeter of the critical section of the SFRC slab (). In their approach, the perimeter of the critical section decreases as the fiber factor () increases, and the effect of the longitudinal tension reinforcement ratio was also directly reflected. Harajli et al.16 determined the enhancement of punching shear strength due to the steel fibers based on their regression analysis of test data and proposed a punching shear strength equation for SFRC flat slabs, in which the calibrated shear contribution of the steel fibers was simply added to the punching shear contribution of concrete section. This model is easy to use because of its simple form, but it does not consider the bond characteristics of SFRC, depending on the length or shape of steel fibers. Recently, Choi et al.3 proposed a punching shear strength model based on a simple one-parameter plasticity model, that is, the Rankine criteria,17 and adopting the concept of their previous study,18 in which they treated the uncracked concrete in the compression zone as the main source of punching shear resistance in the flat slabs significantly damaged by flexure. In this model, the shear strength provided by steel fibers at the cracked tension zone is estimated by the post-cracking tensile strength of the SFRC as proposed by Naaman and Reinhardt,19 and the size effect is considered by adopting the size effect factor () specified in the British Standards (BS) Code20 for conventional RC members. However, as reported in recent studies,21,22 the size effect in SFRC members can be significantly reduced, compared with conventional concrete members, by the steel fibers mixed in concrete. Therefore, direct application of the value used in RC members to SFRC members is unreasonable. Indeed, the test data of SFRC flat slab specimens collected by Choi et al. for their model verification were all less than 400-mm deep, and consequently, the estimated values were actually greater than 1.0 for all specimens.
Summary of the existing punching shear strength models for SFRC slabs.
is a factor which depends upon the depth of the slab (= 1.40); ; is the vertical fiber-pull-out stress along the inclined crack (= ); = average fiber–matrix interfacial bond stress, taken as ; .
, whichever is the smallest; is the ratio of the long side to the short side of column; = 40 for interior columns, 30 for edge columns, and 20 for corner columns.
is a size effect factor (= ); ; ; ; ; .
The aim of this study is to develop an accurate but concise and practical punching shear strength model for SFRC flat slabs with a theoretical basis. In the proposed model, the shear contribution of the uncracked concrete in the compression zone comes from the plasticity model of concrete and the concept of equivalent shear stress block, and the shear contribution of the steel fibers is determined by the direct tensile force transfer model (DTFTM), which considers the bond behavior of steel fibers and the pull-out failure mechanism.23–26 The proposed model is also verified by comparing with the test results of SFRC slab–column connections collected from the literature.1,11–14,16,27–31 In addition, the relation between the shear contribution of the undamaged concrete in the compression zone and that of the steel fibers in the tensile zone is also discussed in detail.
Simple punching shear strength model
As shown in Figure 1(a), the shear transfer mechanism of the SFRC flexural member without shear reinforcement is composed of the shear contribution of the uncracked concrete in the compression zone (), the aggregate interlock at the crack interface (), the dowel force transmitted across the crack by the flexural reinforcement (), and the shear force resisted by the steel fibers at the crack interface ().22 Therefore, the punching shear strength of SFRC flat plate slabs without shear reinforcement () can be expressed as follows
Shear resistance mechanism of SFRC members: (a) SFRC beam and (b) SFRC flat plate slab.
Because the flat plate slab has a very large span-to-height ratio (), its behavior is dominated by flexural deformation.3 In other words, because a sufficient flexural behavior mechanism is fully developed before punching shear failure occurs in a flat plate structure, a reliable contribution of shear resistance by the aggregate interlock mechanism is unlikely. Moreover, the shear contribution provided by the dowel force can be ignored because the concrete that covers flat plate slabs is generally thin.3,15 Therefore, as shown in Figure 1(b), considering only the shear contribution of the concrete compression zone () and that of the steel fibers () at the crack interfaces, the punching shear strength of SFRC flat plate slabs () can be rewritten in a simple form as follows
To estimate using equation (2), the neutral axis depth (), the shear cracking angle (), and the perimeter of the critical section of the SFRC slab () should be determined, which are described in the following section.
Shear contribution of the uncracked compression zone
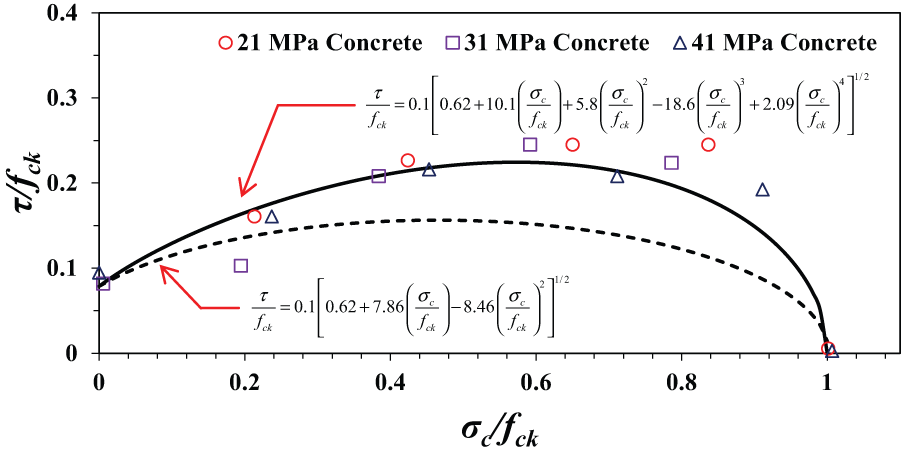
The punching shear failure in a two-way flat plate slab generally occurs under somewhat complicated states of combined stresses rather than simple uniaxial stress states. Thus, to estimate the punching shear strength realistically, the failure criterion of concrete subjected to multi-axial stresses should be used. In order to establish the failure criterion of plain concrete under combined stresses, Bresler and Pister32 conducted sophisticated experiments on circular specimens subjected to axial compression and torsional stresses. They proposed a correlation between the normal stress and shear stress of a concrete element based on a three-parameter plasticity model. As shown in Figure 2, their experimental results were approximated by a quadratic parabola, as represented by the thick line. The lower bound of the test data is also shown by the dotted line in the graph. In this study, the shear contribution of the uncracked concrete in the compression zone was taken as the lower bound of the test data to provide a proper safe margin as follows
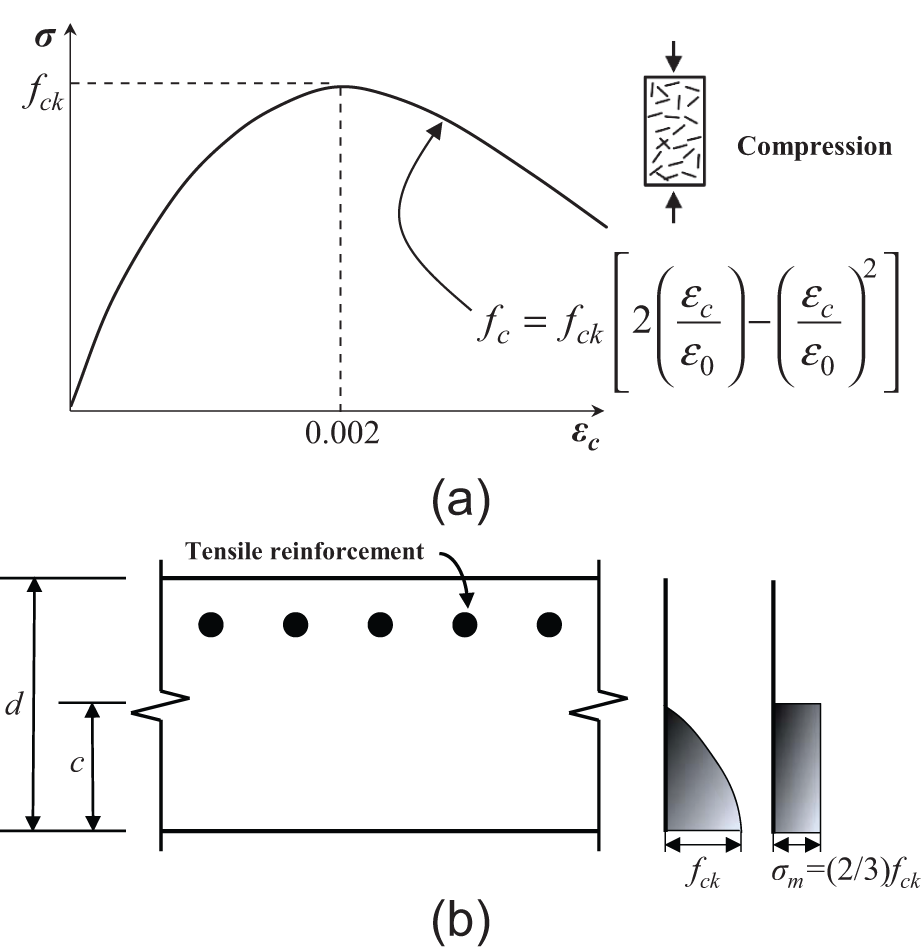
where is the uniaxial compressive stress, is the maximum shearing stress on the outer surface of the cylinder specimen, and is the specified compressive strength of the concrete. As shown in Figure 3, the compressive stress () at punching shear failure has a nonlinear distribution over the depth of the compression zone. Dinh et al.22 simplified the nonlinear distribution of concrete stress in the compression zone using the equivalent average compressive stress block and determined the corresponding value of the average shear stress in the compression zone. In this study, the concept of equivalent shear stress block, proposed by Dinh et al.,22 is adopted. Kinnunen and Nylander33 reported that the compressive strain at the extreme compression fiber of a critical perimeter was approximately −0.002 at punching failure near a slab–column connection, and Choi et al.3 also adopted this assumption. In this study, the punching shear failure is similarly assumed to occur when the compressive strain at the extreme compression fiber of the critical perimeter reaches −0.002, and the Collins model illustrated in Figure 4(a)34 is used for the constitutive compressive stress–strain relationship of concrete, as follows
Shear–compression strength (Bresler and Pister, 1958).
Equivalent rectangular shear stress block.
Concrete in compression: (a) the stress–strain relationship34 and (b) the equivalent rectangular stress block.
Here, is the concrete compressive strain, and is the compressive strain at the specified compressive strength of the concrete, which was set to 0.002 in this study.13,29,30,33 Thus, the magnitude of the equivalent compressive stress block (i.e. the average compressive stress, ) can be estimated as follows
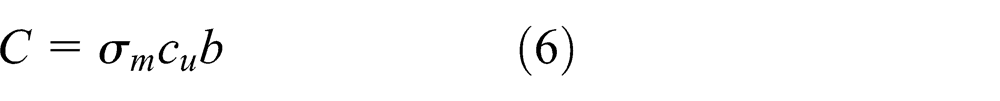
As shown in Figure 4(b), the resultant compression force () can then be calculated as
where is the depth of the neutral axis and is the cross-sectional width of the member (mm). By substituting the average compressive stress () determined by equation (5) into the constitutive model presented in equation (3), the shear strength of the concrete subjected to compressive stress () can be estimated. Thus, the average shear stress of the uncracked compression zone at punching shear failure () can be expressed as follows
On this basis, the shear contribution of the intact concrete in the compression zone () can be expressed as follows
where is the perimeter of the critical section of the SFRC flat plate slab, and is the neutral axis depth at the ultimate state.
Adopting the linear elastic and perfectly plastic behavior of the tensile stress–strain relationship of flexural tension reinforcement, and assuming yielding of flexural reinforcement at punching shear failure, which will be checked soon, the tension force () developed in reinforcement is
where is the sectional area of the longitudinal tension reinforcement; is the yield strength of the longitudinal reinforcement; is the longitudinal reinforcement ratio (); and is the distance from the extreme compression fiber to the centroid of the longitudinal reinforcement. Based on the force equilibrium condition at the cross section, the neutral axis depth at the ultimate state () can be simply estimated as follows
Table 2 shows the material and dimensional properties of the SFRC flat plate slab specimens collected from previous studies.1,11–14,16,27–31 To verify the applicability of equation (10), which was derived from the assumption of yielding of longitudinal reinforcement, the normalized strains () were plotted in Figure 5 with respect to the compressive strength of concrete and longitudinal reinforcement ratio. In order to get this graph, the neutral axis depths of all collected specimens were calculated using equation (10), and the strain in tension reinforcement () was estimated at the extreme compression fiber when the compressive strain is −0.002. Then, the estimated reinforcement strains () were normalized by the actual yielding strain () reported in the original references. With the exception of seven specimens, most of 91 total specimens showed greater tensile strains in tension reinforcement than their yield strains (). The estimated strain of the tension reinforcement was slightly lower than the yield strain () even for the seven exceptional specimens; these cases are limited to SFRC flat plate specimens with a significantly low compressive strength of concrete () and a high tension reinforcement ratio () only, which are not in the range of realistic design. Therefore, the yielding of flexural reinforcement would be a valid assumption for most of SFRC flat plate slabs in most practical design cases.
Key variables of SFRC slabs specimens.
Investigator(s)
Number of specimen
Fiber type
(%)
(MPa)
(mm)
(%)
Cheng and Parra-Montesinos (2010)
8
Hooked, twisted
1–1.5
54.55–78.95
25.4–59.3
127
0.56–0.83
Nguyen-Minh et al. (2011)
9
Hooked
0.38–0.76
80
27.9–31.6
105
0.66
Tan and Paramasivam (2010)
14
Hooked
0.31–2
60
35–65
13.75–43.75
0.87
Swamy and Ali (1982)
12
Crimped, plain, hooked
0.6–1.2
83.3–100
34.3
105
0.33–0.66
Theodorakopoulos and Swamy (1993)
16
Paddle, crimped, hooked, Japanese
1
59.8–100
12.5–33.5
100
0.37–0.56
Harajli et al. (1995)
8
Hooked
0.45–2
60–100
20–31.8
39–55
1.12
Alexander and Simmonds (1992)
4
Corrugated
0.39–0.87
29
35–38.5
111–138
0.43– 0.54
McHarg et al. (2000)
2
Hooked
0.5
60
39
117
1.04–2.03
Shaaban and Gesund (1994)
9
Corrugated
0.36–1.16
20.89
22.06–46.75
59.55
1.57
Naaman et al. (2007)
3
Twisted
2
100
69.6
110–115
0.62–0.65
De Hanai and Holanda (2008)
6
Hooked
0.75–2
54.55
24.4–59.7
75
1.57
Total
91
0.31–2
20.89–100
12.5–69.6
13.75–138
0.33–2.03
SFRC: steel-fiber-reinforced concrete.
Normalized strain of flexural tensile reinforcement (a) according to the compressive strength of concrete and (b) according to the reinforcement ratio.
Figure 6 shows the position of the critical shear cracks observed in the experiments conducted by Narayanan and Darwish.15 The critical sections of the SFRC slabs are located closer to the column face than the RC slab (i.e. the case with Vf = 0) as the volume fraction of steel fiber increases, that is, as the fiber factor increases. Based on this experimental observation, Narayanan and Darwish15 presented the perimeter length of the critical section () of the SFRC flat plate slab as follows
where is the perimeter length of the column, is the fiber factor (), is the volume fraction of the steel fibers, and are the diameter and length of the steel fibers, respectively, and is the bond factor of the steel fibers. In this study, equation (11), proposed by Narayanan and Darwish,15 is also adopted to determine the critical perimeter of the SFRC flat plate slab, and the minimum value of in equation (11) is limited to for preventing further reduction of the critical perimeter when is more than 1.0, which is approximately half the value of the critical perimeter of the RC flat plate slab.
Propagation of punching shear cracks in SFRC slab specimens (Narayanan and Darwish, 1987).
Shear contribution of steel fibers at the crack interface
As shown in Figure 7(a), the shear force contribution of steel fibers () can be estimated from the vertical component of the tensile forces developed in the steel fibers at the crack interface (). This can be expressed as follows
in which can be calculated as follows
Resistance mechanism of steel fibers at the crack interface: (a) shear contribution of steel fibers, (b) shape factors of steel fibers, and (c) description of fibers between cracks.
Here, the average maximum bond strength of the steel fiber () at the crack surface is estimated by the DTFTM, which can be found in authors’ previous studies.23,24
The DTFTM is a sophisticated analysis model that converts the randomly distributed steel fibers at the crack surface into the direct tensile force resistance elements in the direction perpendicular to the crack interfaces. Thus, this model can theoretically consider the bond characteristics of the steel fibers. The steel fibers in concrete mostly lose their resistance capacity by the pull-out failure before they reach their ultimate tensile strength (). In such cases, the maximum tensile stress in the steel fibers can be defined at the point where the maximum bond stress is developed between the steel fibers and surrounding concrete. Therefore, the maximum tensile stress of the steel fibers at the crack interfaces () can be calculated as follows
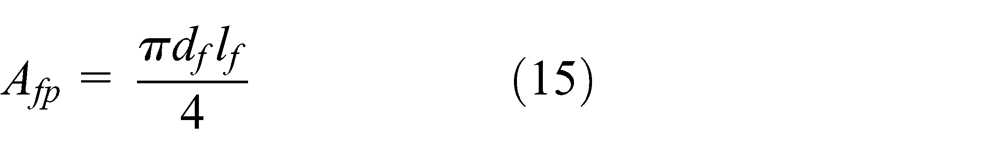
where is the ultimate bond strength of the steel fiber, is the surface area of a steel fiber, is the number of steel fibers across the crack, and is the cross-sectional area of the inclined crack surface. A value of is used for the ultimate bond stress of the steel fiber (), which was suggested by Voo and Foster,35 and is the tensile strength of plain concrete (). As shown in Figure 7(b), the bond factor () was set to 1.0, 0.75, and 0.5 for hook-shaped, crimp-type, and straight-type fibers to consider the differences in the maximum bond strengths of the steel fibers.23–26 Because it is difficult to accurately determine the effective embedded length of the steel fibers at the crack surface, the average bond length is assumed to be one-fourth of the fiber length in the DTFTM,23,24 as shown in Figure 7(c). The surface area of a steel fiber () at the crack surface can then be expressed as follows
In addition, the effective number of steel fibers across the crack () can be calculated by
where is the sectional area of a steel fiber. The maximum tensile stress in the steel fiber () defined in equation (14) can be written as follows
Thus, the punching shear strength of the SFRC flat plate slab () can be arranged as follows
where , , and can be determined by equations (10), (11), and (17), respectively. In previous studies,4,15,28 the cracking angle of the conventional RC slab is reported to range from 25° to 30° and that of the high-performance concrete slab from 30° to 40°. SFRC members tended to have higher crack angles as the fiber factor () increased, and the shear crack angles of the SFRC slab were mostly higher than those of RC slabs.15 On the basis of such experimental observations, in this study, the punching shear crack angle of the SFRC flat plate slab () is assumed as 35° to simplify the calculations.
Verification of the proposed model
To verify the accuracy of the punching shear strength model for the SFRC flat plate slab proposed in this study, the test results of 91 specimens, as shown in Table 2, were collected from a total of 11 references.1,11–14,16,27–31 The collected test data include a wide range of test variables. The volume fraction of the steel fiber () of the specimens ranged from 0.31% to 2.00%, the aspect ratio of the steel fiber () from 20 to 100, the specified compressive strength of the SFRC () from 12.5 to 69.6 MPa, the distance from the extreme compression fiber to the centroid of the tension reinforcement () from 13.7 to 138.0 mm, and the longitudinal reinforcement ratio () from 0.33% to 2.03%. The collected specimens also had various types of steel fibers including hooked, twisted, crimped, paddle, and plain-type fibers. In this study, the bond factor () used was 1.0 for the hooked, twisted, paddle, and Japanese types; 0.75 for the corrugated and crimped types; and 0.5 for the plain type of steel fibers.
Figure 8 compares the test results and the punching shear strengths estimated by the existing and proposed models for each specified concrete compressive strength () of the specimens. For easy comparison, the estimated punching shear strengths () were divided by the measured capacities (). In Table 3, the average, standard deviation (SD), and coefficient of variation (COV) of the values estimated by the existing and proposed models are also shown. The proposed model provided the most accurate assessment of the punching shear strengths of the specimens among all the models compared in this study. The punching shear strength model proposed by Narayanan and Darwish15 and Choi et al.3 gave unconservative estimates. The model by Choi et al.,3 however, provided better results when a size effect factor of 1.0 was used in the calculations, that is, when the size effect is ignored, as shown in Table 3. This is because most of the specimens collected here were less than 400 mm in depth, for which the size effect factor, specified in BS811020 and adopted by Choi et al.,3 provided the values greater than 1.0.
Comparison of test results and punching shear strengths estimated by existing and proposed models: (a) Narayanan and Darwish, (b) Harajli et al., (c) Choi et al., and (d) proposed model.
Evaluation results of punching shear strength models.
SD: standard deviation; COV: coefficient of variation.
is the size effect factor, .
Figures 9 and 10 show the punching shear strength contribution ratio of the concrete () calculated by the existing and proposed models versus the compressive strength of the SFRC () and the fiber factor (), respectively. The shear contribution provided by the uncracked compression zone () and the steel fibers () can be determined separately using the proposed model in this study and the model proposed by Choi et al.3 For Narayanan and Darwish’s model,15 the punching shear strength provided by the concrete was determined by adding the shear contribution of the concrete in the compression zone and that of the tensile reinforcement []. However, the model suggested by Harajli et al.16 makes it difficult to separately calculate the shear contribution of the concrete and that of the steel fibers, and thus, it was excluded in the comparisons shown in Figures 9 and 10. In the model proposed by Choi et al.,3 the shear strength contribution of the concrete in the compression zone relative to the total shear strength () showed a high average percentage of 80%. On the other hand, the proposed model and the model by Narayanan and Darwish15 showed average percentages of 45% and 52%, respectively, which are similar. In all models shown in Figures 9 and 10, the shear contribution of concrete tended to decrease as the fiber factor increased. In the model by Choi et al.,3 however, the contribution of the uncracked compression zone showed a linear decrease as the fiber factor increased, while the model by Narayanan and Darwish15 and the proposed model showed a nonlinear decrease. In addition, the model by Choi et al. estimated that the compression zone provided most of the shear resistance. In contrast, in the models proposed in this study and Narayanan and Darwish,15 the shear resistance provided by the steel fibers across the crack () mainly contributed to the total punching shear strength () when the fiber factor () was greater than 0.5.
Effect of the compressive strength of SFRC on the punching shear contribution of concrete: (a) Choi et al. versus proposed model and (b) Narayanan and Darwish versus proposed model.
Effect of fiber factor on the punching shear contribution of concrete: (a) Choi et al. versus proposed model and (b) Narayanan and Darwish versus proposed model.
Figure 11(a)–(d) shows the shear strength ratios () estimated by the proposed model versus the longitudinal reinforcement ratio (), the aspect ratio of steel fibers (), the fiber factor (), and the volume fraction of steel fibers (). It is shown that the proposed model estimates the punching shear strength of the SFRC slabs with a consistent accuracy for all the main influential parameters without any bias.
Performance of the proposed punching shear strength model: (a) versus reinforcement ratio, (b) versus the aspect ratio of steel fibers, (c) versus the fiber factor, and (d) versus the volume fraction of steel fibers.
Conclusion
In this study, the punching shear strength model for SFRC flat plate slabs was developed by considering the shear contribution of the concrete in the compression zone and that of the steel fibers at the crack interface. A database of test results on SFRC slab–column connections was established and used for examining the performance of the proposed model. From this study, the conclusions can be drawn as follows:
A punching shear strength model for SFRC flat plate slabs was proposed by considering the depth of the neutral axis, the crack angle, the shear contribution of the uncracked concrete in the compression zone, the steel fibers at the crack surface, and the change in length of the critical perimeter according to the fiber factor. Because the proposed model is very simple, it is expected to be useful in practical application.
The proposed model can suitably consider the unique material characteristics of the SFRC, such as the volume fraction of steel fibers as well as the length, diameter, and shape of steel fibers. In addition, it also enables separate calculations of the shear contribution of the concrete and the steel fibers.
The proposed model showed a nonlinear decrease in the shear contribution of the concrete in the compression zone () to the total punching shear strength () as the fiber factor () increased. When the fiber factor () was above 0.5, the shear contribution of the steel fibers at the crack interface () to the total punching shear strength () was predominant.
Compared with other punching shear strength models studied in this article, the proposed model most accurately assessed the punching shear strengths of the 91 specimens in the database. It also provided punching shear strengths with a consistent accuracy in all aspects without any bias with respect to key variables such as the longitudinal reinforcement ratio (), the aspect ratio of steel fibers (), the fiber factor (), and the volume fraction of steel fibers ().
Footnotes
Appendix 1
Academic Editor: Yu-Fei Wu
Declaration of conflicting interests
The authors declare that there is no conflict of interests regarding the publication of this paper.
Funding
This work was supported by the 2014 Research Fund of the University of Seoul.
References
1.
ChengMYParra-MontesinosGJ. Evaluation of steel fiber reinforcement for punching shear resistance in slab–column connections—part I: monotonically increased load. ACI Struct J2010; 107: 101–109.
2.
ChengMYParra-MontesinosGJ. Evaluation of steel fiber reinforcement for punching shear resistance in slab-column connections—part II: lateral displacement reversals. ACI Struct J2010; 107: 110–118.
3.
ChoiKKTahaMMRParkHG. Punching shear strength of interior concrete slab–column connections reinforced with steel fibers. Cement Concr Compos2007; 29: 409–420.
4.
ChoiKKParkHGKimHM. Shear strength model for slab–column connections. J Korea Concr Inst2012; 22: 585–593.
5.
ACI Committee 318. Building code requirements for structural concrete (ACI 318M-08) and commentary. Farmington Hills, MI: American Concrete Institute, 2011.
6.
CorelyWGHawkinsNM. Shearhead reinforcement for slabs. ACI J Proc1968; 65: 811–824.
7.
KangTHKWallaceJW. Dynamic responses of flat plate systems with shear reinforcement. ACI Struct J2005; 102: 763–773.
8.
KangTHKWallaceJW. Punching of reinforced and post-tensioned concrete slab–column connections. ACI Struct J2006; 103: 531–540.
McHargPJCookWDMitchellD. Benefits of concentrated slab reinforcement and steel fibers on performance of slab–column connections. ACI Struct J2000; 97: 225–234.
BS 8110:1997. Structural use of concrete part 1: code of practice for design and construction (British Standards Institution).
21.
DinhHH. Shear behavior of steel fiber reinforced concrete beams without stirrup reinforcement. PhD Dissertation, University of Michigan, Ann Arbor, MI, 2009.
22.
DinhHHParra-MontesinosGJWightJK. Shear strength model for steel fiber reinforced concrete beams without stirrup reinforcement. J Struct Eng ASCE2011; 137: 1039–1051.
23.
KimKSLeeDHHwangJH. Shear behavior model for steel fiber-reinforced concrete members without transverse reinforcement. Compos B2012; 43: 2324–2334.
24.
LeeDHHwangJHJuHJ. Nonlinear finite element analysis of steel fiber-reinforced concrete members using direct tension force transfer model. Finite Elem Anal Des2012; 50: 266–286.
25.
HwangJHLeeDHKimKS. Evaluation of shear performance of steel fibre reinforced concrete beams using a modified smeared-truss model. Mag Concr Res2012; 65: 283–296.
26.
JuHLeeDHHwangJH. Torsional behavior model of steel fiber-reinforced concrete members modifying fixed-angle softened-truss model. Compos B Eng2013; 45: 215–231.
TheodorakopoulosDDSwamyN. Contribution of steel fibers to the strength characteristics of lightweight concrete slab–column connections failing in punching shear. ACI Struct J1993; 90: 342–355.
De HanaiJBHolandaKMA. Similarities between punching and shear strength of Steel Fiber Reinforced Concrete (SFRC) slabs and beams. Rev Ibracon Struct Mater2008; 1: 1–16.
BreslerBPisterKS. Strength of concrete under combined stresses. ACI J Proc1958; 55: 321–345.
33.
KinnunenSNylanderH. Punching of concrete slabs without shear reinforcement (Transactions no. 158). Stockholm: Royal Institute of Technology, 1960, p.112.
VooJYLFosterSJ. Variable engagement model for fibre reinforced concrete in tension. UNICIV report no. R-420, June2003. Sydney, NSW, Australia: University of New South Wales, p.86.