
Abstract
FRP-concrete-steel tubular (FCS) composite columns are composed of the external tube, the internal steel tube, and the concrete between both tubes. They have been attracting the attention of many researchers due to their high ductility, lightweight, resistance to corrosion, and easiness of construction. However, there are few studies on FRP-concrete-steel tubular composite columns under eccentric load. To investigate the behavior of composite columns under the eccentric compression, a non-linear analysis program for FCS composite columns was compiled. The program was verified by existing tests, and the influences of eccentricity, FRP tube wall thickness, steel tube wall thickness, steel tube radius, slenderness ratio, and concrete strength grade on the eccentric compression performance were systematically analyzed. The results showed that the calculated results were in good agreement with the experimental results. It showed that the program can accurately reflect the deformation of FCS composite columns under various loads and estimate the ultimate load of FCS composite columns under eccentric compression. The eccentric ultimate load increased with the decrease of eccentricity and slenderness ratio, and with the increase of FRP tube wall thickness, steel tube wall thickness, and concrete strength grade. The ultimate eccentric load decreased with the increase of steel tube radius, but when the steel tube wall thickness reached a certain thickness, the ultimate eccentric load of FCS composite columns increases with the increase of steel tube radius. The conclusion can provide reference for the practical application of the structure.
Keywords
Introduction
Fiber reinforced polymer (FRP) has attracted the attention of many experts and scholars in recent years because of its light weight, high strength, and strong corrosion resistance. Various forms of FRP composite materials are developing rapidly.1,2 In particular, the FRP tube concrete structure formed by pouring concrete can partially replace steel and be used in high-rise buildings, bridge piers, and other civil engineering.3–6 FRP tube provides circumferential restraint to concrete, which effectively improves the compressive capacity of concrete. Also, FRP tube can be used permanent formworks for casting concrete to eliminate additional formworks and accelerate construction works.
In recent years, experts and scholars have proposed a variety of structures composed of FRP tubes, including FRP tube solid concrete column (Figure 1(a)) and FRP tube hollow concrete column (Figure 1(b)). Professor Teng 7 proposed a new type of FRP-concrete-steel tube composite column, which is composed of FRP tube, inner steel tube, and concrete poured between two tubes (Figure 1(c)).This kind of composite member has the advantages of light weight, simple structure of beam column joint, convenient construction, good ductility, good fire resistance, and corrosion resistance of confined concrete. Compared to FRP confined solid concrete columns, FRP-concrete-steel tubular composite columns (FCSCC) can effectively reduce the self-weight of the structure, and the existence of steel tubes can effectively improve the ductility and the seismic performance of the structure. During the construction, the steel tubes can be connected with the reinforcement of the beam and slab, and can also bear a part of the construction load. Compared to FRP confined hollow concrete columns, both the FRP tube outside and the steel tube inside can effectively confine the sandwich concrete, which allows the full-performance of concrete and enhances the carrying capacity and the deformation property of columns. The external GFRP tube and the internal steel tube can serve as formworks for pouring concrete during construction, which eliminates the process of formwork erection and removal.

Sectional types of FRP composite columns: (a) solid FRP composite column, (b) hollow FRP composite column, and (c) FRP-concrete-steel tube composite column.
At present, the research on FRP tube-concrete-steel tubular composite columns are mainly about its axial compression performance, bending performance, and seismic performance. The axial compression and bending properties of this new type of structure were systematically studied by Yu et al.8,9 and Teng et al. 10 The results of axial compression test showed that the thickness of FRP tube had an important influence on the mechanical properties of composite columns, and the buckling delayed or non buckling of internal steel tubes was delayed. The load displacement curve of the composite column was similar to that of FRP constrained solid concrete composite column, while when the void ratio and the ratio of diameter to thickness of steel tube are within a certain range, the mechanical properties of the internal concrete were very similar to those of FRP confined solid concrete. The experimental results showed that the ductility of the composite members were very good. The mechanical properties of the offset inner steel tube were better than that of the concentric inner steel tube. The relative slip between the steel tube and the concrete was accompanied by the fluctuation of load.
Qian and Liu 11 conducted axial compression tests on three FRP concrete steel double wall hollow tubular long columns. The results showed that the larger the slenderness ratio was, the smaller the deformation capacity and bearing capacity of composite columns were. Through analyzing the data of relevant tests, the formula of axial compression bearing capacity of composite columns was finally proposed. Qian and Liu12,13 also conducted the seismic test of nine FRP concrete steel double wall hollow tubular columns and two concrete steel hollow tubular columns. The results showed that there were three different failure modes of double wall hollow columns, and the deformation capacity of composite columns increased and decreased with the increase of fiber eigenvalue and axial compression ratio, respectively. Han et al. 14 conducted eight hysteretic tests of FRP concrete steel double walled columns, mainly studied the effects of axial force level and fiber layers of FRP tubes on the strength, durability, stiffness, and energy dissipation of composite columns. The results showed that the composite columns exhibited a high level of energy dissipation before FRP fracture. The existence of axial force can improve the ductility of composite columns.
The above research shows that the current research on FRP tube-concrete-steel tubular composite columns involves axial compression performance, flexural performance and seismic performance, and the main research parameters are section hollow ratio, FRP thickness, column length, and so on. On the whole, the composite columns show good performance. The different materials in the composite columns can cooperate with each other directly and give full play to the advantages of the composite columns. In practical engineering, due to the uncertainty of load position, construction deviation, and material defects, eccentric compression columns may be formed. Therefore, eccentric compression is the main form of FRP-concrete-steel tube composite column in practical engineering. For this reason, it is very important for engineering application to master its mechanical performance and general rule. Therefore, it is necessary to study the eccentric compression behavior of FRP concrete steel tube (FCS) composite columns. In this paper, the fiber model method15,16 is used to develop a nonlinear analysis program to systematically study the eccentrically loaded performance of FCS composite columns. The program is verified by the existing tests. Based on the correct program, the influence of FRP tube, steel tube wall thickness, concrete strength grade, void ratio, and eccentricity on the load-deformation curve of FCS composite column is analyzed.
Nonlinear analysis of eccentric compression
Basic assumption
The nonlinear computational program is based the following assumptions:
The cross-section strain accords with the assumption of plane section;
Steel tube is an ideal elastic-plastic material;
The two ends of the composite column are hinged, and the deflection curve is sine half wave curve;
There is no relative slip between FRP tube, concrete, and steel tube;
The stress-strain relationships of FRP tube, concrete, and steel tube are known.
Constitutive relation
Constitutive relation of concrete
Compressive constitutive relation of concrete
This paper selects the stress-strain relationship model of two-stage FRP confined concrete proposed by Lam and Teng, 17 as shown in Figure 2.
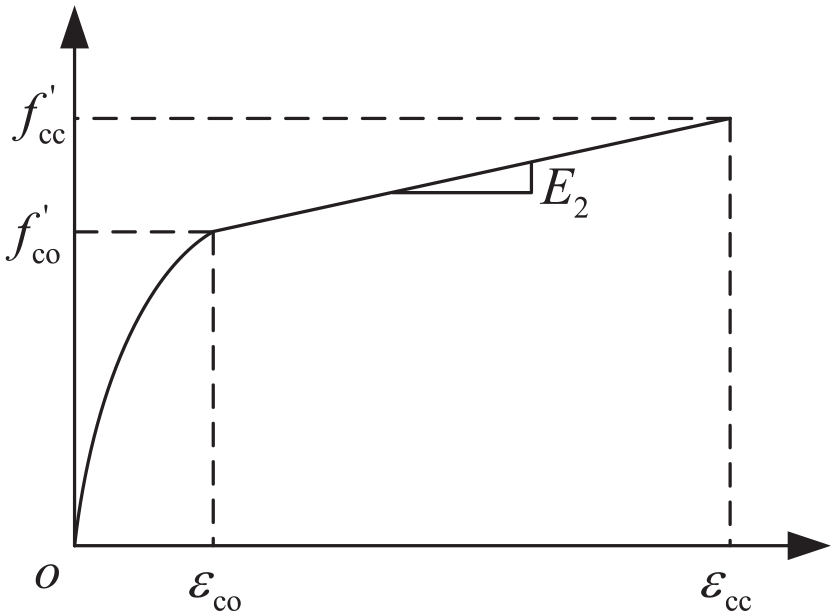
Stress-strain relationship of confined concrete.
The expression is
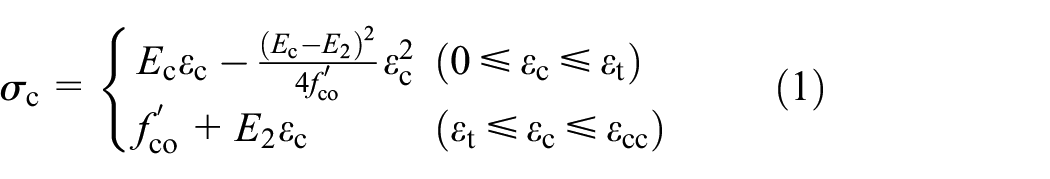
Where,

Where,
Tensile constitutive relation of concrete
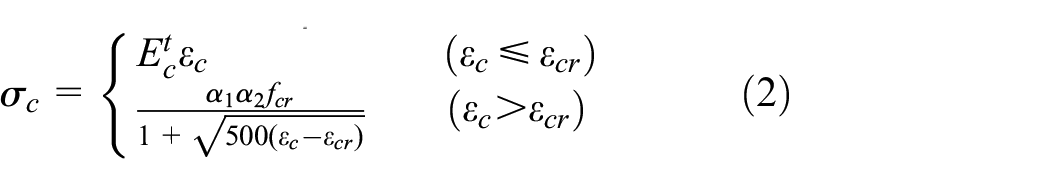
Where,
Constitutive relation of FRP
The stress-strain relationship of FRP 19 is linear in tension and compression regions, and the constitutive equation is as follows:
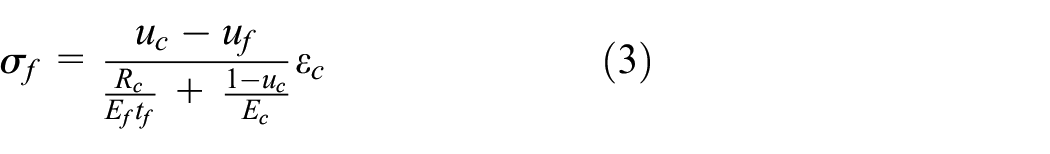
Where,
Constitutive relation of steel
The stress-strain curve of steel pipe adopts the model proposed by Zhong 20 in 1994, which is composed of elastic section and strengthening section, as shown in Figure 3.

Stress-strain relationship of steel tube.
The expressions of stress and strain are as follows:
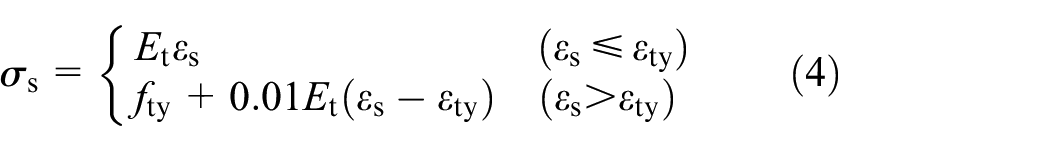
Where,
Computational model
Fiber model method is used to divide FRP tube, concrete, and steel tube sections into a certain number of strips along the height. It is assumed that the stress in each strip is uniformly distributed and the average strain is linearly distributed along the height of the section. Section element division is shown in Figure 4.
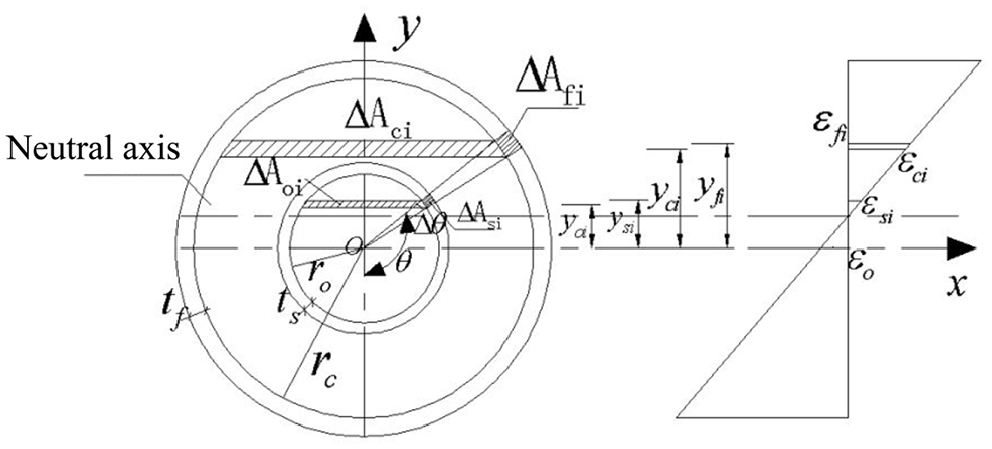
Cross-sectional element division.
The section is divided into
Where,
The center angle of the circle corresponding to the element
Area of unit FRP tube
Area of unit steel tube
Area of hollow unit
Area of unit concrete
According to the equilibrium condition of the force, the basic iterative equation is obtained:


Where,
The whole deformation of FCS columns is divided into several steps. The deflection in the middle of the span is determined according to
Program verification
The computational model mentioned above is programed by utilizing Fortran. By using the nonlinear analysis program of FCS composite column under eccentric compression, the load-deflection curves calculated are compared with the load deflection curves of test specimens I-30-10-0.73-1800, I-60-10-0.73-1800, II-30-6-0.73-1800, II-60-6-0.73-1800, and II-90-6-0.73-1800 in Xu 21 and Xu et al., 22 as shown in Figure 6, Table 1 and Table 2. The test specimens are numbered by I (or II)-eccentricity-FRP thickness- hollow ratio-column height. The specimens with different FRP thickness and eccentricity are selected to verify the accuracy of proposed program. The inner diameter, length, axial modulus of elasticity, axial strength, circumferential modulus of elasticity, circumferential strength of FRP tube are 300 mm, 1800 mm, 12.641 GPa, 223 MPa, 48.04 GPa, 715.8 MPa, respectively. The outer diameter, wall thickness of steel tube, and hollow ratio are 219 mm, 6 mm, and 0.73, respectively. The wall thickness of FRP tube in specimens I-30-10-0.73-1800 and I-60-10-0.73-1800 is 10 mm, and the eccentricity is 30 and 60 mm respectively. The wall thickness of FRP tube in specimens II-30-6-0.73-1800, II-60-6-0.73-1800, and II-90-6-0.73-1800 is 6 mm, and the eccentricity is 30, 60, and 90 mm respectively. The schematic of loading device is shown in Figure 5.
Detailed information of test specimens.

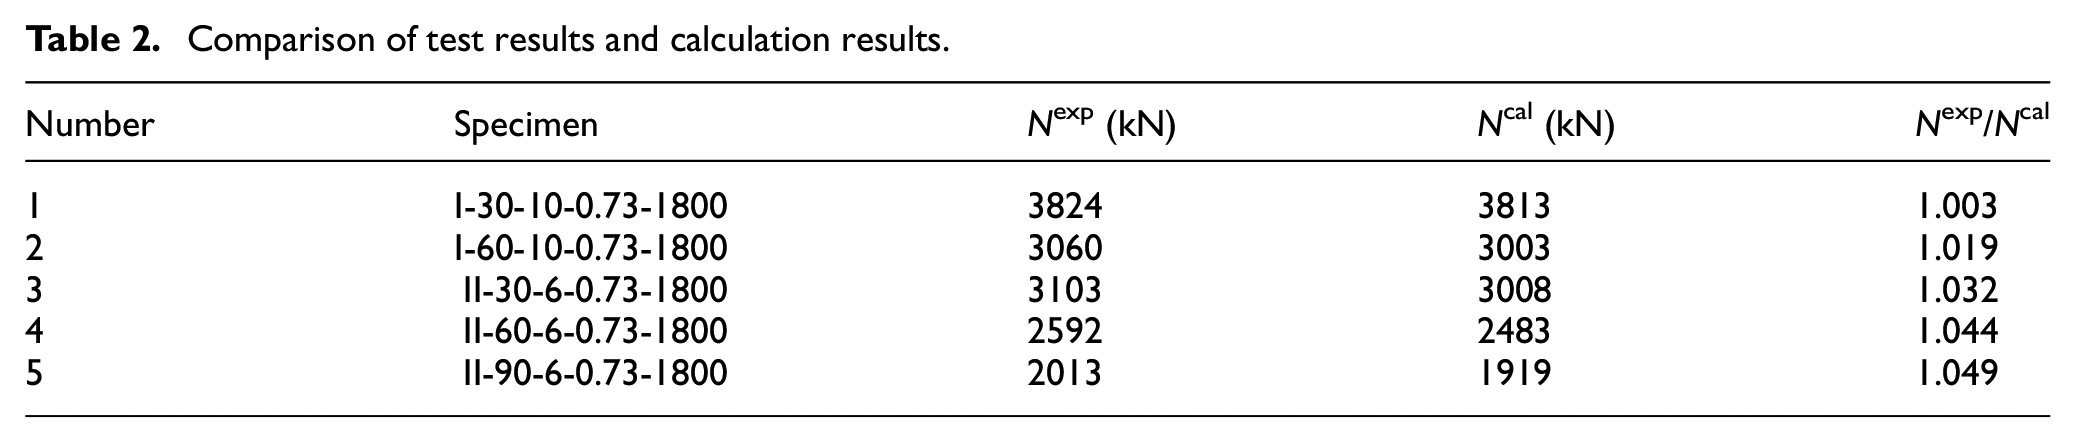
Comparison of test results and calculation results.

Schematic of loading device.
It can be seen from Figure 6 that the curve of eccentric compression load and deformation of FCS composite column can be roughly divided into three stages. When the load reaches about 75% of the ultimate load, the load-deformation curve is approximate to a straight line, and the FCS composite column is in the elastic stage. With the further increase of the load, the deformation growth rate is obviously faster than the load growth rate, the slope of the curve gradually decreases. The FCS composite column enters the elastic-plastic stage. As the load continues to increase, after the load reaches the ultimate load, the FCS composite column cannot bear the increasing load, and the curve shows a downward trend. At this time, the deformation of FCS composite column increases faster and the load decreases. This stage is plastic stage. From the comparison of ultimate load in Table 2, it can be seen that the average error and mean square error of the calculated results are 1.029 and 0.034 respectively. From the comparative analysis of Figure 6 and Table 2, it can be seen that the calculated results are in good agreement with the experimental results. The program can accurately reflect the deformation of FCS composite columns under different loads and estimate the ultimate load of FCS composite columns.

Comparison diagram of test results and calculation results: (a) I -30-10-0.73-1800, (b) I-60-10-0.73-1800, (c) II-30-6-0.73-1800, (d) II-60-6-0.73-1800, and (e) II-90-6-0.73-1800.
In addition, it can be observed that the load-deflection curves of the test and nonlinear analysis program after peak values are relatively larger. This is mainly caused by the error in constitutive model of confined concrete which is shown in section 2.2.1. In addition, the experimental results in Xu 21 indicated that the plane section assumption is true for elastic phase. However, this assumption is not true anymore after the yield of steel pipe. This is also the reason for large error. As the target of this work is the ultimate loading capacity of FCS composite columns, the error for load-deflection curves after peak values can be accepted.
Influence of design parameters
Based on the correctness of the program, the main influence parameters of FCS composite columns under eccentric compression are analyzed. The basic parameters are set as follows: the wall thickness, inner diameter, axial elastic modulus, axial strength, circumferential elastic modulus, circumferential strength of FRP tube are 5 mm, 200 mm, 12.5 GPa, 180 MPa, 44.5 GPa, and 560 MPa, respectively. The wall thickness, outer diameter, elastic modulus, and yield strength of steel tube are 4 mm, 90 mm, 206 GPa, and 340 MPa, respectively. The concrete strength is C40 and eccentricity is 30 mm.The influence of eccentricity, FRP tube wall thickness, steel tube wall thickness, hollow ratio, and slenderness ratio on the load-deformation curve of FCS composite columns are studied under the premise of other basic parameters unchanged.
The influence of eccentricity
When the eccentricities are 10, 20, 30, 40, and 50 mm, and other conditions remain unchanged. The load-deformation curves of FCS composite columns with different eccentricities are shown in Figure 7. It can be seen from the figure that the initial stiffness decreases with the increase of eccentricity. The curve deviates more and more from the coordinate axis. The ultimate load of the specimen decreases gradually. The ultimate load of specimens with eccentricity of 20, 30, 40, and 50 mm is 11.9%, 22.7%, 31.5%, and 39.1% lower than that of specimens with eccentricity of 10 mm.

Influence of eccentricity.
Figure 8 compares and analyzes the variation of ultimate eccentric load of FCS composite columns with eccentricity under different FRP tube wall thickness, steel tube wall thickness, steel tube radius, slenderness ratio and concrete strength. It can be seen from Figure 8 that the influence of eccentricity on the ultimate load of FCS composite columns is roughly the same, that is, the ultimate load of eccentric compression decreases with the increase of eccentricity. But it does not change linearly.

Influence of eccentricity on ultimate load of FCS composite columns under eccentric compression: (a) influence of wall thickness of FRP tube, (b) influence of wall thickness of steel tube, (c) influence of steel tube radius, (d) influence of slenderness ratio, and (e) influence of concrete strength.
Figure 8(a) shows the variation of ultimate eccentric load of FCS composite column with eccentricity under different FRP tube wall thickness. The wall thickness of FRP tube is from 3 to 7 mm, and the curve slope is approximately the same. When the wall thickness of FRP tube is 3, 4, 5, 6, and 7 mm, and the eccentricity increases from 10 to 50 mm, the ultimate load reduction rates of FCS composite columns are 41.9%, 40.4%, 39.1%, 38.0%, and 37.7%, respectively. There is little difference in the reduction of ultimate load under eccentric compression.
Figure 8(b) shows the variation of ultimate eccentric load of FCS composite column with eccentricity under different steel tube wall thickness. When the steel tube wall thickness is from 3 to 7 mm, the influence of eccentricity on the ultimate load of eccentric compression is gradually increasing. When the eccentricity increases from 10 to 50 mm, the ultimate load of FCS composite columns decreases by 590, 639, 688, 731, and 773 kN, respectively.
Figure 8(c) shows the variation of ultimate eccentric load of FCS composite columns with eccentricity under different steel tube radius. The curves with the radius of 25, 35, and 45 mm of the steel tube basically coincide. The results show that when the radius of steel tube is 25–45 mm, the ultimate load under eccentric compression is approximately equal. When the radius of steel tube increases to 55 and 65 mm, the ultimate load of FCS composite column decreases by 600 and 564 kN respectively. When the radius of steel tube is from 45 to 65 mm, the influence of eccentricity on the ultimate load is gradually reduced. When the eccentricity is 50 mm, the ultimate bearing capacity of the specimens with a radius of 25–65 mm is almost the same.
Figure 8(d) shows the variation of the ultimate load of the FCS composite column with eccentricity under different slenderness ratios. When the slenderness ratio
Figure 8(e) shows the variation of ultimate eccentric load of FCS composite column with eccentricity under different concrete strength. The concrete strength values are from C30 to C50, and the curve change law is roughly the same. When the concrete strength is C30, C35, C40, C45, and C50 respectively, and the eccentricity increases from 10 to 50 mm, the ultimate load reduction rates of FCS composite columns are 38.6%, 38.8%, 39.1%, 39.5%, and 39.6% respectively. There is little difference in the reduction of ultimate load under eccentric compression.
Influence of FRP tube wall thickness
When the FRP tube wall thickness is 3, 4, 5, 6, and 7 mm respectively, and other conditions remain unchanged. The load-deformation curves of FCS composite columns with different FRP wall thickness are shown in Figure 9. It can be seen from the figure that at the beginning of load action, the curves are basically the same. It is shown that the initial stiffness of each specimen is basically the same. With the increase of FRP tube wall thickness, the ultimate load of the specimen increases gradually. The ultimate load of specimens with 4, 5, 6, and 7 mm wall thickness of FRP tube is 10.7%, 19.9%, 30.0%, and 39.4% higher than that of specimens with 3 mm wall thickness.

Influence of FRP tube wall thickness.
Figure 10 compares and analyzes the variation of ultimate eccentric load of FCS composite columns with FRP tube wall thickness under different steel tube wall thickness, steel tube radius, slenderness ratio, concrete strength, and eccentricity. It can be seen from Figure 10 that the influence of the change of FRP tube wall thickness on the ultimate load of FCS composite column under eccentric compression is roughly the same, that is, the ultimate load increases with the increase of FRP tube wall thickness. The growth rate is approximately linear.

Influence of FRP tube wall thickness on ultimate load of FCS composite columns under eccentric compression: (a) influence of wall thickness of steel tube, (b) influence of steel tube radius, (c) influence of slenderness ratio, (d) influence of concrete strength, and (e) influence of eccentricity.
Figure 10(a) shows the variation of the ultimate load of the FCS composite column with the FRP tube wall thickness under different steel tube wall thickness. The steel tube wall thickness ranges from 3 to 7 mm, and the slope of the curve is roughly the same. The wall thickness of steel tube is 3, 4, 5, 6, and 7 mm respectively, and the FRP tube wall thickness increases from 3 to 7 mm. The ultimate load growth rate of FCS composite columns is 40.3%, 39.4%, 38.7%, 37.5%, and 36.0%, respectively. The increase range of ultimate load is similar.
Figure 10(b) shows the variation of ultimate eccentric load of FCS composite columns with FRP tube wall thickness under different steel tube radius. The curves with the radius of 25, 35, and 45 mm of the steel tube basically coincide. The results show that when the radius of steel tube is 25–45 mm, the ultimate load under eccentric compression is approximately equal. This is caused by the fact that the increase of steel tube radius increased the sectional area of steel tube and the area of core concrete is decreased. The bearing capacity of steel tube is higher than concrete. In addition, the conclusions derived in Xu 21 also indicated the bearing capacity of medium long column is not obviously affected by hollow ratio. When the radius of steel tube increases to 55 and 65 mm, the ultimate load of FCS composite column decreases by 50 and 77 kN, respectively.
Figure 10(c) shows the variation of ultimate load of FCS composite columns under eccentric compression with FRP tube wall thickness under different slenderness ratios. The slenderness ratio
Figure 10(d) shows the variation of the ultimate load of the FCS composite column with the wall thickness of FRP under different concrete strength. The concrete strength values range from C30 to C50, and the slope of the curve is roughly the same. The concrete strength is C30, C35, C40, C45, and C50, and the wall thickness of FRP tube increases from 3 to 7 mm, and the ultimate load growth rate of FCS composite columns is 44.8%, 42.0%, 39.4%, 37.2%, and 35.2%, respectively.
Figure 10(e) shows the variation of ultimate eccentric load of FCS composite column with FRP tube wall thickness under different eccentricities. The eccentricity is from 10 to 50 mm, and the slope of the curve decreases with the increase of FRP tube wall thickness. When the eccentricities are 10, 20, 30, 40, and 50 mm, the FRP tube wall thickness increases from 3 to 7 mm, and the ultimate eccentric load of FCS composite columns increases by 492, 455, 415, 387, and 363 kN, respectively. With the increase of eccentricity, the influence of FRP tube wall thickness on the ultimate load of eccentric compression gradually decreases.
Influence of steel tube wall thickness
When the steel tube wall thickness is 3, 4, 5, 6, and 7 mm respectively, and other conditions remain unchanged. The load-deformation curves of FCS composite columns with different steel tube wall thickness are shown in Figure 11. It can be seen from the figure that at the initial stage of loading, the curves are basically the same. It shows that the initial stiffness of each specimen is basically the same. With the increase of the thickness of the steel tube, the ultimate load increases gradually. The ultimate load of specimens with 4, 5, 6, and 7 mm wall thickness is 4.0%, 8.2%, 12.3%, and 16.1% higher than that of specimens with 3 mm wall thickness.

Influence of steel tube wall thickness.
Figure 12 compares and analyzes the variation of ultimate eccentric load of FCS composite columns with different FRP tube wall thickness, steel tube radius, slenderness ratio, concrete strength and eccentricity. It can be seen from Figure 12 that the influence rule of steel tube wall thickness on ultimate load of FCS composite column under eccentric compression is roughly the same. The ultimate load increases linearly with the increase of steel tube wall thickness.

Influence of steel tube wall thickness on ultimate load of FCS composite columns under eccentric compression: (a) influence of wall thickness of FRP tube, (b) influence of wall thickness of steel tube, (c) influence of slenderness ratio, (d) influence of concrete strength, and (e) influence of eccentricity.
Figure 12(a) shows the variation of ultimate eccentric load of FCS composite columns with different FRP tube wall thickness. The wall thickness of FRP tube ranges from 3 to 7 mm, and the slope of the curve is approximately the same. When the thickness of FRP tube is 3, 4, 5, 6, and 7 mm respectively, and the thickness of steel tube increases from 3 to 7 mm, the ultimate load growth rates of FCS composite columns under eccentric compression are 18.2%, 17.1%, 16.1%, 15.3%, and 14.6%, respectively. The increase range of ultimate load under eccentric compression is similar.
Figure 12(b) shows the variation of ultimate load of FCS composite column with the wall thickness of steel tube under different radius of steel tube. The curve slope increases with the increase of the radius of the steel tube from 25 to 65 mm. The radius of steel tube is 25, 35, 45, 55, and 65 mm respectively, and the thickness of steel tube increases from 3 to 7 mm. The ultimate load increase rates of FCS composite columns under eccentric compression are 7.5%, 11.4%, 16.1%, 22.3%, and 29.3%, respectively.
Figure 12(c) shows the variation of ultimate load of FCS composite column under eccentric compression with steel tube wall thickness under different slenderness ratios. The slenderness ratio ranges from 6 to 10, and the slope of the curve is roughly the same. When the slenderness ratio is 6, 7, 8, 9, and 10, and the thickness of steel tube increases from 3 to 7 mm.The ultimate load growth rates of FCS composite columns under eccentric compression are 16.1%, 14.5%, 25.5%, 14.1%, and 13.9%, respectively. The increase range of ultimate load under eccentric compression is similar.
Figure 12(d) shows the variation of ultimate load of FCS composite column under eccentric compression with steel tube wall thickness under different concrete strength. The concrete strength values range from C30 to C50, and the slope of the curve is roughly the same. The strength of concrete is C30, C35, C40, C45, and C50, the thickness of steel tube increases from 3 to 7 mm, and the ultimate load of FCS composite column increases by 195, 196, 196, 199, and 200 kN respectively.
Figure 12(e) shows the variation of ultimate eccentric load of FCS composite column with the thickness of steel tube under different eccentricities. The eccentricity is from 10 to 50 mm, and the slope of the curve decreases with the increase of the tube wall thickness. When the eccentricity is 10, 20, 30, 40, and 50 mm, and the thickness of steel tube increases from 3 to 7 mm, the ultimate eccentric load of FCS composite column increases by 301, 244, 196, 159 and 118 kN, respectively. It shows that with the increase of eccentricity, the influence of steel tube wall thickness on eccentric ultimate load decreases gradually.
Influence of steel tube radius (hollow ratio)
When the steel tube radius are 25, 35, 45, 55, and 65 mm respectively, and other conditions remain unchanged, the load deformation curves of FCS composite columns with different steel tube radius are shown in Figure 13. It can be seen from the figure that at the initial stage of loading, the curves are basically the same. It shows that the initial stiffness of each specimen is basically the same. With the increase of steel tube radius, the ultimate load of eccentric compression decreases gradually. The ultimate load of 35, 45, 55, and 65 mm steel tube is 0.2%, 1.0%, 3.1%, and 5.1% lower than that of 25 mm steel tube.
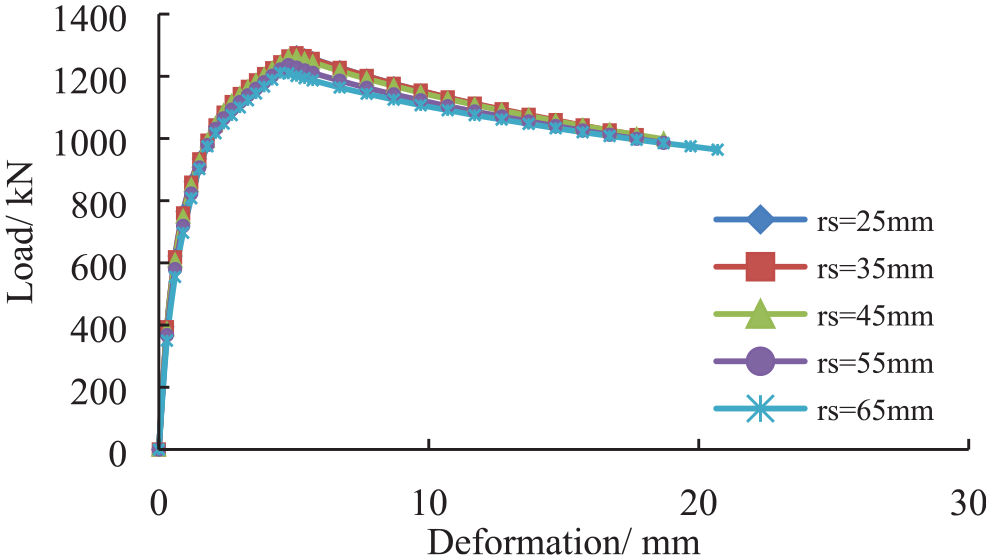
Influence of steel tube radius (hollow ratio).
Figure 14 compares and analyzes the variation of ultimate eccentric load of FCS composite columns with steel tube radius under different FRP tube wall thickness, steel tube wall thickness, slenderness ratio, concrete strength, and eccentricity. It can be seen from Figure 14 that the influence rule of the change of steel tube radius on the ultimate load of FCS composite column under eccentric compression is roughly the same. The ultimate load of eccentric compression decreases with the increase of steel tube radius, and does not show a linear change. However, when the steel tube wall thickness reaches a certain value, the ultimate load of FCS composite column increases with the increase of steel tube radius.

Influence of steel tube radius on ultimate load of FCS composite columns under eccentric compression: (a) influence of wall thickness of FRP tube, (b) influence of wall thickness of steel tube, (c) influence of slenderness ratio, (d) influence of concrete strength, and (e) influence of eccentricity.
Figure 14(a) shows the variation of ultimate eccentric load of FCS composite column with the radius of steel tube under different FRP tube wall thickness. The wall thickness of FRP tube ranges from 3 to 7 mm, and the curve change is roughly the same. When the thickness of FRP tube wall is 3, 4, 5, 6, and 7 mm respectively, and the radius of steel tube is increased from 25 to 65 mm, the ultimate load reduction rates of FCS composite columns under eccentric compression are 5.3%, 5.7%, 5.1%, 4.7%, and 5.4%, respectively. There is little difference in the reduction of ultimate load under eccentric compression.
Figure 14(b) shows the variation of ultimate eccentric load of FCS composite column with the radius of steel tube under different wall thickness of steel tube. When the thickness of steel tube wall is from 3 to 7 mm, the change of steel tube radius has a great influence on the ultimate load of FCS composite column. The thickness of steel tube wall is from 3 to 5 mm, and the ultimate load decreases with the increase of steel tube radius. The influence of the change of steel tube radius on the ultimate load of eccentric compression gradually decreases. The thickness of steel tube wall is 4 or 5 mm, the ultimate load increases with the increase of steel tube radius.
Figure 14(c) shows the variation of ultimate load of FCS composite column under eccentric compression with steel tube radius under different slenderness ratios. The slenderness ratio λ ranges from 6 to 10, and the curve change is roughly the same. When the slenderness ratio is 6, 7, 8, 9, and 10, and the radius of steel tube is increased from 25 to 65 mm, the ultimate load reduction rates of FCS composite columns under eccentric compression are 5.1%, 3.2%, 3.7%, 2.6%, and 2.0%, respectively.
Figure 14(d) shows the variation of ultimate eccentric load of FCS composite column with steel tube radius under different concrete strength. The concrete strength is from C30 to C50, and the influence of the change of steel tube radius on the ultimate load of eccentric compression increases gradually. The strength of concrete is C30, C35, C40, C45, and C50, and the radius of steel tube increases from 25 to 65 mm. The ultimate eccentric load of FCS composite column decreases by 5, 30, 65, 98, and 128 kN respectively.
Figure 14(e) shows the variation of ultimate eccentric load of FCS composite column with steel tube radius under different eccentricities. The eccentricity is from 10 to 50 mm, and the influence of the change of steel tube radius on the ultimate load of eccentric compression gradually decreases. The eccentricity is 10, 20, 30, 40, and 50 mm respectively, and the radius of steel tube is increased from 25 to 65 mm. The ultimate eccentric load of FCS composite column is reduced by 104, 89, 65, 36, and 3 kN respectively.
Influence of slenderness ratio
When slenderness ratios are 6, 7, 8, 9, and 10, and other conditions remain unchanged, the load deformation curves of FCS composite columns with different slenderness ratios are shown in Figure 15. It can be seen from the figure that the initial stiffness decreases with the increase of slenderness ratio. As the curve deviates more and more from the coordinate axis, the ultimate load of the specimen decreases gradually. The ultimate load of specimens with slenderness ratio of 7, 8, 9, and 10 is 2.2%, 5.3%, 7.5%, and 10.8% lower than that of specimens with slenderness ratio of 6.

Influence of slenderness ratio.
Figure 16 compares and analyzes the variation of ultimate eccentric load of FCS composite columns with slenderness ratio under different FRP tube wall thickness, steel tube wall thickness, steel tube radius, concrete strength, and eccentricity. It can be seen from Figure 16 that the influence of slenderness ratio on ultimate load of FCS composite column is roughly the same. The ultimate load of eccentric compression decreases with the increase of slenderness ratio, and basically changes linearly.

Influence of slenderness ratio on ultimate load of FCS composite columns under eccentric compression: (a) influence of wall thickness of FRP tube, (b) influence of wall thickness of steel tube, (c) influence of steel tube radius, (d) influence of concrete strength, and (e) influence of eccentricity.
Figure 16(a) shows the variation of ultimate eccentric load of FCS composite columns with slenderness ratio under different FRP tube wall thickness. The wall thickness of FRP tube ranges from 3 to 7 mm, and the slope of the curve is approximately the same. The thickness of RP tube is 3, 4, 5, 6, and 7 mm respectively, and the slenderness ratio increases from 6 to 10.The ultimate load reduction rates of FCS composite columns under eccentric compression are 12.7%, 11.9%, 10.8%, 10.6%, and 10.4%, respectively. There is little difference in the reduction of ultimate load under eccentric compression.
Figure 16(b) shows the variation of ultimate load of FCS composite column under eccentric compression with slenderness ratio under different steel tube wall thickness. The steel tube wall thickness ranges from 3 to 7 mm, and the slope of the curve is roughly the same. The wall thickness of steel tube is 3, 4, 5, 6, and 7 mm respectively, and the slenderness ratio increases from 6 to 10. The ultimate load of FCS composite column bias is reduced by 10.5%, 10.8%, 11.6%, 12.2%, and 12.3% respectively.
Figure 16(c) shows the variation of ultimate eccentric load of FCS composite columns with slenderness ratio under different steel tube radius. The curves with the radius of 25, 35, and 45 mm of the steel tube basically coincide. The results show that when the radius of steel tube is 25–45 mm, the ultimate load under eccentric compression is approximately equal. The slenderness ratio reduces the ultimate load of deflection from 6 to 10 by about 152 kN. The radius of steel tube increases to 55 and 65 mm, and the ultimate eccentric load of FCS composite column decreases by 130 and 111 kN respectively.
Figure 16(d) shows the variation of ultimate eccentric load of FCS composite columns with slenderness ratio under different concrete strength. The concrete strength are from C30 to C50, and the curve change rule is roughly the same. The concrete strength is C30, C35, C40, C45, and C50, and the slenderness ratio increases from 6 to 10. The ultimate load reduction rates of FCS composite columns under eccentric compression are 10.7%, 10.6%, 10.8%, 11.0%, and 11.1%, respectively. There is little difference in the reduction of ultimate load under eccentric compression.
Figure 16(e) shows the variation of ultimate eccentric load of FCS composite columns with slenderness ratio under different eccentricities. The eccentricity ranges from 10 to 50 mm, and the slope of the curve is approximately the same. The eccentricity is 10, 20, 30, 40, and 50 mm, slenderness ratio increases from 6 to 10.The ultimate load reduction rates of FCS composite columns are 9.4%, 10.4%, 10.8%, 11.6%, and 11.4%, respectively. There is little difference in the reduction of ultimate load under eccentric compression.
Influence of concrete strength
When the concrete strength is C30, C35, C40, C45, and C50 respectively and other conditions remain unchanged, the load-deformation curves of FCS composite columns with different concrete strength are shown in Figure 17. It can be seen from the figure that with the increase of concrete strength, the initial stiffness increases. The ultimate load of the specimen also increases gradually. The ultimate load of C35, C40, C45, and C50 is 6.0%, 12.3%, 18.5%, and 24.7% higher than that of C30.
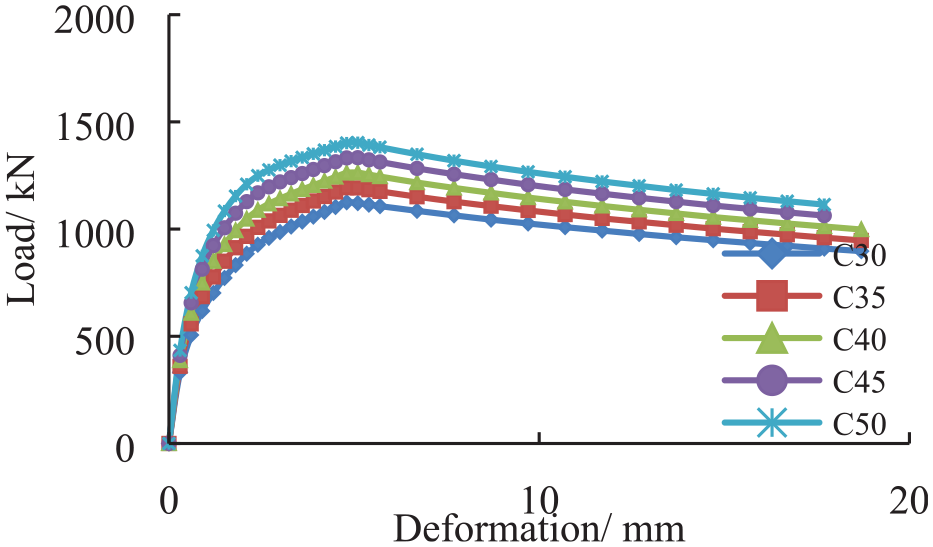
Influence of concrete strength.
Figure 18 compares and analyzes the variation of ultimate eccentric load of FCS composite columns with concrete strength under different FRP tube wall thickness, steel tube wall thickness, steel tube radius, slenderness ratio, and eccentricity. Figure 18 shows that the effect of the change of concrete strength on the ultimate load of the FCS composite column is approximately the same. The ultimate load of eccentric compression increases with the increase of concrete strength, which is approximately linear.
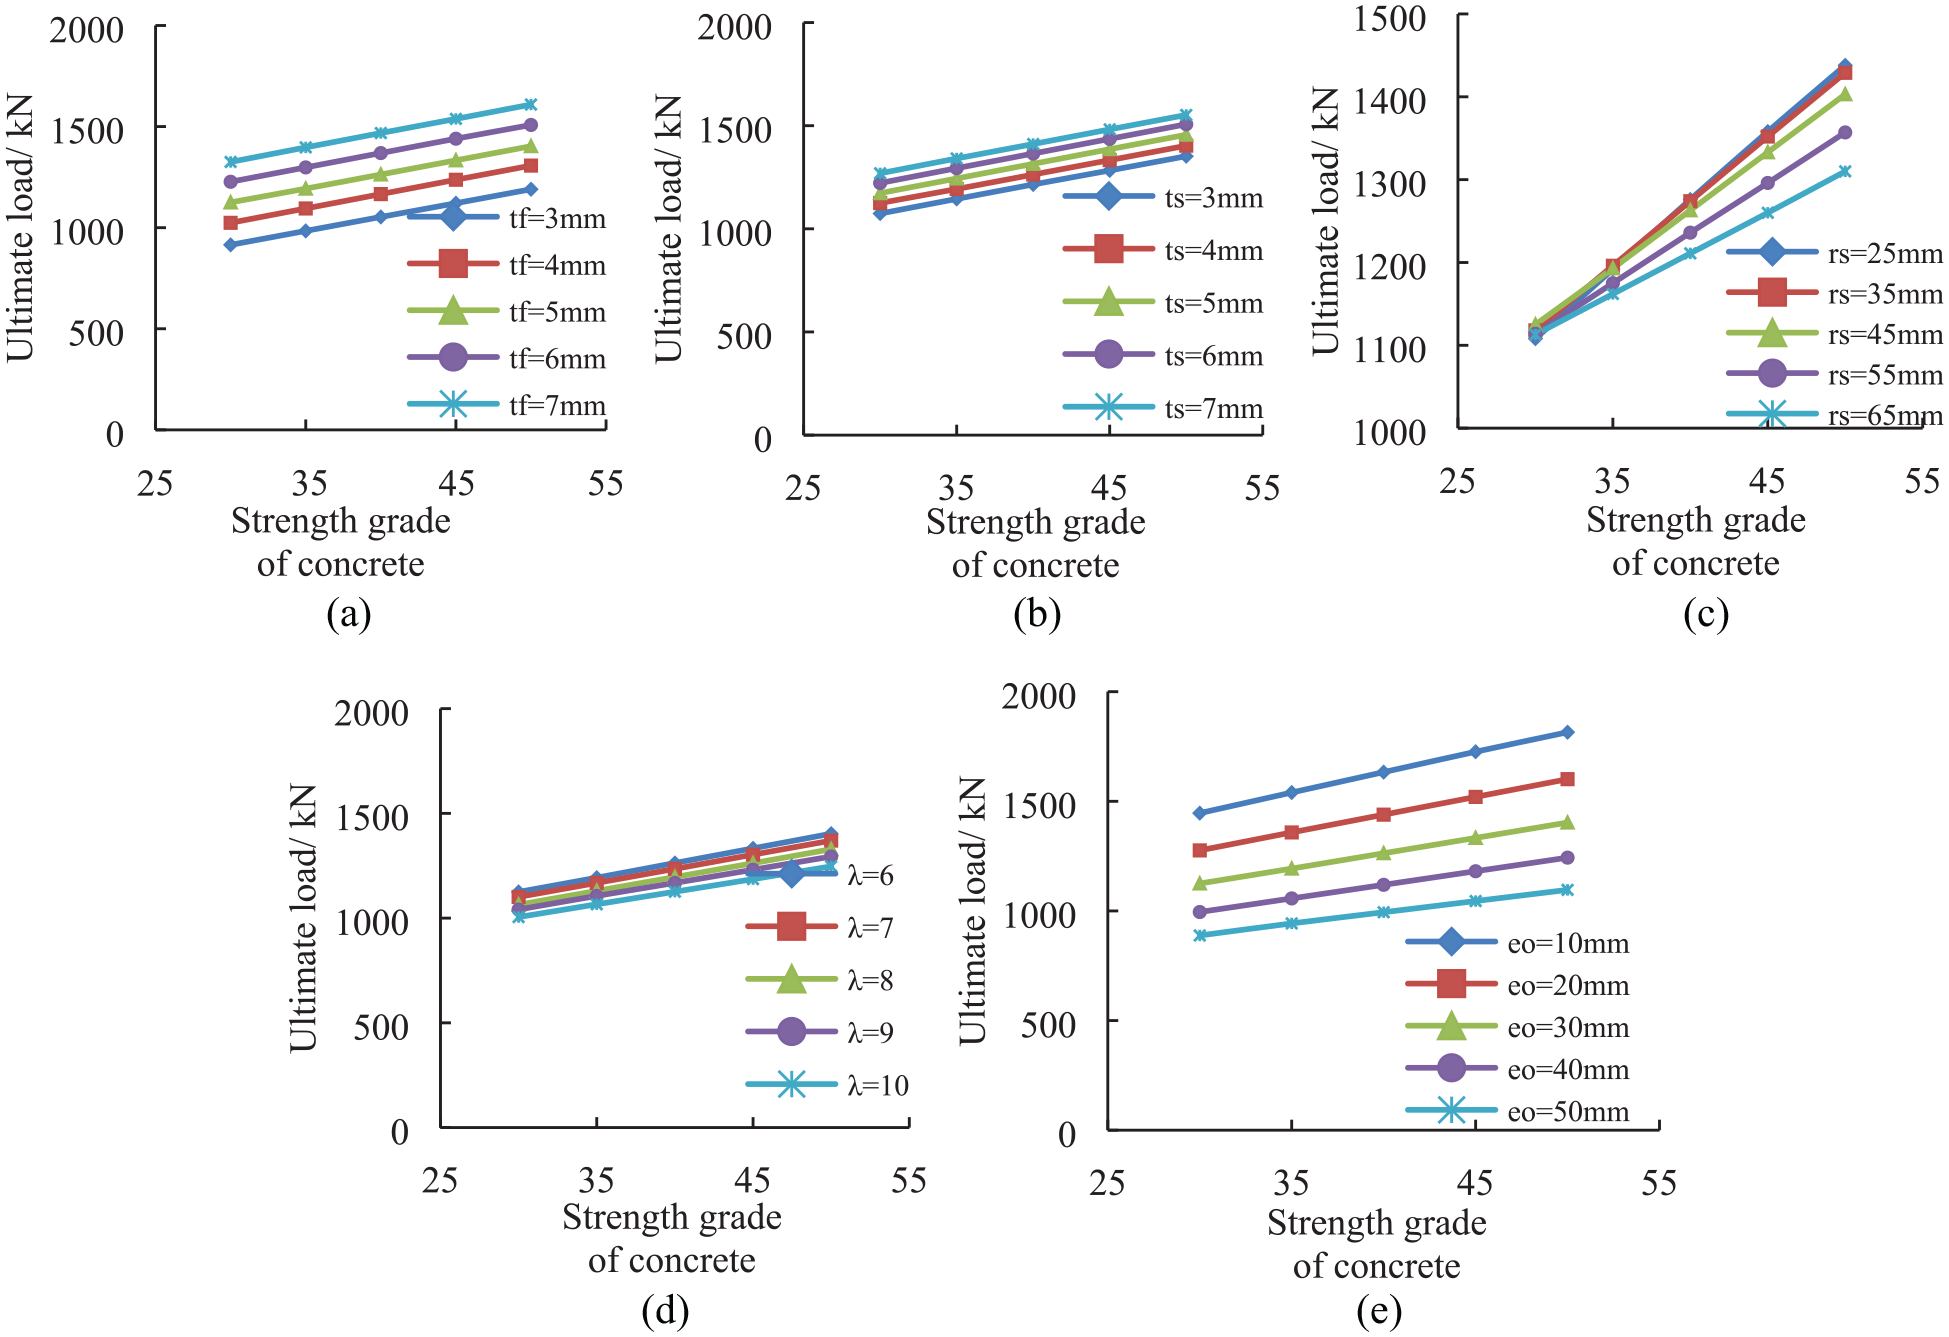
Influence of concrete strength on ultimate load of FCS composite columns under eccentric compression: (a) influence of wall thickness of FRP tube, (b) influence of wall thickness of steel tube, (c) influence of steel tube radius, (d) influence of slenderness ratio, and (e) influence of eccentricity.
Figure 18(a) shows the variation of ultimate eccentric load of FCS composite columns with concrete strength under different FRP tube wall thickness. The wall thickness of FRP tube ranges from 3 to 7 mm, and the slope of the curve is approximately the same. The wall thickness of FRP tube is 3, 4, 5, 6, and 7 mm respectively, and the concrete strength increases from C30 to C50.The ultimate eccentric load of FCS composite column increases by 275, 283, 278, 281, and 284 kN respectively. The increase range of ultimate load under eccentric compression is similar.
Figure 18(b) shows the variation of ultimate eccentric load of FCS composite column with FRP tube wall thickness under different steel tube wall thickness. The steel tube wall thickness ranges from 3 to 7 mm, and the slope of the curve is roughly the same. The wall thickness of steel tube is 3, 4, 5, 6, and 7 mm respectively, and the concrete strength increases from C30 to C50.The ultimate eccentric load of FCS composite column increases by 278, 278, 283, 285, and 283 kN respectively. The increase range of ultimate load under eccentric compression is similar.
Figure 18(c) shows the variation of ultimate load of FCS composite column with concrete strength under different steel tube radius. The radius of the steel tube is from 25 to 65 mm, and the slope of the curve decreases with the increase of the radius of the steel tube. It shows that with the increase of steel tube radius, the influence of concrete strength on eccentric ultimate load decreases gradually. The radius of steel tube is 25, 35, 45, 55, and 65 mm respectively, and the concrete strength increases from C30 to C50.The increase rates of ultimate eccentric load of FCS composite columns are 29.8%, 27.8%, 24.7%, 21.8%, and 17.7% respectively.
Figure 18(d) shows the variation of ultimate eccentric load of FCS composite columns with concrete strength under different slenderness ratios. The slenderness ratio λ ranges from 6 to 10, and the slope of the curve is roughly the same. The slenderness ratio is 6, 7, 8, 9, and 10, and the concrete strength increases from C30 to C50. The ultimate load growth rates of FCS composite columns under eccentric compression are 24.7%, 24.4%, 24.9%, 24.3%, and 24.1%, respectively. The increase range of ultimate load under eccentric compression is similar.
Figure 18(e) shows the variation of the ultimate load of the FCS composite column deflection with the concrete strength at different eccentricities. The eccentricity is from 10 to 50 mm, and the slope of the curve decreases with the increase of concrete strength. The eccentricity is 10, 20, 30, 40, and 50 mm, and the concrete strength increases from C30 to C50.The ultimate eccentric load of FCS composite columns increases by 369, 325, 278, 248, and 208 kN respectively. It shows that with the increase of eccentricity, the influence of concrete strength on eccentric ultimate load decreases gradually.
Conclusions
In this paper, the eccentric compression performance of FCS composite columns is studied. The bearing capacity of FCS composite columns is studied by compiling nonlinear analysis program of eccentric compression. The reliability of the program is verified by existing tests. The influences of eccentricity, FRP tube wall thickness, steel tube wall thickness, steel tube radius, slenderness ratio and concrete strength grade on the eccentrically loaded performance are systematically analyzed.
By using the nonlinear analysis program of FCS composite column under eccentric compression, the calculation results are in good agreement with the test results. It shows that the program which is programed based on plane cross-section assumption can accurately reflect the deformation of FCS composite columns under various loads and estimate the eccentric compression ultimate load of FCS composite columns.
The curve of eccentric compression load and deformation of FCS composite column is divided into three stages. When the load reaches about 75% of the ultimate load, the load-deformation curve is similar to a straight line. With the further increase of load, the growth rate of deformation is obviously faster than that of load, and the slope of curve begins to decrease. After the load reaches the ultimate load, the FCS composite column cannot bear the increasing load, and the curve shows a downward trend.
The ultimate load under eccentric compression increases with the decrease of eccentricity and slenderness ratio, and increases with the increase of FRP tube wall thickness, steel tube wall thickness, and concrete strength grade. That is to say, the bearing capacity of FCS columns is always determined by the FRP tubes. The ultimate load of eccentric compression decreases with the increase of steel tube radius. However, when the thickness of steel tube reaches a certain thickness, the ultimate load of FCS composite column increases with the increase of steel tube radius.
The initial stiffness increases with the decrease of eccentricity and slenderness ratio, and increases with the increase of concrete strength grade. The wall thickness of FRP tube, the wall thickness of steel tube, and the radius of steel tube have little effect on the initial stiffness.
Footnotes
Handling Editor: Fethma M Nor
Declaration of conflicting interests
The author(s) declared no potential conflicts of interest with respect to the research, authorship, and/or publication of this article.
Funding
The author(s) disclosed receipt of the following financial support for the research, authorship, and/or publication of this article: This work was fully supported by the Liaoning Provincial Department of Education Youth Science and Technology Talent Seedling Project (No. LJ2020QNL006).