
Abstract
The ultimate load capacities of steel fiber–reinforced concrete beams were determined by experiments conducted on steel fiber–reinforced concrete beams under the action of a two-point symmetrical concentrated load. Accordingly, failure modes and experimental data were obtained for 19 sets of test beams with varying concrete strength, longitudinal reinforcing bars, shear span ratio, and steel fiber volume content to determine their effects on steel fiber–reinforced concrete beam behavior. An optimization model reflecting the contributions of all tested factors to the shear capacity of a steel fiber–reinforced concrete beam is then derived and its accuracy is demonstrated by a comparison against the test results.
Keywords
Introduction and background
The use of steel fiber–reinforced concrete (SFRC) can improve the shear capacity of the section, even to the point of partially substituting for stirrup reinforcement.1–5 The two major advantages of SFRC are as follows: (1) the steel fibers can be discretely distributed in various positions through the concrete section, particularly where there is no access to provide tension bars; 6 and (2) the control of initial cracking and the ultimate tensile stress, ductility, and shear capacity can be improved to some extent.7–10
Batson et al. 11 analyzed the effects of steel fibers on the shear capacity of a reinforced concrete structure via experiments on 96 beams. The experiments revealed that the major factors influencing beam performance include steel fiber size, type, volume fraction, and shear span ratio.
Based on experiments and analyses of beams by Williamson and Knab, 12 it was found that when the steel fiber volume fraction is 1.66%, straight steel fibers can be substituted in place of stirrups. Williamson and Knab 12 further suggested that the addition of steel fibers could help avoid the shear failure of the oblique section and strengthen the bending resistance of the normal section of SFRC beams.
PR Tadepalli et al. 13 studied the shear properties and ductility of eight reinforced concrete I-beams, finding that beams reinforced with only steel fibers have a similar or even improved effect in arresting shear cracks compared to beams conventionally reinforced with mild steel. In the same year, YL Voo et al. 14 analyzed the shear behavior of eight pre-stressed concrete beams while varying the shear span-to-depth ratio and the quantity and type of steel fibers. Comparing the test data with the values derived from a predictive model of plastic shear variable engagement for the SFRC beams, good correlation was observed, resulting in a mean model-to-experimental strength ratio of 0.92 and a coefficient of variation of 0.12.
The above referenced researchers and others15–18 have found that steel fibers can be used to significantly improve the load capacity of the oblique section of reinforced concrete structures. On the analytical side, Sharma 19 proposed a formula to predict the ultimate shear capacity of SFRC beams based on the results of experiments by Batson et al. 11 and Williamson and Knab. 12
IF Kara 20 also proposed a prediction formula for the load capacity of the oblique section of SFRC beams without stirrup reinforcement (but including longitudinal reinforcing steel) using gene expression programming. In the Steel Fiber Reinforced Concrete (JG/T 472-2015) standard (hereinafter referred to as 2015 SFRC), 21 the combined capacity of the concrete and stirrups is used to calculate the shear capacity of SFRC. These researches also proposed a shear design method for SFRC.22–24
However, the empirical formulae presented in the above research have, in general, the following problems: they overstate the contribution of the compressive strength to the shear capacity. While all of the above shear computational formulae are based on the compressive strength of the concrete, experiments in this research determined that the steel fiber volume fraction, which clearly improves the shear capacity of a SFRC beam, has no clear effects on its compressive strength, which provides primary influence on shear strength in existing models.
As a result of these issues, it was considered inappropriate to select the compressive strength of concrete as a parameter to reflect the shear strength of SFRC. Preliminary experiments also indicated that there is a definite relationship between the tensile strength of SFRC and the amount of steel fibers incorporated, noting that the structure is largely subject to tensile failure. Therefore, the research detailed in this article studies SFRC beam behavior with respect to the tensile strength as a critical parameter in determining shear capacity.
Experimental materials and methods
This study conducted experimental analyses of the load capacity of SFRC beams, including compression, splitting, and shear strengths. The main experimental parameters varied in this study include the concrete matrix strength, longitudinal reinforcing bars, shear span ratio, and steel fiber volume content.
For SFRC beams, the incorporation of steel fibers may suppress the formation and propagation of cracks and improve the rigidity and ductility of the structure. However, further exploration is still required to provide an accurate prediction formula for shear capacity.
Therefore, there are two main objectives of this experimental analysis: first, this study investigates the effects of concrete strength, longitudinal reinforcing bars, shear span ratio, and steel fiber volume content on the ultimate capacity of SFRC beams, including compression, splitting, and shear capacities; second, this work evaluates existing computational models for the shear capacity of SFRC beams proposed by Sharma, 19 IF Kara, 20 and 2015 SFRC 21 and observes the disadvantages of these formulae.
In consideration of the above approach, this study proposes a new preliminary computational model by fitting a large quantity of experimental data and attempts to provide a solution for the unknown parameters in the preliminary model using the design optimization function of ANSYS. Next, this study demonstrates the rationality of the proposed model based on sensitivity analysis, as well as a comparative analysis of the predicted and tested values. Finally, it was necessary to determine a proper range of the steel fiber volume content and the longitudinal reinforcing bars to most effectively improve the shear capacity of SFRC beams. In totality, the experiments conducted in this research provide data on the load capacity of SFRC beams and are used to propose a rational model of SFRC beam shear capacity.
Experiment design
The cross-sectional dimensions of the test specimens were 150 mm × 300 mm (b × h). Two-legged R235 Φ8 stirrups were located at the end of test beam at a spacing of 100 mm. Two longitudinal reinforcing bars were placed along the bottom of the beam. The distance from the center of the longitudinal reinforcing bars to the bottom face of the beam was 25 mm. To ensure sufficient anchorage of the flexural reinforcing bars, they were bent 90° upward at the ends. The distance between the two loading points was 500 mm, and the distance between the support and the loading point was adjusted to achieve different shear span ratios (λ = a/d). Figure 1 shows the general geometry of the test specimens, and Table 1 provides information on the specific geometry and materials used for each specimen.

Design drawing for test beams (dimensions in mm).
Parameters of test beams.
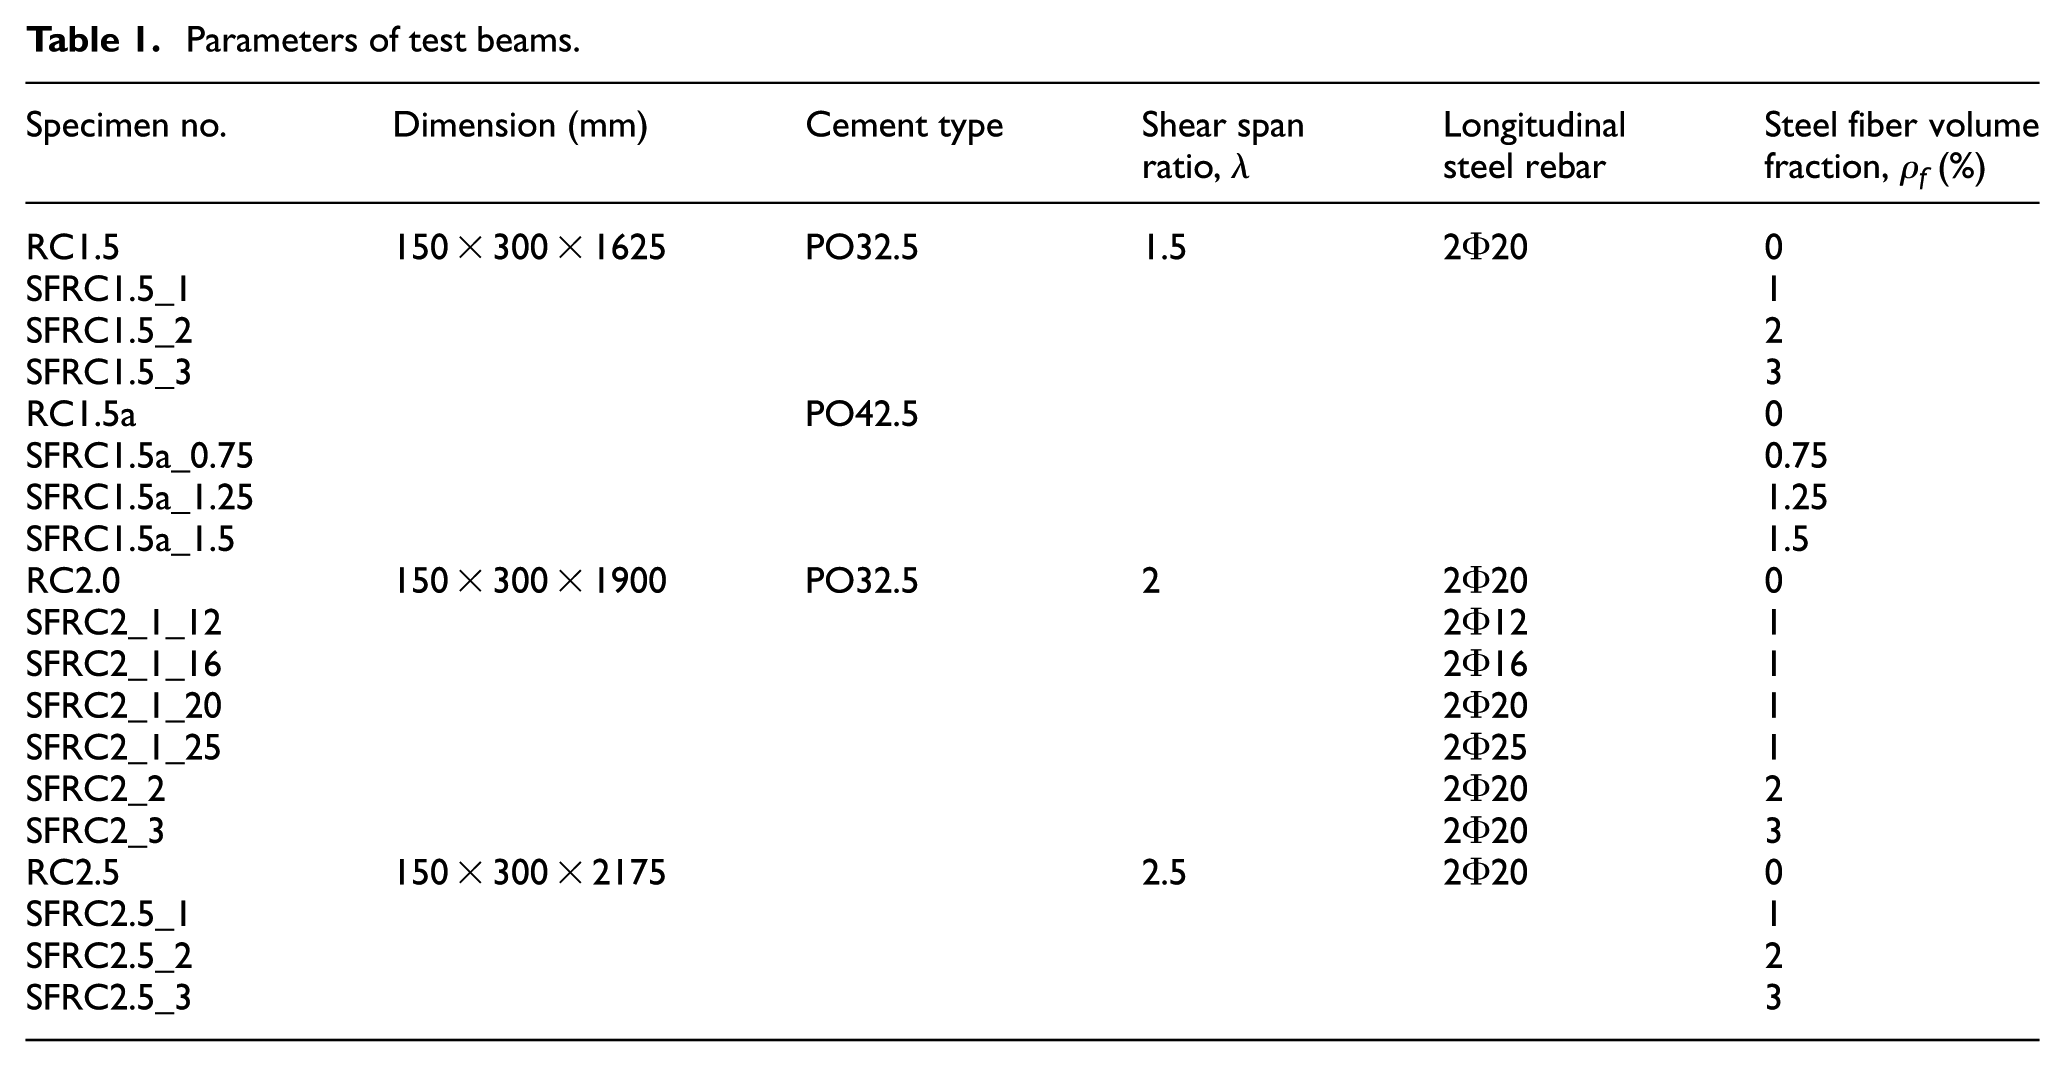
The major parameters varied in this experimental research program included the concrete strength, steel fiber volume fraction ρf, shear span ratio λ, and reinforcement ratio P of the longitudinal reinforcing bars.
The test parameters were varied as detailed in Table 1 and described follows: (1) the first batch of cement used was PO32.5 cement and the second batch was PO42.5 to determine the effects of different concrete strengths on beam behavior; (2) the volume fraction of steel fibers ρf was varied in increments from 0.75%, 1%, 1.25%, 1.5%, 2%, to 3% to study its effects on the shear capacity of the beams; (3) three shear span ratio λ cases on three different beam lengths were tested, 1625 mm (λ = 1.5), 1900 mm (λ = 2), and 2175 mm (λ = 2.5), to determine the effects of shear span ratio on beam behavior; and (4) four different longitudinal reinforcing bar sizes, 2Φ12, 2Φ16, 2Φ20, and 2Φ25 bars, were used in the specimens to investigate the effect of the reinforcement ratio P on the shear capacity of the SFRC beams.
Experiment materials
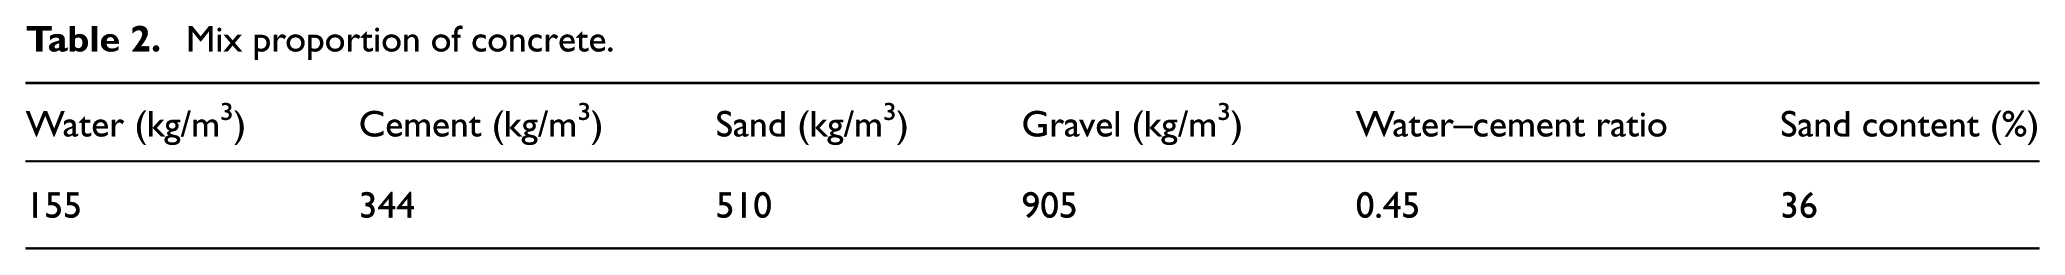
The first batch of cement used in this study was a common silicate cement PO32.5, and the second batch was common silicate cement PO42.5. Coarse aggregate was a limestone gravel with a diameter of 5–20 mm. The fine aggregate was a natural river sand with silt content of less than 1%. The concrete materials used in the test specimens were C30 and C40 strength concretes. The mix proportion of cement, water, sand, and gravel was 1:0.45:1.48:2.63, as shown in Table 2. The concrete was manually mixed and injected into the test forms, and an internal vibrator was used for consolidation. Twelve 150 mm × 150 mm test cubes were poured for each type of specimen and cured in a chamber for 24 h before testing to determine the compressive strength and splitting strength of the concrete. Neither a water reducer nor an early strength agent was added.
Mix proportion of concrete.
The steel fibers were of the shear type and wave shaped with a tensile strength of 695 MPa, had a bending fracture rate higher than 95%, and a fiber shape coincidence rate of 95% (90% was considered acceptable). Images of the steel fibers and reinforcing bars can be found in Figure 2. All longitudinal reinforcing bars, regardless of size, were of HRB335 type, and all stirrups were R235 Φ8 bars.

Test steel: (a) steel fibers and (b) reinforcing bar.
Loading, measurement, and data collection
The beam specimen tests were conducted using a long column testing machine with a 1000 kN capacity, shown in Figure 3. The test beams were subjected to two-point symmetrical concentrated loading. The loading was applied using load control in increments of 10 kN. When the first oblique cracks began to appear, or the load reached 90% of the ultimate load, the loading increment was decreased to 5 kN to guarantee an accurate determination of cracking and ultimate loads.

Loading of test beam specimens.
The major parameters measured included the strain in the test beam, crack widths, vertical displacement, and applied load. Figure 4 depicts the specific positions of the various measuring points. Electric resistance strain gauges were attached to the sides of the beams in the mid-span flexural region at the top and bottom, and in the shear span, where the principal oblique cracks were anticipated to occur first.
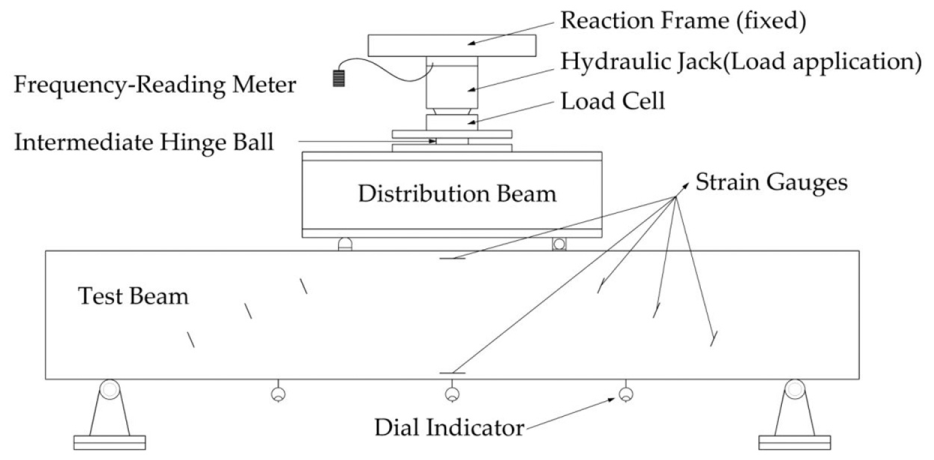
Loading method and measuring point layout.
The width of the oblique cracks that developed within the shear span region and of the flexural cracks in the lower margin of the mid-span were measured with a 20× reading microscope. The deflection of the beams was measured by dial gauges with a precision of 0.01 mm. The dial gauges were located at the mid-span and quarter points of the test beams. The applied load was measured by a 1000 kN vibrating wire load cell and read by a BP-32 handheld, portable frequency-reading meter located above the jack, which converted the measured force into a load.
Test results and analysis
A total of 19 test beams were analyzed to determine the effects of different concrete strengths on the load capacity of SFRC beams. First, the concrete material itself was evaluated using compression and splitting tests. The test beams were divided into two batches: the first batch contained the PO32.5 cement and the second batch contained the PO42.5 cement. To study the effect of the steel fiber volume fraction ρf on the shear capacity of the SFRC material, the fraction was varied in each batch and the results were interpreted using the resulting load–displacement curves. The beam specimens were tested over a similar range of variations, and these experiments also considered the effects of the shear span ratio λ. Finally, to investigate the effect of the longitudinal reinforcing bars on the load capacity of the SFRC beams, the area of longitudinal reinforcing steel was varied in a series of SFRC beam tests.
Material property tests
The material properties of the different concrete mixes were determined through compression resistance and splitting tests of the first and second batches of SFRC test cubes with different steel fiber contents, shown in Tables 3 and 4, respectively.
Compressive and splitting strengths of the first SFRC batch (PO32.5 cement).

SFRC: steel fiber–reinforced concrete.
Compressive and splitting strengths of the second SFRC batch (PO42.5 cement).
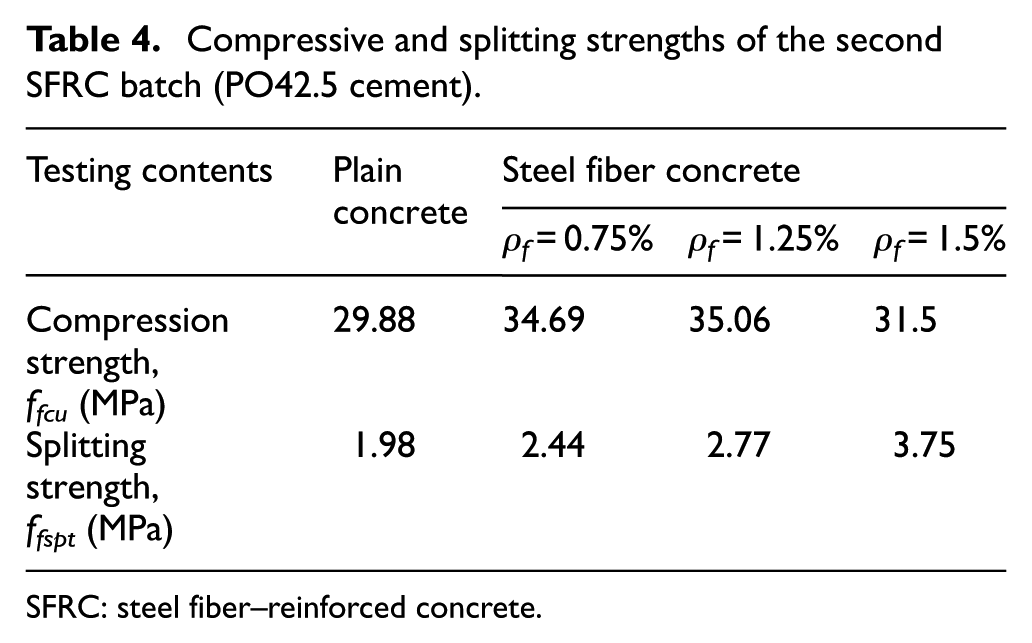
SFRC: steel fiber–reinforced concrete.
The increase in compressive strength accompanying the incorporation of steel fibers can be expressed by the ratio of the provided strength to the strength of the plain concrete, with the results summarized in Figure 5.

Ratio of the compressive strength of steel fiber concrete to that of plain concrete.
As can be seen from Figure 5, the compressive strength is not directly correlated with the steel fiber volume fraction ρf, as the ratio of compressive strength increase can clearly be seen to vary inconsistently from 1.05 to 1.3 as the steel fiber content increases. This is because of the hardening process of concrete, cement stones (formed from cement and water), and aggregates will bond together. In the initial stage of cementation, due to the shrinkage of cement paste and the sinking of aggregates, micro-cracks are formed on the interface between the cement stone and the aggregate. The micro-cracks existed in concrete before loading are the weakest object in the concrete. Under the influence of external forces, the micro-cracks have a process to develop, and the destruction of the concrete is certainly caused by the continuous generation, expansion, and destabilization of the micro-cracks. However, the incorporation of steel fibers cannot change the generation of the micro-cracks, nor can it essentially change the expansion and instability of the micro-cracks when loaded. Although the compressive strength of SFRC can be increased to some extent, the growth is not significant and the law is not obvious.
During the splitting test of the specimens without steel fibers, the cubes split when the applied load reached the ultimate splitting strength, after which the specimen resistance rapidly declined to zero, exhibiting a smooth and even splitting plane. However, the restrictive effects of the steel fibers can be observed to act to suppress crack propagation, thus improving the strength and ductility of the beams. When reinforced with steel fibers, the cube capacity does not immediately decrease once reaching the ultimate splitting strength, instead, not only do the splitting strengths of the SFRC specimens exhibit an increasing trend with the increase in steel fiber content, but after the ultimate strength is achieved, the descending segment of the load–displacement curve tends to be shallower or nearly flat in cases of higher steel fiber content. Notably, when reinforced with steel fibers, the test cubes still exhibited some load capacity after splitting occurred, as shown in the curves of Figures 6 and 7.

Splitting stress–displacement curves of different steel fiber contents ρf for the PO32.5 cement SFRC test cube batch.

Splitting stress–displacement curves of different steel fiber contents ρf for the PO42.5 cement SFRC test cube batch.
The splitting tests of the first batch of cubes showed an increase over the plain concrete splitting tensile strength of 2.42 MPa by factors of 1.24, 1.61, and 1.86 for steel fiber volume fractions ρf of 1%, 2%, and 3%, respectively. The splitting tests of the second batch of cubes showed an increase over the plain concrete splitting tensile strength of 1.98 MPa by factors of 1.23, 1.40, and 1.70 for steel fiber volume fractions ρf of 0.75%, 1.25%, and 1.5%, respectively. Clearly, with the increase in the volume of steel fibers incorporated, the tensile strengths of the SFRC specimens improve significantly.
SFRC beam tests
The 2015 SFRC 21 standard specifies the value of the axial compressive strength of SFRC, ffck, which should be equal to the standard value of the axial compressive strength of common concrete for the same strength grade, because the specification assumes that the effects of the steel fibers on the compression strength of the concrete is negligible. Based on the test results shown in Figure 6, this assumption can be considered reasonable, as the steel fibers had no significant effect on the compressive strength of the concrete.
The 2015 SFRC 21 specifies that the tensile resistance of SFRC, fftk, is given by

where fftk is the tensile strength of the SFRC (in MPa); ftk is the tensile strength of the plain concrete (in MPa); αt is the coefficient to capture the effect of the steel fibers on the tensile strength of the concrete, preferably determined by testing (the values in Table 5 can be selected for Grade CF20–CF80 SFRC when test data are unavailable); ρf is the steel fiber volume fraction; and lf/df is the length-to-diameter ratio of the steel fibers. The improvement in tensile strength provided by the addition of steel fibers to the concrete is therefore captured by the coefficient
Coefficients of influence of steel fibers on the tensile strength and flexural-tensile strength for concrete. 21

The value αt = 0.55 was obtained by fitting the test results, and the test results and the theoretical values provided in the specification were compared, indicating that the formula given in the specification is basically rational: with the increase in the volume fraction of steel fibers, the tensile strength improves, as shown in Figure 8, with a standard deviation of 0.068.

Comparison of test and theoretical values for SFRC tensile strength.
Failure modes and profiles
The test beams exhibited two major failure modes: pure shear failure and combined shear-bending failure. Pure shear failure usually occurred in specimens with a low shear span ratio and a small percentage of steel fibers. When the shear span ratio was 1.5, pure shear failures occurred when the fiber volume fractions were 1%, 0.75%, and 0%, and combined shear-bending failures occurred when the fiber volume fraction was larger than 1%. As the shear span ratio decreased, the specimens were more likely to fail in pure shear.
The general process of pure shear failure observed in the SFRC test beams was as follows. Vertical flexural cracks first appeared in the mid-span region of the test beam. With the increase in load, the cracks gradually propagated. Meanwhile, vertical flexural cracks appeared in the quarter-span (L/4) vicinity. The observed crack lengths in this stage were 2–5 cm, with the crack at mid-span being the longest. Shear cracks then occurred along the line running from the support to the loading point once the shear-cracking capacity was reached. These oblique cracks gradually propagated to lengths of 20–30 cm if no steel fiber was provided, at which point the test beams suddenly suffered from shear failure while still in the linear behavioral stage. The incorporation of steel fibers improved the structural ductility to some extent, but the oblique cracks and bending cracks continued to propagate further. Typically, when bending and shear cracks were not able to propagate in a significant way, shear failure occurred suddenly in the structure, after which the load capacity declined in a linear fashion. The displacement was also observed to increase rapidly with substantial noise, presenting a brittle failure, as shown in Figure 9.

Shear failure of the SFRC beams.
The general process of combined shear-bending failure observed in the SFRC test beams was as follows. Vertical flexural cracks were first observed in the pure bending segment of the test beam, and the length of these cracks increased consistently throughout the test. With the increase in load, flexural cracks below the center of the longitudinal reinforcing bars also developed in the shear span region as the flexural cracks gradually propagated toward the supports. As the load increased to a value near the oblique-section cracking load of the beam specimens, the vertical cracks in the pure bending segment propagated further upward and increased in number. Under the restrictive effect of the steel fibers, the portion of the beam specimen containing shear cracks did not immediately fail: the failure mode was no longer brittle, but ductile, as shown in Figure 10.

Combined shear-bending failure of the SFRC beams.
Load–displacement curves
Figure 11 presents the load–displacement (deflection at mid-span) curves for test beams with different reinforcement ratios P of longitudinal reinforcing bars when the steel fiber content of the concrete was 1% and the shear span ratio was 2. The reinforcement ratios ranged from 0.55% to 2.38%. As seen in the figure, with the increase in reinforcement ratio, the ultimate load capacity of the beams changes considerably.

Effect of longitudinal reinforcement ratio P on the relationship between load and deflection.
The ultimate load capacity of the beam with 2Φ12 flexural reinforcement bars (SFRC2_1_12, P = 0.55%) was 136.5 kN, while the ultimate load capacity of the beam with 2Φ16 (SFRC2_1_16, P = 0.97%) was 184.7 kN, an increase of 26%. The ultimate load capacity of the beam with 2Φ20 (SFRC2_1_20, P = 1.52%) was 225.5 kN, or 1.65 times greater than that of the SFRC2_1_12 and 1.22 times greater than that of the SFRC2_16, while the ultimate load capacity of SFRC2_1_25 (with 2Φ25, P = 2.38%) further increased to 230.9 kN and additional increase of 2.4% over SFRC_1_20. These results reflect the impact of the longitudinal reinforcing bars on the load capacity of SFRC beams, and this effect should be taken into account in the design and application of SFRC structures when longitudinal reinforcement ratios P is between 0% and 1.75%.
Figure 12 presents the load–displacement curve for three different shear span ratios (1.5, 2, and 2.5) when the ρf was 0%, 1%, 2%, and 3%. As can be seen from the figure, with the increase in the shear span ratio, the shear capacity decreased. The shear span ratio also influenced the failure mode of the beams: shear failure largely occurred when the shear span ratio was small, but the beams would fail in a ductile manner (combined shear-bending failure) when the shear span ratio was larger.

The effects of different shear span ratios λ on the load-deflection curves.
Figure 13 presents the load-deflection curves (at mid-span) for different steel fiber contents (0%, 1%, 2%, and 3%) when the shear span ratio λ was 1.5, 2, and 2.5. The graph indicates that (1) with the increase in steel fiber content, the shear capacity increases, but the increment is very small and even declines when the fiber content is equal to 3%, thus it is recommended that the fiber content used in the design of SFRC structures be lower than 2%; (2) the inclusion of steel fibers changes the failure mode of a structure, as for a shear span ratio λ = 1.5, a volume fraction of 1% or below results in a shear failure, while a volume fraction of 2% or above results in a combined shear-bending failure. A higher fiber content clearly leads to higher ductility in the test beams.

Effects of different steel fiber contents ρf on the load-deflection curves.
Evaluation of SFRC beam shear capacity computation methods
First, three existing computational equations for the shear capacity of SFRC beams were evaluated, including the empirical equation (equation (2)) proposed by Sharma,
19
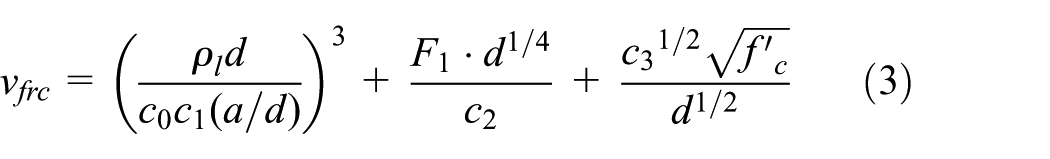
the genetic algorithm fitting equation (equation (3)) from IF Kara,
20
and the 2015 SFRC equations (equations (4)–(6)).
21
These computational equations consider the shear span ratio λ, SFRC compressive strength
Current major computation methods for SFRC beam shear
Sharma 19 conducted experiments on seven beams, four of which used steel fibers with deformed ends. Based on the results of experiments by Batson et al. 11 and GR Williamson and LI Knab, 12 Sharma 19 proposed the following equation to predict the ultimate shear capacity of SFRC beams

where λ is the shear span ratio and
By fitting the oblique section load capacities from 101 stirrup-free sets of SFRC beams (with longitudinal reinforcing steel bars), shown in Table 6, 20 using gene expression programming, IF Kara 20 obtained the following empirical equation

Range of parameters considered in the derivation of IF Kara’s equation. 20

The constants in the formulation are c0 = 3.324, c1 = 0.909, c2 = 2.289, and c3 = 9.436.
Equation (3) mainly considers five variable parameters: the compressive strength of the concrete
Based on the fitting results, the longitudinal reinforcement ratio and effective cross-section height have the most significant effects on the load capacity of a stirrup-free oblique SFRC section. With the increase in the steel fiber reinforcement ratio and the compressive strength of the concrete, the load capacity of the stirrup-free oblique SFRC section increases as well.
The 2015 SFRC 21 states that the computation of the load capacity of the oblique section of rectangular-, T-, and I-shaped section flexural members is to be in accordance with the Code for design of concrete structures (GB 50010-2010) standard (hereafter referred to as 2010 CDCS). 25 In this approach, Vfcs, the design value for the comprehensive shear capacity of the SFRC including the stirrups, replaces Vcs, the design value for the comprehensive shear capacity of the plain concrete and stirrups. The value of Vfcs is computed using the following equations


where Vc is the design shear capacity, computed in accordance with the first item of the Vcs computational equation (6.3.4-2) as specified in the 2010 CDCS 25 on the basis of the strength grade of the SFRC without the effects of the steel fibers on the tensile strength; Vsv is computed in accordance with the second item of the Vcs computational formula (6.3.4-2) as specified in the 2010 CDCS, 25 and is mainly associated with the stirrups; Vfc is the design value of the shear capacity associated with the effects of the steel fibers; λf is the characteristic parameter of fiber; ρf is the volume fraction of the steel fibers; lf/df is the length-to-diameter ratio of the steel fibers; and βv is a coefficient quantifying the influence of the steel fibers on the shear capacity of the oblique section, preferably determined by testing. The values for βv provided in Table 7 25 can be used when no test data are available.
Values of influence coefficients βv for different types of steel fibers. 25

However, the above shear computational equations have the following disadvantages: Sharma 19 and 2015 SFRC 21 neglect the contribution of the longitudinal reinforcing bars to the shear capacity; and Sharma, 19 IF Kara, 20 and 2015 SFRC 21 all heavily rely upon the contribution of the compressive strength to the load capacity of the SFRC beams. However, the research discussed in this article determined that the contribution of the longitudinal reinforcing to shear capacity is significant and that the compressive strength of the SFRC beams was not sensitive to the volume fraction of the steel fibers. Thus, the contribution of longitudinal reinforcing to the shear strength and the use of the compressive strength of the concrete as a parameter to reflect the SFRC shear capacity must be explored further. Notably, none of these previously published equations accounted for the effect of tensile strength on SFRC beam capacity, nor provided a definitive range for the longitudinal reinforcing ratio, nor for the steel fiber volume content.
Proposed method for determining SFRC beam shear capacity
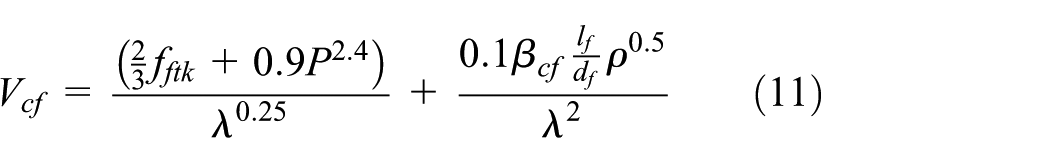
The ANSYS optimal design function was used to fit the test data gathered in this research in order to obtain a rational shear formula. Based on a preliminary analysis of the data, the shear capacity can be given by

where C1–C5 are coefficients to be determined by the solution optimization; λ is the shear span ratio; P is the reinforcement ratio of the longitudinal reinforcing bars; fftk is the tensile strength of the SFRC; lf/df is the length-to-diameter ratio of the steel fibers; ρ is the volume fraction of the steel fibers; and βf is the same as in equation (3), both in significance and value.
The differences between the
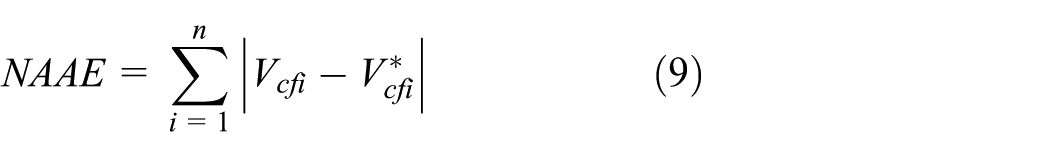
with the mean value of NAAE given by

where n is the number of experimental groups. Equation (8) corresponds to the minimum solution of AAE, which is optimal, allowing for coefficients C1–C5 to be obtained, providing the final optimal shear formula.
Optimization process
Part I of the optimization consisted of defining the arrays and inputting the basic parameters. A two-dimensional array with 101 columns was defined, with the number of lines corresponding to the number of test groups. The test parameters shown in Table 8 were input into the defined two-dimensional array. As mentioned above, when the steel fiber volume content was over 2%, the increase in the shear strength of SFRC was found to be insignificant and therefore is of no use in the set of fitting data. Accordingly, during computation, the fiber content was capped at 2%. Because it was found that when the longitudinal reinforcement ratio was over 1.75%, the shear strength of SFRC did not significantly increase with the increase in reinforcement ratio, the data for SFRC2_1_20 would not provide acceptable fitting, so during computation, the longitudinal reinforcement ratio was capped at 1.75%. A total of 15 data sets were fitted as shown in Table 8.
Optimized data for derivation of proposed SFRC beam shear equation.

SFRC: steel fiber–reinforced concrete.
Part II of the optimization consisted of the definition of parameters and the operation of the arrays. The coefficients C1–C5 were defined, and the program language of equation (1) was compiled. In order to check their results separately, the tensile contribution of the concrete given by equation (1) was stored in array Column 6, the contribution of the flexural reinforcing bars was stored in array Column 7, and the contribution of the steel fibers was stored in array Column 8. Array Column 9 contains the total of the results of the three optimization parts, and Column 10 provides the AAE.
Part III of the optimization consisted of the implementation of the determined optimal design. The coefficients C1–C5 were defined as a variable DV. The optimal range was determined according to the preliminary computations. The total NAAE, 3 MPa, was selected as the optimal boundary condition. The minimal AAE was selected as the current boundary condition, and the numerical values for C1–C5 corresponding to the minimal AAE were provided as the solution.
Results and comparisons
The optimal design was implemented to obtain 34 optimizing sequences. The 34th sequence, corresponding to AAE = 0.20611, was the optimal sequence. The coefficients C1–C5 were then defined as: C1 = 0.9024, C2 = 2.409, C3 = 0.1026, C4 = 0.0 9989, and C5 = 2.074. For computational simplicity, the coefficients were taken as C1 = 0.9, C2 = 2.4, C3 = 0.1, C4 = 0.5, and C5 = 2. The corresponding final optimized formula for the ultimate shear strength of an SFRC beam can then be written as
where 0 < ρ ≤ 2%, when ρ > 2%, ρ = 2%; 0 < P ≤ 1.75%, when P > 1.75%, P = 1.75%, 1 < λ < 3.
The predicted values obtained by the fitted equation and the test values were compared as shown in Figure 14. As can be seen from the figure, the results of the fitted equation coincided well with the test results, accurately reflecting the effects of parameters such as the steel fiber volume content, the longitudinal reinforcement ratio, and the shear span ratio.

Comparison of predicted and experimental values: (a) effect of steel fiber volume content, (b) effect of longitudinal reinforcement ratio, and (c) effect of shear span ratio.
Conclusion
Experiments were conducted on 19 sets of test beams subjected to a two-point symmetrical concentrated load, providing experimental data and failure mode information with respect to the compression, splitting, and shear strengths of the SFRC beams. The experimental data included the observed strain, crack width, and vertical displacement, as well as the synchronous load applied to the test beams. By analyzing the experimental data, detailing the changes in the load capacity of the test beams with changing concrete strength, longitudinal reinforcement ratio, shear span ratio, and steel fiber volume content, the following conclusions can be drawn:
The incorporation of steel fibers acts to suppress crack propagation, improve both the rigidity and ductility of the structure, and lead to a decrease in the mid-span deflection, meanwhile with the increase in the longitudinal reinforcement ratio, the shear capacity increases significantly. However, it is recommended that the design content of steel fiber does not exceed 2%, and the longitudinal reinforcement ratio does not exceed 1.75%, provided the design requirements meet the standards.
The relationship between the compressive strength
The problems of the major existing shear formulae were determined, discussed, and addressed, such that the contribution of the longitudinal reinforcing bars, application range of the steel fiber volume content, and the compressive strength were accounted for, in the proposed new ultimate shear model (see equation (10)) for SFRC beam capacity. The results of the proposed model were then compared to the test results and demonstrated to be accurate using a sensitivity analysis.
Footnotes
Handling Editor: MA Hariri-Ardebili
Data availability statement
The data used to support the findings of this study are available from the corresponding author upon request.
Declaration of conflicting interests
The author(s) declared no potential conflicts of interest with respect to the research, authorship, and/or publication of this article.
Funding
The author(s) disclosed receipt of the following financial support for the research, authorship, and/or publication of this article: This research was funded by the financial support from the project of the National Key R&D Program of China under grant numbers 2018YFC0809600 and 2018YFC0809606 and the MOE Key Lab of Disaster Forecast and Control in Engineering of Jinan University under grant number 20180930004.