
Abstract
Reduction of the driving range under either cold temperature or real-world running condition has become the biggest challenge for battery electric vehicle (BEV). In this paper, a simulation platform that combines a kinematics model, a thermal management model, and extracted typical running conditions has been established to estimate the energy flows inside the electric vehicle under cold temperature and real-world running condition. Three vehicles have been selected to validate the accuracy of the simulation platform, giving an accuracy between 90.6% and 96.6% according to different running conditions. Under highway running condition, the driving range could be reduced by 54%. Under urban running condition, when the environment temperature drops down to −20°C, the driving range is only 49.1% of that under 20°C. In addition, there could be a 4.4% increase in driving range if the target cabin temperature could be decreased from 28°C to 20°C. According to simulation, the application of motor waste heat recovery, internal gas recirculation, and heat pump, could increase the driving range at −7°C under urban running condition by 3.5%, 2.9%, and 3.9%, indicating a 10.3% improvement in total. This has been validated via experimental test after implementing these three approaches onto the test vehicle.
Keywords
Introduction
The research on the variation of mileage of electric vehicles under different environment temperature and real world running condition has always been a hot topic. There is a notable decrease of driving range for electric vehicle especially under high-speed, high-temperature, and low-temperature running condition, which has incurred customer anxiety and hindered the development of electric vehicle. Therefore, identification of the key factors and a reasonable management of energy flow of electric vehicle are crucial in terms of mitigating consumer anxiety and promoting the electric vehicle market. 1
Limited by the charging infrastructure, a good understanding of the remaining driving range is crucial for electric vehicle drivers. More reliable mileage can be obtained by not only evaluating potential influencing factors of mileage and energy consumption, but also establishing an appropriate forecasting mechanism and equipped with advanced on-board information system. 2 Zhao et al. 3 developed a set of systematic and practical typical urban driving cycle condition of electric vehicles based on sampling survey and analytic hierarchy process. Cvok et al. 4 proposed an energy management strategy that includes heating, ventilation, and air conditioning systems. The intention is to achieve a balance between energy consumption and comfort based on the system control optimization algorithm of dynamic programming. Yan et al. 5 established an energy consumption model for electric vehicle and achieved a minimization of the overall energy consumption under different driving scenarios by combining with the calculation and optimization algorithm of energy flow. Al-Wreikat et al. 6 analyzed the real driving data of electric vehicles and found that the energy consumption of electric vehicles increased under low temperature condition, and obtained the relationship between environment temperature and driving characteristics in road testing. Morlock et al. 7 derived the sensitivity function of external parameters to energy consumption, based on which a detailed energy consumption model of electric vehicles based on specific energy management strategies and environmental factors was established. This model was characterized by low variance and high prediction accuracy.
Yuan et al. 8 derived a simplified analytic function for energy consumption estimation of electric vehicles. Regression analysis was used to decouple the influence of running condition, and a method that could independently evaluate energy consumption characteristics was proposed. Fetene et al. 9 analyzed the energy consumption and driving mileage of electric vehicles based on the big data by taking into account the driving mode, road type, and weather condition under daily driving. Li et al. 10 undertook an analysis on the sensitivity of each factor on the energy consumption based on experimental design, and generated a two dimensional model to estimate the energy consumption of electric vehicles under specific use condition. Lindgren and Lund 11 gave a theoretical explanation of how environment temperature could influence the energy consumption by combining an empirical lithium-ion battery model and the vehicle thermal model. By collecting real driving data, Zhang et al. 12 extracted and studied the key factors affecting vehicle energy consumption, proposed a machine learning energy consumption prediction framework. Lei et al. 13 proposed a strategy by using real-time traffic information described by the average speed, average acceleration, and standard deviation of speed for different road sections. Based on gear shift control, Tian et al. 14 proposed the method to improve further research on the relationship between different road sections and vehicle driving conditions and gears. This was applied to actual energy consumption prediction.
Hwang et al. 15 reviewed how heat is generated across a li-ion cell as well as the current research work being done on the four main battery thermal management types. Additionally, the strengths and weaknesses of each battery thermal management type are reviewed in this study. Vikram et al. 16 had extensively studied hybrid battery thermal management system (BTMS), aiming to enhance the thermal performance of conventional BTMS to cope with the stringent thermal requirements under high ambient temperature and fast charging conditions. Rohini et al. 17 proposed the BTMS to further develop the effectiveness of batteries by maintaining appropriate thermal conditions, eliminating temperature-related risks and improving the overall performance of electric vehicles. To address the battery cooling optimization problem, Wu et al. 18 established an electro-thermal-aging model for LiFePO4 battery packs. A control-oriented airborne BTMS model was proposed and verified at different speed profiles and temperatures. Liu et al. 19 proposed an optimized fuzzy proportional-integral-differential algorithm used in a rapid temperature control system for automotive batteries. Based on the proposed algorithm, an intelligent thermal management system with temperature feedback mechanism are built by switchable thermoelectric devices in working mode, simultaneously offering both heating and cooling capabilities. Sagaria et al. 20 established an electric vehicle model including battery capacity, energy density, speed, temperature, and driving behavior to study the energy consumption and driving range of the vehicle. Yu et al. 21 established a test process under high and low environment temperature, and carried out experimental test on 18 electric vehicle. Based on the test results, the influence of vehicle type and battery type on energy consumption under normal, high, and low environment temperature was studied. Liu et al. 22 established an energy consumption model for electric vehicle based on GPS data of electric vehicles and adopted regression to discuss the impact of environmental temperature on vehicle energy consumption.
According the literature review above, the influence of temperature and running condition could be studied by establishing a simulation model. However, only limited parameters have been taken into account and empirical functions were used, which constrained the accuracy and flexibility of the prediction model. Here in this paper, an Kinematics–Thermal Management coupled model has been established, which includes most of the key elements of battery electric vehicle, detailed revealed in next section. In addition, a method of obtaining typical real-world running condition has been proposed and imported to the model. Hence, the driving range of battery electric vehicle under different environment temperature and real-world running condition could be accurately analyzed.
Kinematics-thermal management coupled model
In order to better study the influence of environment temperature and running condition on the driving range of the BEV, a model is established by MATLAB-Simulink, which consists of one-dimensional kinematic model and one-dimensional thermal management model. Parameters such as motor speed, motor torque, battery current, and battery voltage are calculated in kinematics model and fed into the thermal management model in which the temperature variation in battery and motor are calculated. Then the real-time temperature variations are used to regulate the performance of battery and motor in the kinematics model. This makes it possible to estimate the energy consumption accurately under a wide range of environment temperature. Here in this section, China Light-duty Vehicle Test Cycle (CLTC) 23 has been used to demonstrate model validation.
One-dimensional kinematics model
Vehicle kinematics model
In order to describe the driving process of the vehicle, the time t consumed by driving a running condition is divided into equal parts m, then each time interval

For a given running condition when the speed profile is prescribed as time domain (e.g. CLTC cycle), the speed

Where,
Since there are enough equal parts of operating condition, each equal part can be treated as a trapezoid. Then the displacement in the n-th time interval is as follows:

After m-th time intervals, the vehicle runs along the speed profile, and the driving distance is the sum of each time interval, namely:

According to the kinematic formula, the acceleration

In order to overcome coasting resistance and acceleration resistance, the required traction force

The traction torque generated by the wheel end will be transmitted to the motor end through the transmission system, and the corresponding required torque is:

Where, R is the rolling radius of the tire,
Battery–motor model
According to formula (7), when

Where, recup is recovery flag bit, and b is braking capability.
While the demand torque is positive sign, it indicates running condition. Otherwise, it is energy recovery condition. The motor torque at the n-th time point is:

According to the vehicle speed, the engine speed

The actual output power should not exceed the external characteristics of the motor, then the power of the motor at the nth time point should be:

Where,
Similarly, there is a power limit for battery, hence the battery power at the n-th time point is represented as follow:

Where,

Where,
The cumulative energy consumption after the m-th time interval is:

The total available energy is:

Where, rc is cell capacity, U is rated voltage, and U can be estimated according to equation below:

and
The basis for determining the internal resistance R is to build an accurate battery simulation model, which is determined based on the equivalent circuit and Hybrid Pulse Power Characteristic (HPPC) test results, as shown in Figure 1. The HPPC test requirement matrix is shown in Table 1, which includes different SOC states and corresponding battery temperatures.

RC equivalent circuit model.
HPPC test requirement matrix.

In the test, the HPPC contains a different number of pulse currents, but the number of pulse currents is always an even number. This is because the pulses always come in pairs and have a period of 20 s (one charging pulse and one discharge pulse), which allows the battery to pass through a series of pulses without changing the state of charge (SOC) of the battery. Four kinds of pulse currents were used in this test, with current values of 0.1 C, 0.33 C, 0.5 C, and 1 C in sequence.
Finally, based on equations (17)–(19) and HPPC test data, the resistance R is calculated.


Where,
There are two methods of calculating the driving range under CLTC: one is to follow the cycle repetitively until the cumulative energy consumption equals the available energy of the battery. The other is to run the model just for one CLTC cycle and record the energy consumption. By comparing the available energy of battery and the energy consumption for one cycle, the driving cycle can be estimated according to equation below 23 :

The corresponding energy consumption rate is 23 :

Where,
Thermal management model
Coasting resistance correction
As is known, the vehicle coasting resistance is sensitive to environment temperature. The lower the temperature is, the bigger the coasting resistance will be. The influence of environment temperature on coefficients

Based on equation (22), according to the slip resistance data of a certain type of base vehicle, the slip resistance change from low temperature −20°C to high temperature 40°C is obtained, as shown in Figure 2.

Variation of vehicle coasting resistance under −20°C to 40°C.
Cabin air conditioning system model
When the environment temperature is beyond ambient temperature, lower than 0°C or higher than 35°C, the energy consumption of air condition system has become the biggest contributor to the reduction of driving range of battery electric vehicle. At first, the cooling/heating load of the cabin needs to be estimated by considering environment temperature, cabin target temperature, heat transfer coefficient.
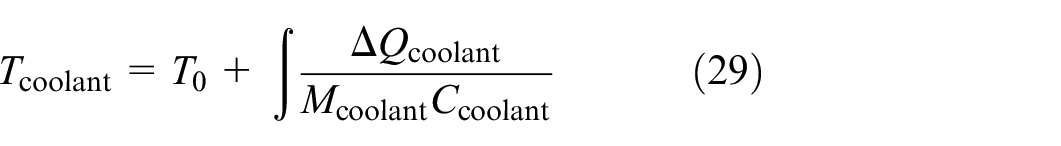
The variation of cabin air temperature is calculated as follow 18 :

Where,

Where
The cooling/heating load

Once the cooling/heating load has been obtained, the estimation of compressor/positive temperature coefficient (PTC) power

Where η is the system efficiency of PTC and COP of compressor. The empirical values for the PTC thermal efficiency and compressor COP are 0.9 and 2.5, respectively.
Battery temperature
A variation in battery temperature yields a change in battery inner resistance, open circuit voltage, battery capacity, and cut-off voltage, leading to a change in the available electric capacity of battery. Taking into account the variation of battery temperature makes it possible to calculate the available electric capacity of battery under real time.
Battery pack temperature

The corresponding heat transfer

Where,
The battery module temperature
The corresponding heat transfer of coolant
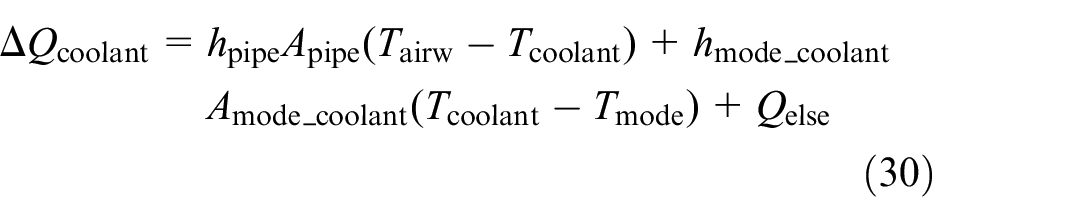
Where,
The heat exchange of the water-cooled plate and the heat exchange of between battery case and battery module are shown respectively 21 :

The heat change

The corresponding battery temperature

Where,
For a given battery cell, the available electrical capacity under different environment temperature can be obtained according to a matrix of experimental tests. This makes it possible to generate a map of battery available electrical energy under various environment temperature. In the simulation model, the estimated settling temperature can be used to index the available electrical energy according to the map.
Kinematics-thermal management model
In Section “One-dimensional kinematics model” and “Thermal management model,” the theory of vehicle kinematics and thermal management has been discussed. In this section, a kinematics-thermal management coupled model has been established in Simulink based on previous theories. Figure 3 reveals the layout of the kinematics-thermal management coupled model. This makes it possible to estimate the EV driving range and the corresponding energy balance under different environment temperature.

One-dimensional kinematics and thermal management coupling model.
Figure 4 shows the simulation schematics of the kinematics and thermal management coupled model:
Step1: The running condition needs to be prescribed. Initially, standard running condition has been adopted, such as CLTC, worldwide light-duty test procedure (WLTC), and etc. In Section “Extraction of real world running condition,” the introduction of the extraction of real world running condition is shown.
Step2: The characteristics of the vehicle needs to be defined, such as weight, rolling resistance of tire, aerodynamic resistance coefficient, battery power curve, motor power curve, and etc.
Step3: The kinematics model and thermal management model runs simultaneously. Interaction parameters are transferred between these two models. For example, motor speed and torque are calculated in the kinematics model and fed to the thermal management model where the motor temperature can be obtained. According to the real-time motor temperature, the motor performance can be estimated in the kinematics model. Therefore, the real-time energy consumption of key components can be estimated, which is necessary to calculate the driving range under different running conditions.
Step4: The simulation terminates while the defined condition are met: the vehicle cannot follow the target speed of the running cycle and the maximum speed cannot exceed 50 km/h even if the pedal setting in the model has been set to be 100%.

The calculation framework of the model.
Three key parameters including speed, energy consumption of thermal management system, and battery temperature have been chosen to evaluate the accuracy of the model.
Figure 5 shows the comparison of the simulated vehicle speed and the target speed under CLTC. In the model, proportional integral derivative (PID) control has been adopted to regulate the acceleration pedal in order to follow the speed pattern under a specific running condition. As can be seen, the biggest difference occurs at time 863 s, giving a 1.64 m/s difference. This indicates a reasonable agreement.

Vehicle speed following in CLTC.
In Figure 6, the comparison of the simulated and experimental data regarding the energy consumption of the thermal management system. As is shown, the variation of energy consumption from simulation is less than that from actual test. This is mainly because start-off strategy of the PTC heater is simplified in the simulation model. However, the discrepancy of the averaged power consumption between simulation and experiment is up to 9% (1638 W in simulation and 1510 W in experiment), which presents an acceptable level of confidence.

Comparison of transient power of air conditioners.
As discussed previously, the temperature of the battery pack plays a vital role in the estimation of the vehicle performance, especially under cold temperature. Figure 7 shows the comparison of the variation of battery temperature and SOC between simulation and experiment. The initial temperature is the same, set to be −6°C. The settling temperature from simulation is 13.2°C while the settling temperature from experiment is 13.0°C, which gives reasonably good agreement.

Battery temperature comparison.
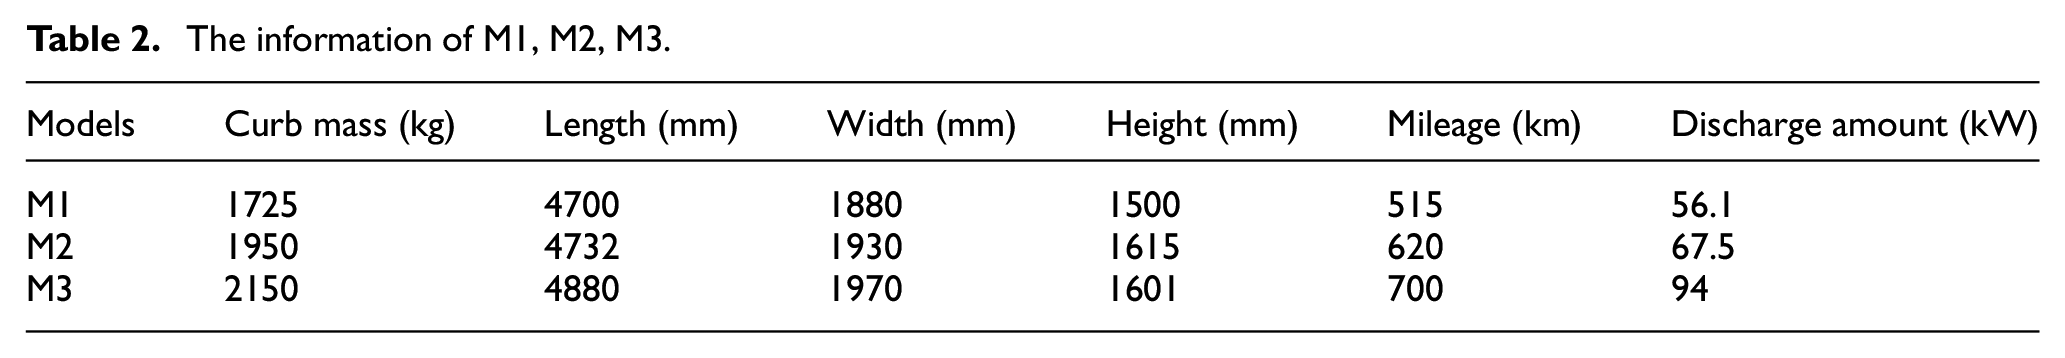
Given that the coupled model provides good accuracy in key parameters, three different vehicles have been selected to examine the validity of the couple model when predicting the driving range under different environment temperature under CLTC, illustrated in Figures 8 to 10. NT, HT, LT represent normal temperature (23°C), high temperature (30°C), and low temperature (−7°C) while M1, M2, and M3 represent three versions of vehicle. The M1, M2, and M3 represent three electric models, detailed information shown in Table 2. It can be seen that the accuracy locates between 96.5% and 98.5%, indicating good agreement between simulation and experiment.

The comparison between simulation and experiment under normal temperature over CLTC.

The comparison between simulation and experiment under high temperature over CLTC.

The comparison between simulation and experiment under low temperature over CLTC.
The information of M1, M2, M3.
Extraction of real world running condition
Identification of real world running condition
As is known, speed is normally used as the core parameter which dictates the characteristics of a specific running condition. Big data has been adopted to conduct analysis on the variation speed of typical users. Here in this paper, data from 80K users within a time region of 3 months have been covered. In general, two driving scenarios have been studied: one being unban running condition, and the other one being highway running condition.
The data of users under real-world driving have been divided into different segments. The segment is defined to the driving between two charging behavior. Within one segment, if the average speed is over 70 km/h and lasts over either 1 h or 50 km, this segment is considered as highway condition. Otherwise, the segment is classified as the urban running condition. In addition, the proportions of idling, acceleration, and deceleration have been examined to generate a clearer picture of the inherent characteristics of typical running condition.
In Figures 11 and 12, the proportions of speed regions and idling/acceleration/deceleration have been shown. As can be seen, the characteristics for highway and urban running condition are distinguishable. The average speeds for highway and urban running condition are 81 and 43 km/h, respectively. Idling accounts for 10% of time period for urban running condition and nearly null time period for highway condition. Interestingly, constant speed accounts for largest proportion both for highway and urban running condition.

Proportion of speed regions.
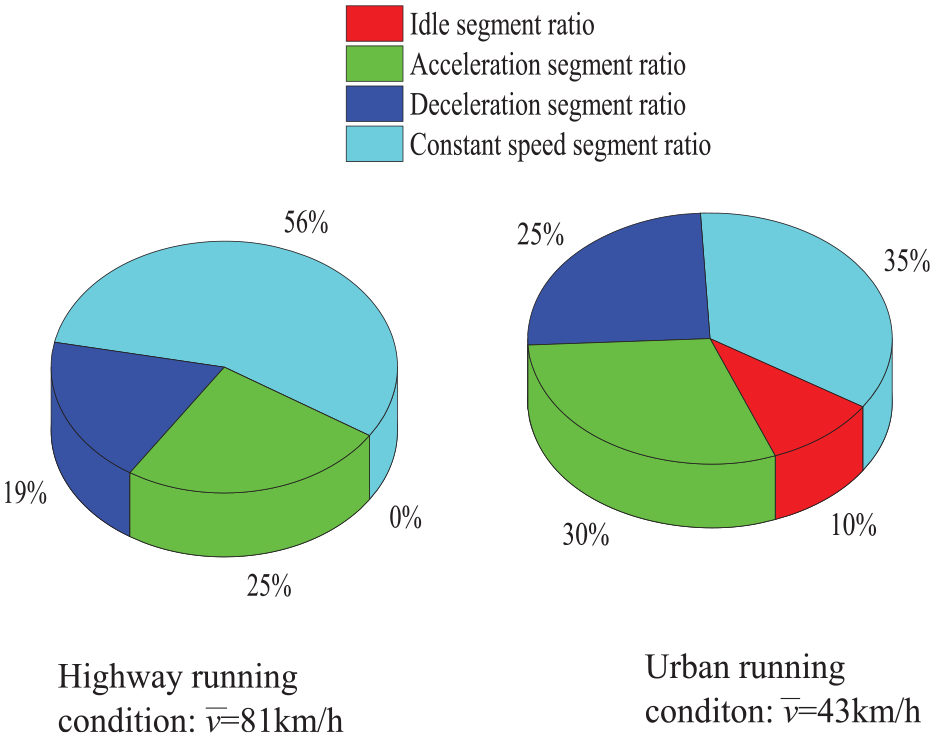
Proportion of idling/acceleration/deceleration/constant speed.
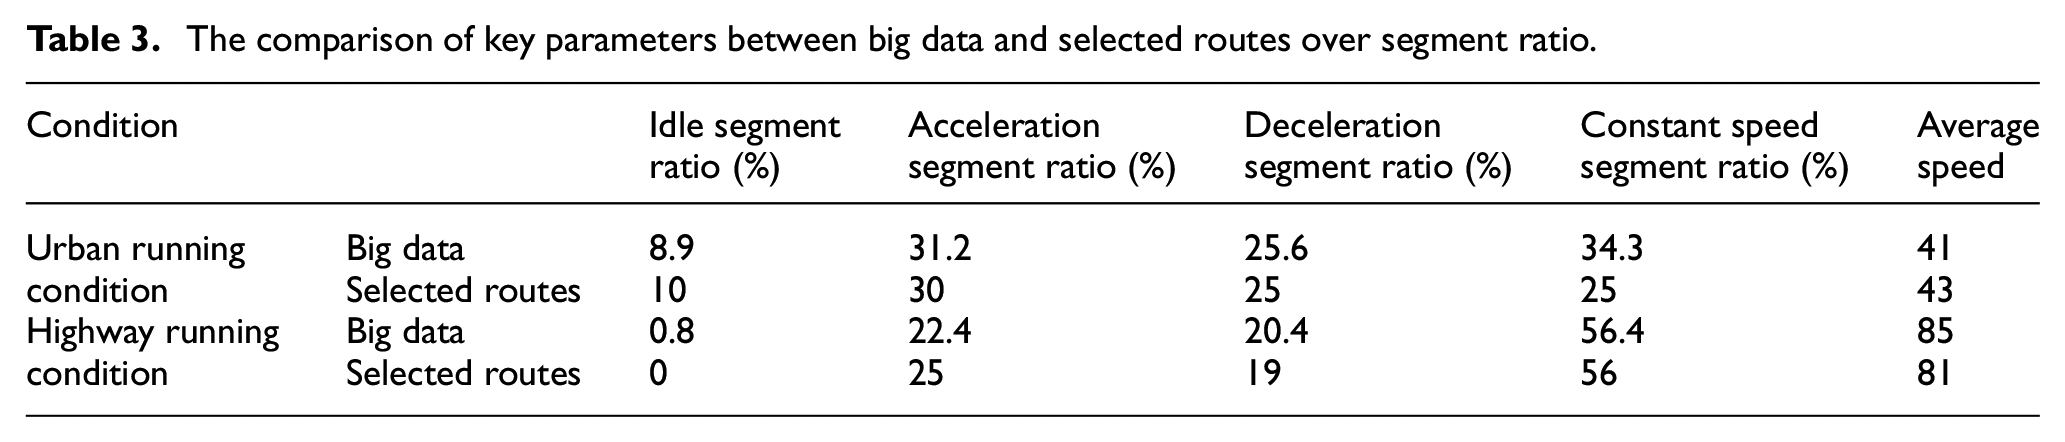
After identifying the speed proportions, a specific test route needs to be defined to conduct both virtual and experimental analysis. At first, an initial route was proposed, then an actual driving test was carried out to investigate the speed proportions. Then the route was modified based on the difference between the obtained speed proportions and that from big data. Repetitive trials have been done until good agreement in speed proportions compared to big data has been achieved. Figure 13 shows the routes for urban running condition and highway running condition while Tables 3 and 4 reveals the comparison of key parameters between big data and selected routes. A good agreement between test route and big data indicates the test route is representative of the daily driving.

The routes for urban running condition and highway running condition.
The comparison of key parameters between big data and selected routes over segment ratio.
The comparison of key parameters between big data and selected routes over speed ratio.

Extraction process
Once the test route has been decided, the next step is to extract the characteristics such as the vehicle speed and the slope. The start point and the end point is set to be at the same place in order to eliminate the influence of a variation in altitude. AVL Drive is capable to provide slope by mounting the acceleration sensors at the bottom of the driver seat and the suspension. The vehicle speed is obtained through CAN bus and recorded by AVL Drive.
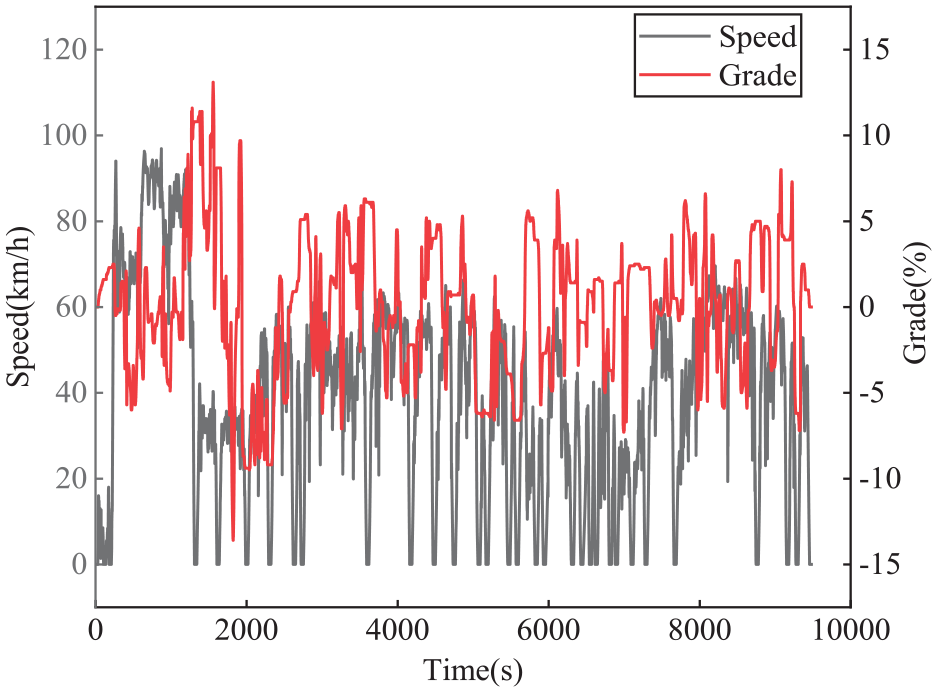
With AVL drive equipped, the test vehicle needs to follow the route three times, which gives three sets of raw data. Initially, the raw data is based on time domain. Given that slope is strongly linked to location, the raw data have been transferred to be based on distance domain. Then take average of the three sets of data and the dedicated speed and slop profile can be obtained. Figures 14 and 15 have shown the extracted speed and slop profile for urban running condition and highway running condition.
The speed profile and slope for urban running condition.

The speed profile and slope for highway running condition.
The final step is the validity check. This has been done by calculating the cumulative variation of the altitude based on the equation below. Theoretically, the cumulative variation of the altitudes should be zero given that the start point and the end point has been set to the same location. Figures 16 and 17 reveal the cumulative variation of altitude for two typical running condition. As can be seen, the magnitude of the variation is negligible, giving acceptable validity of the extracted running condition.

The variation of cumulative altitude for urban running condition.
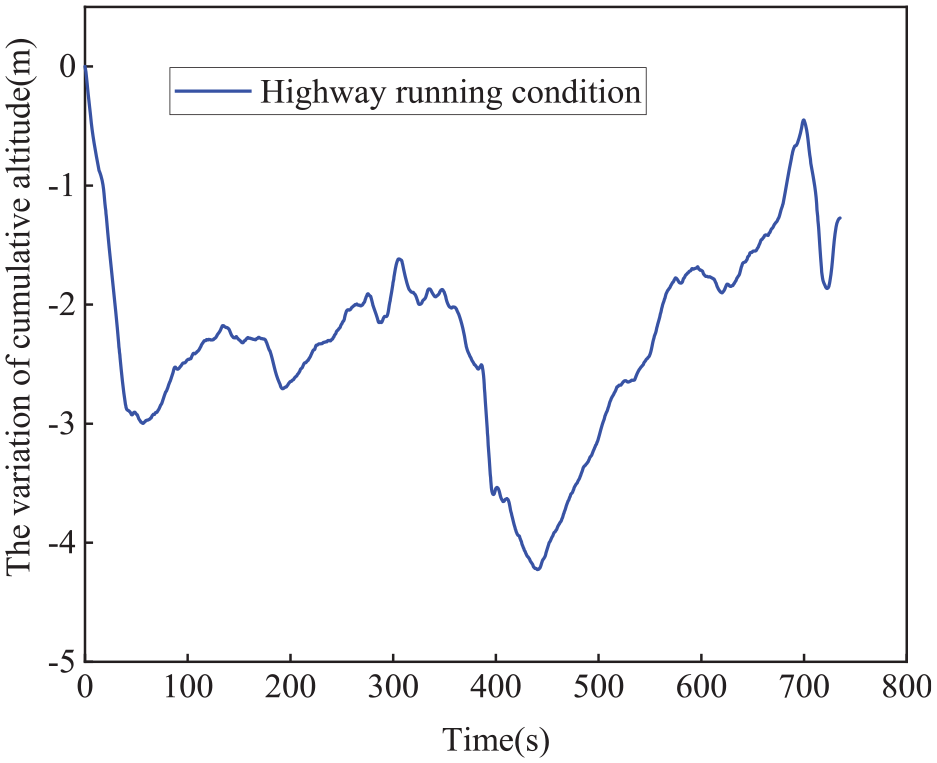
The variation of cumulative altitude for highway running condition.
Validation of simulation accuracy
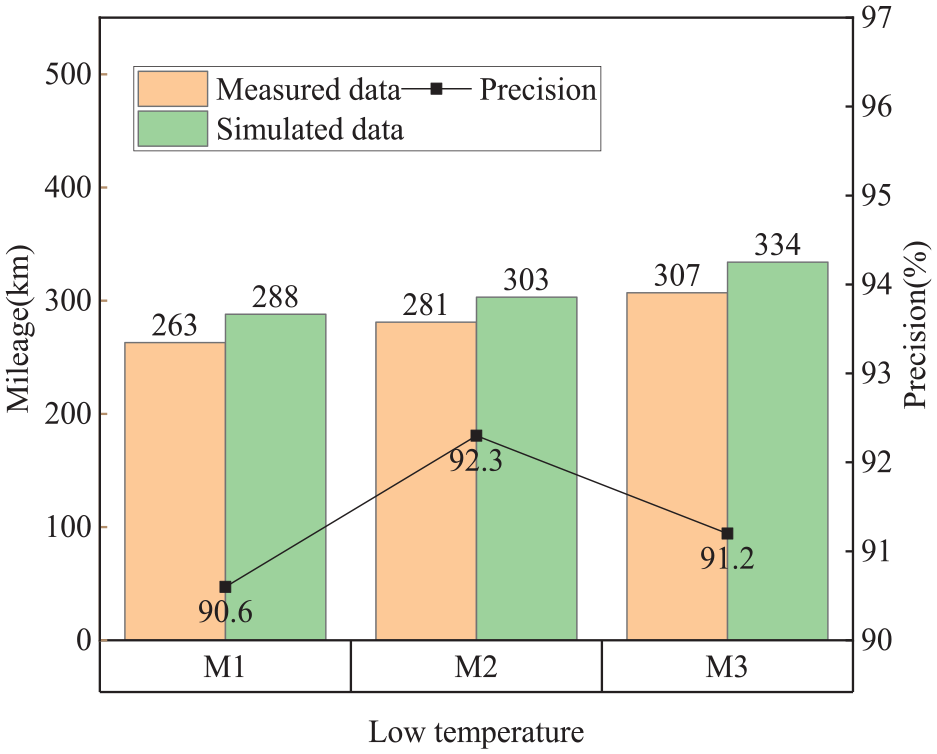
The extracted running condition have been imported to the kinematics and thermal management coupled model. Hence the simulation accuracy of the coupled model can be evaluated by comparing the simulated driving range with the actual test results at different environment temperature under both urban and highway running condition. Similarly, three different vehicles have been selected. It can be seen from the Figures 18 to 23 that the accuracy for these three vehicles are between 90.6% and 96.6%, which is reasonably good.

The comparison between simulation and experiment under normal temperature over urban running condition.

The comparison between simulation and experiment under high temperature over urban running condition.
The comparison between simulation and experiment under low temperature over urban running condition.

The comparison between simulation and experiment under normal temperature over highway running condition.

The comparison between simulation and experiment under high temperature over highway running condition.

The comparison between simulation and experiment under low temperature over highway running condition.
Analysis and application
Analysis
In previous sections, a simulation platform that is capable of estimating the driving range under various environment temperature and different running condition has been established. In this part, research has been extended to study system performance under different temperature and running condition. The vehicle is equipped with a lithium-ion battery with a nominal voltage of 395 V, a nominal capacity of 147 Ah, a layered ternary material for the anode and graphite for the cathode.
Figures 24 and 25 show the variation in energy consumption of thermal management system under different environment temperature, cabin target temperature, and running condition. As can be seen, the energy consumption is greatly sensitive to both temperature and running condition. The average power increases as the environment temperature drops and the cabin target temperature increases. For example, under urban running condition, the average power at −20°C environment temperature and 20°C cabin target temperature is nearly two times to that at 0°C environment temperature and 15°C cabin target temperature. Interestingly, the average power consumption under highway condition is 1–1.5 higher compared to comprehensive condition. This is because the driving time under highway condition is much shorter. The power consumption is high at the beginning then decreases gradually until it stabilizes to a certain value. Therefore, for the same heating load, shorter running time yields higher average thermal management power.

The variation of energy consumption of thermal management system under different environment and cabin target temperature over urban running condition.

The variation of energy consumption of thermal management system under different environment and cabin target temperature over highway running condition.
Figure 26 shows the variation of available electrical energy of battery under different environment temperature over urban and highway running condition. When the temperature is down to −20°C, the available electrical energy of battery is reduced by 20.4%. This is because low temperature affects the transfer activity of lithium ions between the positive and negative electrodes, leading to a decrease in battery performance. When the temperature goes above 25°C, there is hardly a change in the available electrical energy of battery. Interestingly, the running condition makes negligible difference on the available electrical energy of battery.
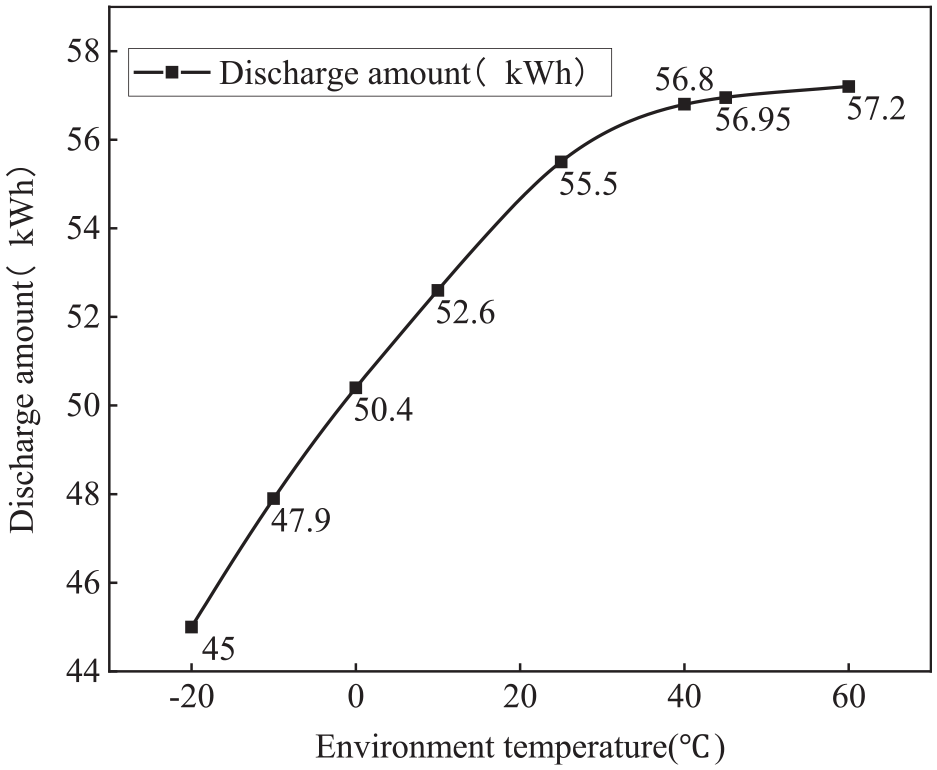
Variation of available electrical energy of battery under different environment temperature.
The variation of energy consumption of thermal management system and available electrical energy of battery has been investigated. The corresponding driving range of an A class sedan under different temperature and running condition have been illustrated in Figures 27 and 28. The driving range under highway running condition is lower compared to urban running condition. Under the same running condition, a variation in temperature could yield up to 50% reduction in driving range and low temperature incurs bigger influence.

The variation of driving range under different environment and cabin target temperature over urban running condition.
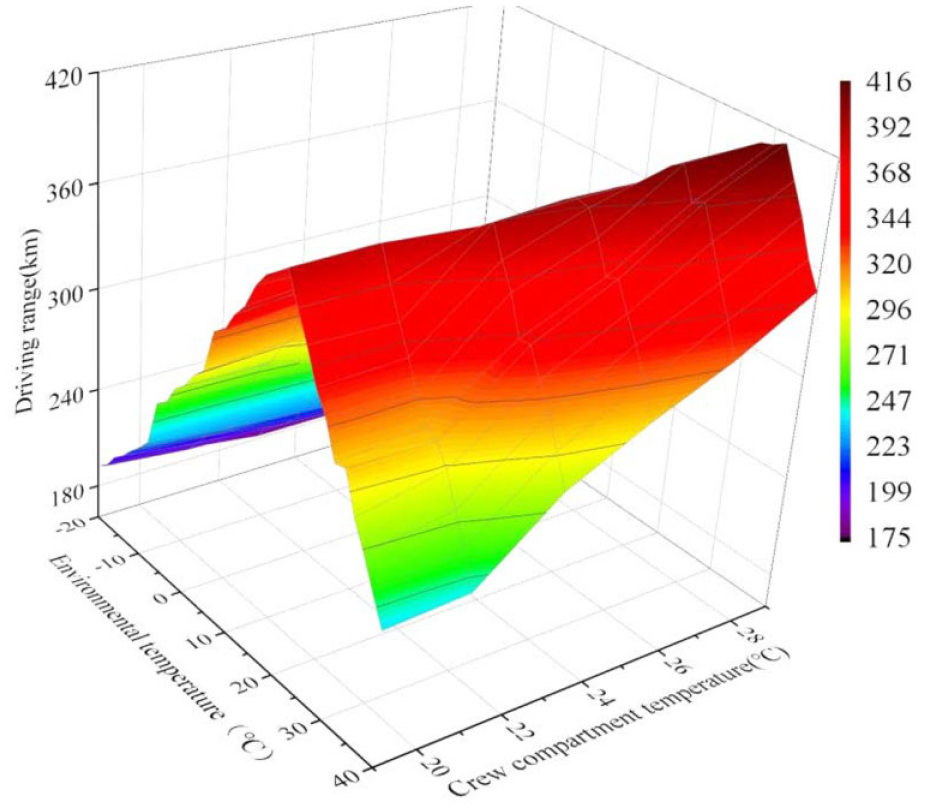
The variation of driving range under different environment and cabin target temperature over highway running condition.
Applications
In previously section, it has been concluded that the driving range under cold temperature reduces dramatically, which has become one of the biggest concern form BEV users. In this section, possible means to improve the driving range under cold temperature has been investigated. The simulation platform makes it possible to analyze the energy flows in details. Figure 29 shows the energy balance of a typical A class sedan under −7°C environment temperature and 20°C cabin target temperature under unban running condition. As is shown in the Figure, the driving range remains to be only 52% compared to that under ambient temperature (25°C environment temperature), indicating a 48% reduction of driving range. Specifically, the energy consumption of thermal management system accounts for 29% reduction of driving range and the reduction of available electrical energy of battery yields 10% reduction of driving range. A decrease in drivetrain efficiency, a reduction of charging and discharging efficiency of battery, and the increase of coasting resistance accounts for 3% reduction of driving range each.

Energy balance of an A class sedan under −7°C environment temperature and 20°C cabin target temperature over urban running condition.
According to the energy balance, the energy consumption of thermal management system and the available electrical energy of battery are the top2 influence factors. Possible approaches that could reduce the energy consumption of thermal management system and increase the available electrical energy of the battery has been studied.
In general, there are two ways to reduce the energy consumption of the thermal management system, one to improve the system efficiency reduce the heating load while the other one to reduce the heating load. The application of internal gas recirculation could effectively reduce the heating load by recirculating part of the warm air inside the cabin. However, the amount of the recirculated air needs rigorous consideration to avoid mist on window. The application of heat pump helps to improve the efficiency of thermal management system as the Coefficient of Performance (COP) is between 1.5 and 2. Raising the battery temperature rapidly plays a vital role in improving the available electrical energy of battery. In this paper, motor waste heat recovery has been adopted to heat up the battery. Given that coolant has been directed to motor to carry out heat from the motor. Instead of rejected into the ambient at the radiator, heat has been moved to the battery via coolant. Therefore, the battery temperature can be raised rapidly.
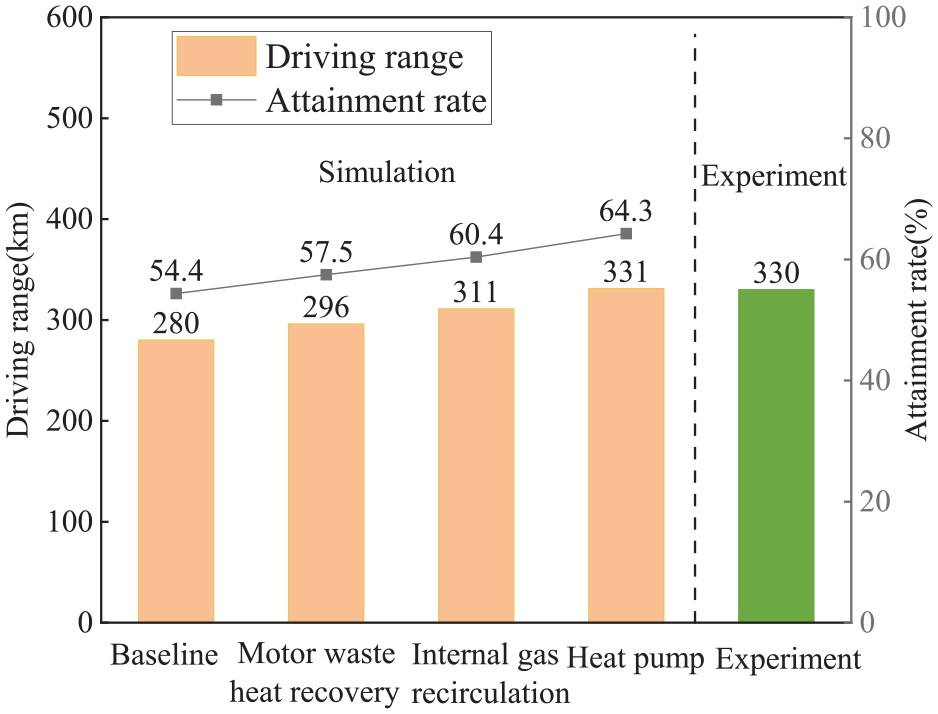
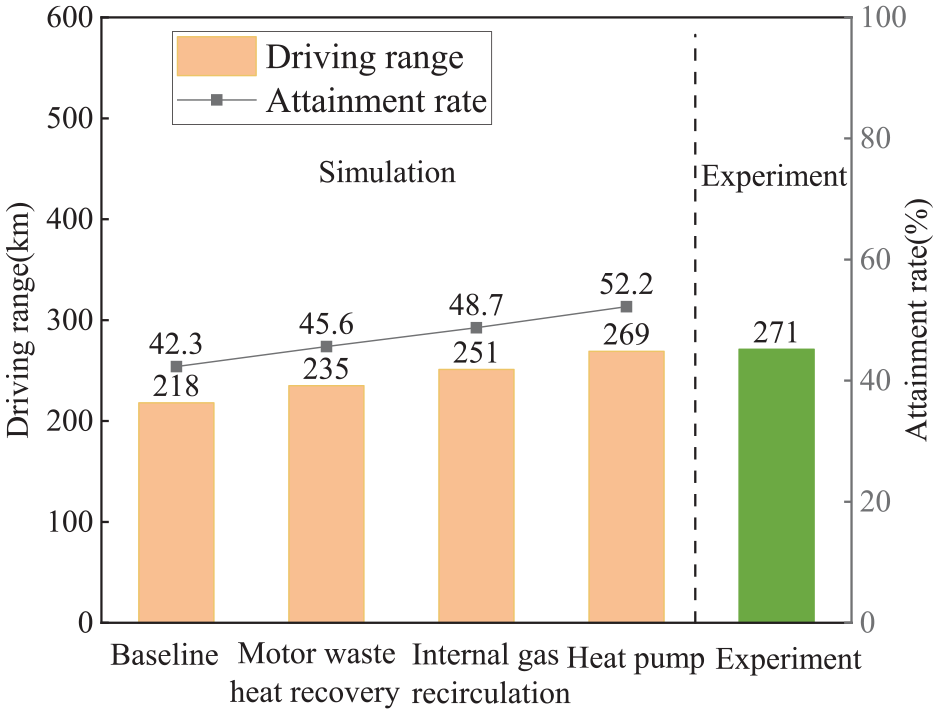
Figure 30 represent the effect of internal gas recirculation and heat pump on reduction of energy consumption of thermal management system. Under −7°C, the application of internal gas recirculation and heat pump indicate 11.44% and 27.11% reduction in energy consumption of thermal management system individually. Figure 31 reveal the effect of motor waste heat recover on battery temperature and the available electrical energy of battery. As is shown, the settling battery temperature can be raised by 8°C and the available electrical energy of battery can be improved by 6.73%. Figures 32 to 35 show the roadmap of the improvement of driving range under −7°C environment temperature and 20°C over urban running condition, CLTC, WLTC, and highway running condition, indicating a 10.3%, 9.9%, 9.9%, 10% improvement respectively.

The effect of internal gas recirculation and heat pump on reduction of energy consumption of thermal management system.
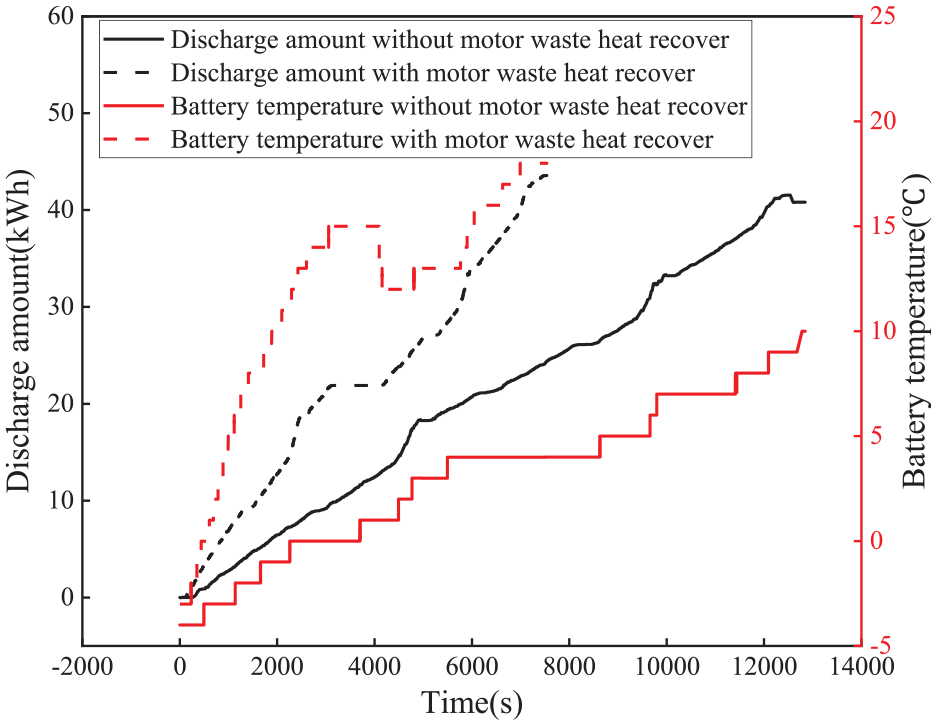
The effect of motor waste heat recover on battery temperature and the available electrical energy of battery.

Roadmap of the improvement of driving range under −7°C environment temperature and 20°C over urban running condition.
Roadmap of the improvement of driving range under −7°C environment temperature and 20°C over CLTC.
Roadmap of the improvement of driving range under −7°C environment temperature and 20°C over WLTC.

Roadmap of the improvement of driving range under −7°C environment temperature and 20°C over highway running condition.
Conclusion
In this paper, a simulation platform that consists of a kinematics and thermal management coupled model has been established. Two typical real-world running condition have been extracted according to big data, namely urban running condition and highway running condition. With the real-world running condition fed into the platform, the analysis of BEV driving range can be extended from CLTC at normal temperature to real-world running condition at various environment temperature. The key conclusion are shown as follows:
The BEV driving range is sensitive to environmental temperature and cabin target temperature. For instance, when the environment temperature drops down to −20°C, the driving range is only 49.1% of that under 20°C. If the target cabin temperature could be decreased from 28°C to 20°C, the driving range could be increased by 4.3%.
The influence of environment temperature on driving range is more significant under urban running condition than highway running condition.
Under cold temperature, the top2 influence factors on driving range are: energy consumption of thermal management system and the reduction of available electrical energy of the battery.
The application of motor waste heat recovery, internal gas recirculation, and heat pump can improve the driving range at −7°C under urban running condition by 10.3% in total, with 3.5%, 2.9%, and 3.9% each. The overall benefit has been experimentally confirmed with these three approaches implemented onto the test vehicle.
Footnotes
Appendix
Handling Editor: Sharmili Pandian
Declaration of conflicting interests
The author(s) declared no potential conflicts of interest with respect to the research, authorship, and/or publication of this article.
Funding
The author(s) received no financial support for the research, authorship, and/or publication of this article.