
Abstract
The effect of cold temperature on Electric Vehicle (EV) was investigated on an A class sedan through theoretical and experimental tests. Under cold weather, the drive range was reduced by 42.8% due to reasons such as the energy consumption of cabin heating, the reduction of electric energy capacity of battery and a reduction of efficiency of Electric Drive System (EDS). The cabin heating system is the biggest contributor for the reduction of drive range under cold temperature. Unlike the conventional vehicle where the engine waste heat is recycled, a Positive Temperature Coefficient (PTC) heater which directly withdraws electric energy from battery is used as the heat source for EV. This results in a reduction of EV range. Two approaches that can reduce the energy consumption of cabin heating system were investigated, namely the adoption of Intelligent Air Recirculation (IAR) and Heat Pump (HP). IAR and HP brought an increase of EV range under −7°C NEDC by 7.1%–7.9%, respectively. Another factor that causes range reduction is the deterioration of electric energy capacity of battery. To mitigate this adverse influence, research was conducted on two approaches: Motor Heat Recycle System (MHRS) and Active Motor Heat Control (AMHC). The adoption of MHRS system could improve the EV range by 7.9% while AMHC yielded an improvement of range by 2.1%. When the temperature decreases, the system efficiency of EDS decreases. One reason is the increase of oil splash loss as the oil viscosity increases under cold temperature. Hence, one type of oil with lower viscosity was tested and the results showed that the EDS efficiency could be improved by 1.5% which accounted for a 2.2% increase in driving range. With these measures implemented onto the test vehicle, the EV range under cold temperature −7°C NEDC could be improved by 26.5%.
Keywords
Introduction
Background
For conventional vehicle, 30% of the fuel energy is rejected to the coolant which is the heat source to warm up the air entering the cabin. Therefore, there is no extra fuel consumption caused by cabin heating. However, for EV, a PTC heater which withdraws energy directly from the propulsion battery is used to warm up the air going into the cabin. The battery cell activity is retarded under cold temperature, which leads to a reduction in available electric energy capacity of the battery. In addition, low temperature effectively raises lubricant viscosity, which contributes to a decrease in EDS efficiency. Conclusively, these factors result in a reduction in EV range under cold condition and will be studied in details in following sections.
Six electric vehicles from three Original Equipment Manufacturers (OEMs) have been tested on the chassis dynamometer. At first, tests were conducted at ambient temperature of 25°C, then repeated at −7°C. The results showed that driving range decreased dramatically under cold temperature and the average rate of reduction was above 40%, illustrated in Figure 1. Market survey has indicated that the range reduction under cold temperature is one of the most concerned issues of the customers. Therefore, the OEMs have committed a great amount of efforts in improving the range reduction under cold temperature.
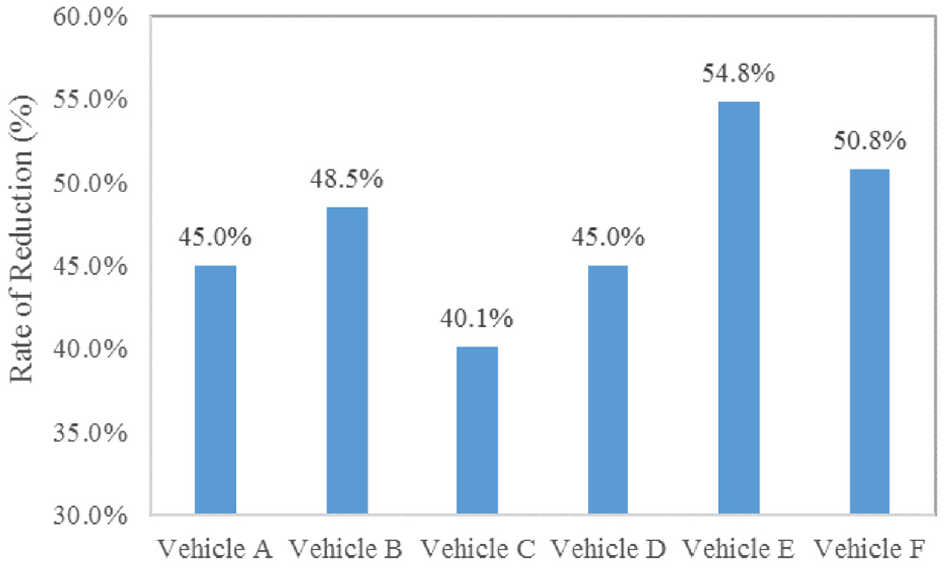
Comparison of rate of range reduction under cold condition.
Literature review
The drive range of EV is sensitive to climate temperature as the range decreases with the environment temperature.1,2 Various researches have been focused on the possibility to extend the drive range of EV under cold temperature.
Under cold temperature, the demand of cabin heating indicates a great amount of heating load for vehicles. Unfortunately, this heating load is satisfied by consuming energy of the propulsion battery for EV, which has adverse effect on the drive range. The higher the cabin heating energy is, the lower the EV drive range will be. One method to reduce the heating energy is to reduce the heating load. Jeffers et al. 3 investigated effect of zone heating strategies of which the intention was to reduce the cabin heating load. A 6.9%–18.7% improvement of EV range under various conditions were reported. This method incurred high control complexity and further analysis on feasibility was needed. Another approach to reduce the cabin heating load was to modify air recirculation configuration.4–6 This approach will be discussed in details in this paper.
Implementing heat pump onto electric vehicle has attracted more and more attention.7–9 The benefit of applying heat pump comes from high COP. For the same heating load, higher COP indicates lower energy consumption. However, limited by the heat transfer capacity of current refrigerant, the performance of heat pump is heavily retarded under extremely cold environment, for example −20°C. To address this issue, new refrigerant such as carbon dioxide has been investigated. Chen et al. 10 reported that the COP of an improved CO2 based heat pump under −20°C could achieve 1.7. Similarly, Wang et al. 11 showed the same COP under −20°C. In addition, the author found that the use of a secondary loop could increase the COP by 19%.
For EV, the battery is the sole power source, hence the performance of the battery dictates the performance of EV under cold climate. In general, there are three means of battery thermal management, namely battery heat preservation, liquid based battery heating and self-heating.
In terms of heat preservation, Phase Change Material (PCM) attracts more and more attention as it helps to reserve heat in the form of latent heat. A simulation model in order to evaluate the heating performance of PCM was developed. 12 For the same temperature rise, the heating time for PCM is more than four times faster compared to air heating. Huo and Rao 13 investigated the effect of thermal conductivity, latent heat and environmental temperature on the impact of PCM and concluded that increasing the latent heat was the best way to preserve heat at low temperature. Ling et al. 14 found that high thermal conductivity of PCM was predominant regarding achieving a uniform temperature distribution in order to improve the consistency of the battery performance.
Liquid based battery heating has become the most popular method of battery thermal management due to higher heat transfer and better compactness.15,16 The principle of battery self-heating is that inner resistance of battery increases dramatically as environmental temperature decreases. Therefore, when current passes through the battery, heat dissipation is significant under cold temperatures, thus raising the battery temperature. Various research has been carried out to examine the influence of current control strategy of battery self-heating.17–20 A rate of temperature rise of 7–10°C/min of the battery cell under −20°C environment temperature.
Methodology
A Changan A class sedan EV, revealed in Figure 2, was adopted to carry out research by applying different approaches aiming to improve drive range under cold temperature. Both simulation and experiment analysis were conducted.

The test vehicle (Changan A class sedan).
The simulation model was established in SIMULINK and the key components of EV such as battery, EDS and air conditioner have been developed in the model. The physical characteristics and performance of each component was modelled based on both mathematical equations and calibration data. Different running conditions including New European Drive Cycle (NEDC), Worldwide Harmonised Light Duty Vehicle Test Cycle (WLTC) and Chinese Light Duty Vehicle Test Cycle (CLTC) could be selected.
Experimental tests were carried out on chassis dynamometer which was located within a climate chamber. A set of testing facilities were used to measure the voltage, current, temperature, speed and torque and the technical specifications were shown in Appendix. Throughout the research work, NEDC was chosen as the running condition and the environment temperature was controlled to be within −7°C ± 3°C which indicated cold environment. The air conditioner was set to be heating mode and the cabin temperature was controlled to be between 20°C and 22°C. Before each test, the vehicle is fully charged then soaked for 12 h under −7°C ± 3°C. The test aborted when the vehicle speed could not follow the target speed prescribed in NEDC.
A case study was carried out onto the test vehicle to explore the influence of each factor on range reduction under cold temperature. The baseline test was conducted at 25°C then the same test was repeated at −7°C. Voltage and current was recorded throughout the test at different locations, which made it possible to analyse the distribution of energy flow within the vehicle, hence the contribution of each factor on range reduction. In this paper, different approaches that aimed to improve the drive range under cold temperature were examined. Firstly, the influence of each approach was studied individually. Then all the approaches were integrated on to the test vehicle to evaluate the overall influence.
Results
Case study
A case study was conducted on a Changan A class sedan in order to examine the influence of each factor on range reduction under −7°C NEDC. Two chassis dynamometer tests were carried out in climate chamber. The environment temperature was controlled to be 25°C for the baseline test and −7°C for the comparison test. All the key parameters were recorded throughout the tests, namely the energy consumption of battery, the energy consumption of PTC and the energy consumption of EDS.
The results showed that there was a 42.8% reduction in drive range under −7°C. With these key parameters fed into the simulation model, the contribution of individual parameter to range reduction could be obtained. A roadmap which showed the contribution of each factor on range reduction was shown in Figure 3. As could be seen, the biggest contributor was the energy consumption of cabin heating system. By following the test procedure, PTC ran in full power (5 kW) initially then regulated the power to maintain the targeted cabin temperature, giving an average power of 1.6 kW. This accounted for a reduction of 26.4% in driving range. Another factor was the reduction in available energy capacity of the battery. Compared to 25°C test, the available energy capacity was reduced by 6.8%, which lead to a 6.8% reduction in drive range. By measuring the electric power at the EDS controller and the mechanical power at output shaft of EDS, the EDS efficiency could be obtained. In comparison to 25°C test, there was a 4.3% reduction in EDS efficiency for −7°C test and this yielded a 6% reduction in drive range. The residual 3.6% reduction in drive range came from the increase in vehicle resistance, which was not within the research scope of this paper.

The roadmap of drive range.
In following sections, approaches that can reduce the energy consumption of cabin heating system, increase the available energy capacity of battery and improve the EDS efficiency will be discussed in detail.
Cabin heating System
As discussed in Introduction Section, six vehicles were tested on chassis dynamometer under cold temperature condition. The average PTC power for those six vehicles over NEDC test was shown in Figure 4. As could be seen, the average PTC power was higher than 1 kW. To investigate the influence of PTC energy consumption on NEDC range, simulation was conducted. As was revealed in Figure 5, an average PTC power of 1 kw could reduce the EV range by 18.1%. If the PTC power reached 2 kW, the average reduction in drive range could be as high as 31.7%.

Comparison of average PTC power over NEDC.

The effect of PTC power on range and energy consumption over NEDC.
In this paper, two different approaches were investigated, namely the application of heat pump and the adoption of IAR. Under the same heating load, the energy consumption of heat pump was less than that of PTC heater as the Coefficient of Performance (COP) of heat pump was normally bigger than 1. The adoption of IAR could effectively reduce the heating load.
Heat pump
Figure 6 revealed the schematics of the heat pump system. For the heat pump system, the heat transfer is achieved via the refrigerant. There are two fluid loops: the refrigerant loop and the coolant loop. The temperature of refrigerant rises rapidly after passing through the compressor. Then heat is transferred from the refrigerant to the coolant in the heat exchanger. When the refrigerant pressure decreases rapidly in the pressure relief valve, the refrigerant temperature drops dramatically. Then the refrigerant absorbs heat from ambient in the evaporator and flows back to the entrance of the compressor. The cold air is heated up by the coolant in the cabin heater. Compared to the traditional PTC system of which the efficiency is always less than 1, the COP of the heat pump system could be greater than 1. Comparison tests were conducted to investigate the difference in energy consumption between PTC system and heat pump system under cold temperature. When the cabin temperature was controlled to be around 21°C, the average power of the PTC system was around 1.6 kW while the average power of the heat pump is around 1.100 (COP = 1.7). This indicates a 31% reduction in energy consumption of cabin heating, hence a 7.9% improvement in driving range.
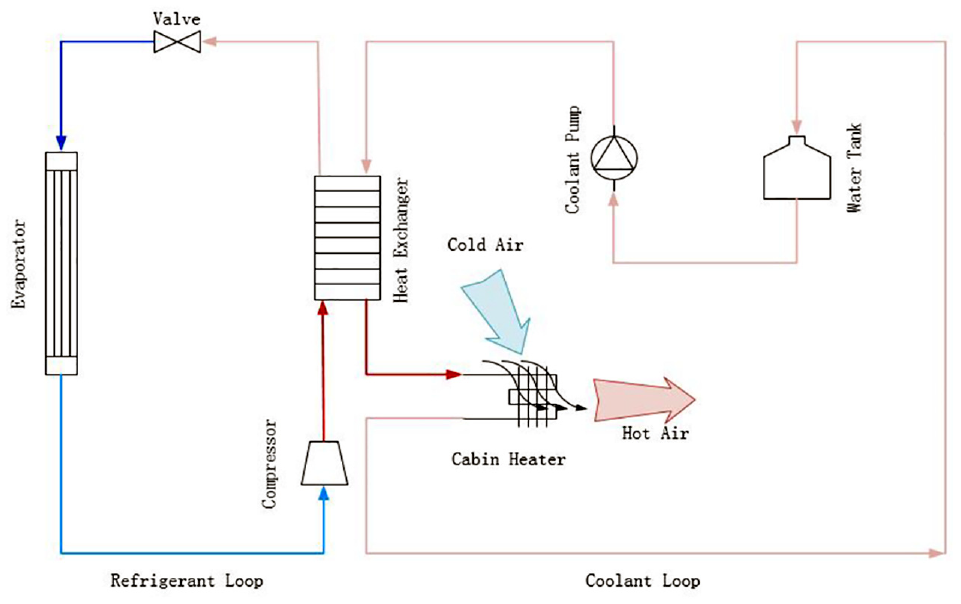
The schematics of heat pump system.
Intelligent air recirculation
In general, there are two modes of air recirculation of the cabin heating system, namely inner recirculation and outer recirculation. Inner recirculation means that air is only circulated within the cabin, hence there is no fresh air of which the temperature is low entering the cabin. Once switching to outer circulation mode, fresh air starts coming into the cabin, which increases the heating load effectively. Equation (1) and (2) reveals the energy balance of the cabin system.


However, the application of inner circulation mode could incur mist on the front windshield, which is hazardous to the driver. Therefore, a smart control of air circulation could not only reduce the heating load but also avoiding mist on the front windshield.
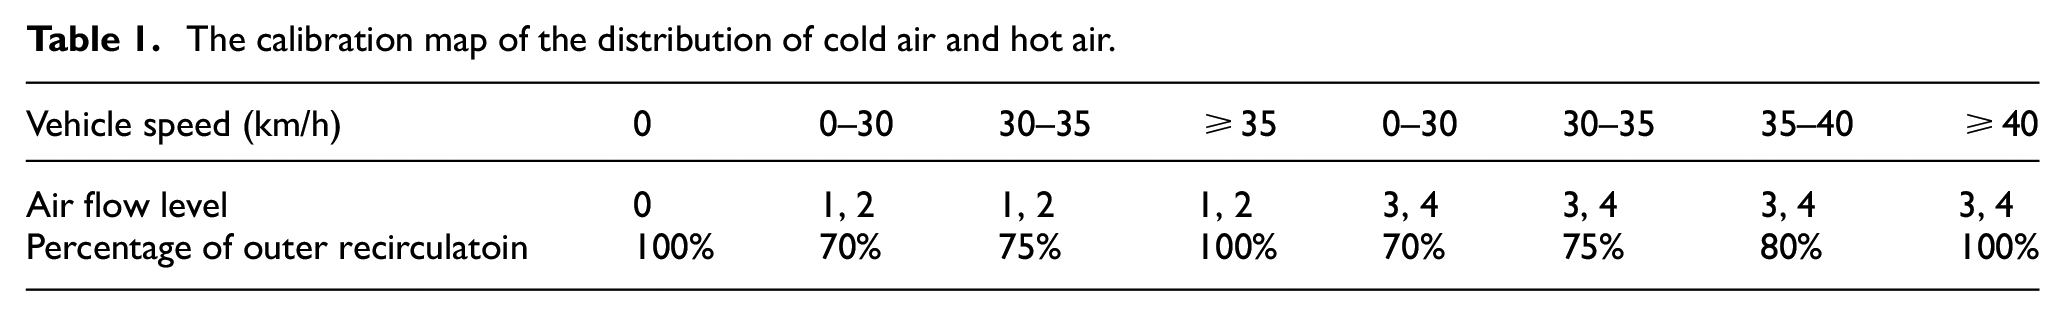
To begin with, under outer circulation mode, cold air and hot air was mixed with a fixed proportion Figure 7 showed the mechanism of how the cold air (blue arrow) and hot air (red arrow) was distributed. The mixture of cold air and hot air was controlled through a control gate. When the gate was fully closed (Figure 7(a)), only cold air was directed into the cabin, which was the case of outer circulation mode. When the gate was fully open (Figure 7(c)), only hot air was circulated within the cabin, which was the case of inner circulation mode. Figure 7(b) revealed the case when the gate was partly open, a mixture of cold and hot air was obtained. The percentage of cold air was dictated by environment temperature, cabin temperature and vehicle speed. A calibration matrix was carried out on the test vehicle in the climate chamber. Table 1 showed the calibration map. As can be seen, a maximum of 30% of hot air could be circulated within the cabin. By applying this calibration map to the test vehicle, the average PTC power under −7°C was reduced by 25%, giving a 7.0% improvement of driving range.

The mechanism of the distribution between cold and hot air, (a) represents the 100% cold air; (b) stands for 30% hot air and 70% cold air; and (c) reveals 100% hot air.
The calibration map of the distribution of cold air and hot air.
Another approach was tested aiming for further improvement. Different from the first approach, the inner circulation was set to be the default mode. A humid sensor was adopted to activate the switch to outer circulation mode when detecting the possibility of mist on the front windshield. This brought a further reduction of PTC power by 10%, which could increase the drive range by 3%.
The efficiency of EDS
Under cold temperature, the efficiency of EDS deteriorates due to the increase of lubricant viscosity. Figure 8 showed the test results of the variation of oil viscosity as temperature changed. As was shown, the viscosity is sensitive to oil temperature. For example, the viscosity at 0°C could be nearly 10 times that at 50°C. Equation (5) 21 revealed an empirical equation used to calculate the oil splash loss. As could be seen, oil splash loss was proportional to oil viscosity. A rise in oil viscosity could increase the oil splash loss, leading to a decrease in EDS efficiency.


The variation of oil viscosity at different temperature.
B stands for the width of the pinion gear, v is the kinetic viscosity, D0 represent the diameter, Rf is the roughness coefficient and ni is the rotational speed.
A pair of comparison tests was carried out to examine the influence of temperature on the efficiency of EDS. The electrical power coming into the EDS was obtained by measuring the voltage and current at the input of EDS while the mechanical power was obtained by measuring the speed and torque at the output of EDS.


The cycle-averaged efficiency was calculated based on the cumulated energy at the EDS input and the cumulated energy at the EDS output, shown in equations (6)–(8) where U, I, T, N represented voltage (V), current (A), torque (Nm) and rotational speed (rpm). Two chassis dynamometer tests were carried out under NEDC running condition, one test under 25°C and the other test under −7°C. The results showed that there was a reduction of EDS efficiency by 4.5% under −7°C compared to that under 25°C.
Given that viscosity played a vital role in EDS efficiency, a low-viscosity oil was tested. In Figure 9, a comparison of viscosity of two types of oil was illustrated. As can be seen, at sub-zero temperature, the viscosity for standard oil (BOT 130 M) could be twice as much as the low-viscosity oil (BOT 351 C4). At first, the −7°C NEDC test was conducted with standard oil then the same test was repeated with low-viscosity oil. A 1.5% improvement of the cycle average efficiency was observed by applying the low-viscosity lubricant, which was equivalent to an improvement of 2.2% in driving range.
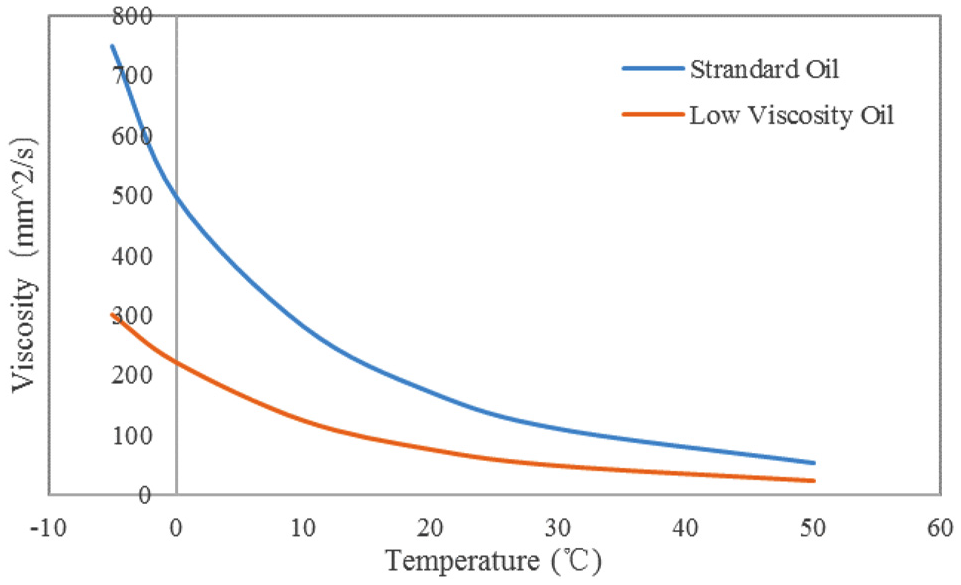
A comparison of viscosity between standard oil and low-viscosity oil.
When changing the standard oil to low viscosity oil, two issues need to be addressed, namely the reliability and the lubrication under higher ambient temperature. Normally, low viscosity oil experiences lower level of tolerance in debris. In addition, if the viscosity is lower than the threshold of boundary lubrication, irreversible damage could occur at rubbing surfaces.
Battery performance
The battery performance heavily relies on the inner chemical reaction which is extremely sensitive to environment temperature. There exists a comfortable temperature zone for battery. If the temperature is below the lower limit, the battery activity is retarded. This will effectively mitigate the available electric energy capacity. Figure 10 showed the test results of the battery voltage-capacity curve under different temperature. The area surrounded by the curve and two axis represented the battery electric energy capacity. As could be seen, the battery electric energy capacity was lower as temperature decreases. Compared to ambient temperature (25°C), the available energy quantity was reduced by 20% at −20°C environment temperature. This is because, in the electrolyte, the resistance for ion migration is higher at lower temperature, which results in fewer ion accumulated at anode. Therefore, the voltage and the available energy quantity is lower.

Battery energy quantity under different temperature.
On the other hand, the charging and discharging power of the battery deteriorates at lower temperature. A Typical battery package was tested under different environment temperature regarding the charging and discharging power, illustrated in Figure 11. Compared to 25°C, the maximum charging power reduced by 42.5% while the maximum discharging power mitigated by 52.2% at 0°C environment temperature. When the environment temperature was down to −20°C, the situation became more severe as the available charging and discharging power was less than 25% of those at 25°C. The deterioration in discharging power adversely influenced the dynamic performance, for example 0–100 km/h acceleration time. It could also reduce the range under NEDC indirectly. When the permitted discharging power was not sufficient to follow the speed pattern, the test aborted. Although the battery was not completely drained, the NEDC range was shortened due to early termination of the test. On the other hand, the capability of energy recovery was limited by the battery charging power, hence the effect of energy recovery could be heavily retarded under cold conditions.

Comparison of charging/discharging power under different power.
In summary, the reduction in battery energy quantity and the permitted charging power influenced the range directly while a decrease in battery discharging power had an effect on EV range indirectly as it resulted in early abortion of NEDC test.
Motor heat recycle system
As described in previous section, battery performance would heavily deteriorate. In this paper, two approaches of battery thermal management were examined, namely MHRS and AMHC.
For the electric driving system, a cooling circuit has been used to absorb the excessive heat from the electric driving system. Normally, the excessive heat has been rejected into the ambient through a dedicated radiator. However, this excessive heat can be redirected into the battery pack in order to raise the battery temperature. Figure 12 illustrates the schematics of MHRS. Red lines represent the motor cooling circuit while the green lines stand for the battery thermal management circuit. Two three-way valves are adopted to connect these two circuits and coolant is considered as the media for heat transfer between these two circuits. Coolant has been heated in the cooling circuit of the EDS and part of the warm coolant can be circulated inside the battery pack.

The schematics of motor heat recovery system.
The test vehicle was equipped with the MHRS. The activation of MHRS was controlled through two three-way valves. Two comparison tests were carried out to address the influence of MHRS on battery temperature as well as the driving range under −7°C NEDC tests. At first, the NEDC test was conducted with MHRS deactivated and the battery temperature settled around 0°C, shown in Figure 13. Then the same test was repeated with MHRS activated and the battery temperature settled around 12°C. As could be seen, with the help of MHRS, the battery temperature could be raised by more than 10°C. This resulted in an increase of driving range under cold temperature by 7.9%.

Effect of PTC heating and MHRS on battery pack temperature under cold temperature.
Active motor heat control
As was discussed in previous section, the application of MHRS could effectively raise the battery temperature, hence increasing the drive range under cold temperature. Here in this section, an innovative approach was investigated. AMHC could be considered as an upgrading version of MHRS. The working principle was to promote heat rejection between electric drive system and the coolant by deliberately lowering the efficiency of the electric drive system. This was achieved by adjusting the control current of the electric drive system. As the efficiency dropped, more energy could be transferred into the coolant of the cooling circuit, thus leading to a higher rate of temperature rise of the battery pack. However, to which extend the efficiency was lowered needed to be taken into account. Although lower efficiency brought in higher rate of temperature rise of battery, it was disadvantageous in terms of energy consumption of the vehicle.
At first, simulation was adopted to seek for a suitable control strategy. A simulation matrix was used, including three levels of efficiency and three levels of control strategy. Three levels of efficiency were: (1) 96% of the baseline efficiency, (2) 92% of the baseline efficiency and (3) 88% of the baseline efficiency. There were three control strategies: (1) lowering the efficiency throughout the test, (2) lowering the efficiency in order to achieve a target battery temperature and (3) lowering the efficiency at specific SOC stages. The simulation results were shown in Table 2.
Simulation results on the influence of different control strategies on the driving range under −7°C NEDC.

According to the simulation results, when lowering the EDS efficiency by 4% at 40% SOC, the driving range under −7°C NEDC could be increased by 10 km. This control strategy was applied onto the test vehicle and the test results were revealed in Figures 14 and 15. As was shown, when the AMHC was activated, there was a rapid rise of both coolant and battery temperature. The application of AMHC could increase the battery temperature by 3°C–4°C, which lead to an increase of battery electric energy capacity of 1.4 kWh and the driving range by 5.8 km. The benefit indicated via experimental was less than that from the simulation. This was due to the discrepancy between simulation and experimental parameters.

Influence of AMHC on coolant temperature.
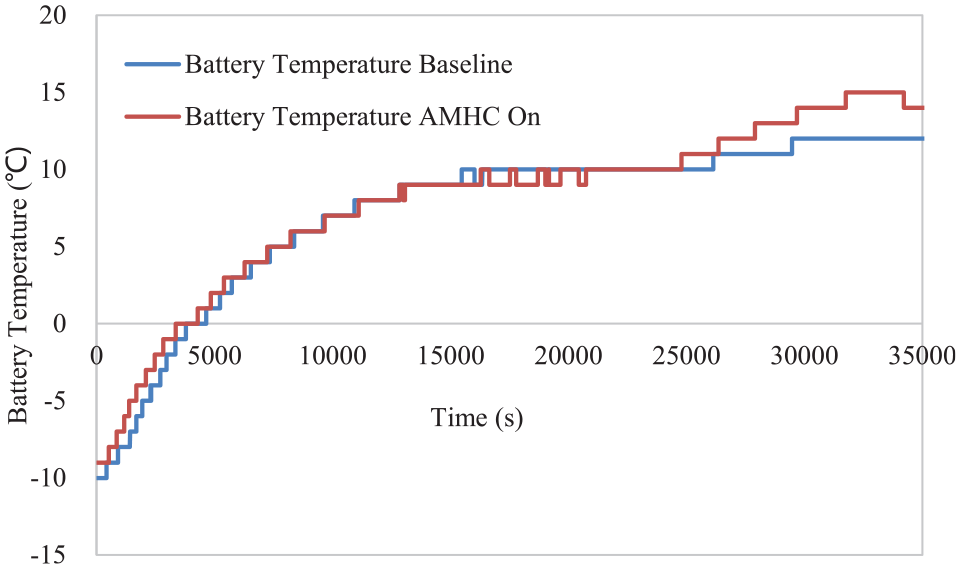
Influence of AMHC on battery temperature.
Technology integration
Previously, the impact of individual approach was studied. Here in this section, the benefits coming from those approaches were investigated both computationally and experimental. At first, a NEDC tests under −7°C was conducted onto the test vehicle (configuration #1), which was considered as the baseline. Then all the approaches discussed previously were implemented onto the test vehicle (configuration #2) and a NEDC test under cold temperature was repeated. In Table 3, the comparison of these two configuration was illustrated.
Comparison of two configurations.

Simulation results showed that there was a 26.5% increase in driving range. According to the test result, an increase in driving range of 29% was observed, which agreed well with the simulation. Figure 16 showed the roadmap which revealed the impact of individual approach. The application of heat pump accounted for the biggest benefit.

The roadmap of range increase caused by different approaches.
Discussion
As has been discussed previously, there exists a dramatic reduction of EV range under cold temperature, which accounts for one of the top concerns from customers. This is due to the energy consumption of cabin heating system, decrease of electric energy capacity of battery and the decrease of the efficiency of EDS.
With regard to the cabin heating system, a significant amount of electric energy is drawn by the PTC heater from the battery, hence reducing the available electric energy for driving. In general, there are two means that can reduce the energy consumption of the cabin heating system, namely improving the system efficiency and reducing the heating load. The application of heat pump is an effective way to improve the system efficiency as the COP is around 1.5–2. Specifically, the heat pump under investigation applies indirect heat transfer, indicating that coolant is adopted as the heat transfer medium between the refrigerant and the air entering the cabin. As the thermal capacity of coolant is high, it is easy to maintain the coolant within a certain range, which is helpful in terms of cabin temperature control. However, the drawback is that the efficiency is sacrificed as there are two stages of heat transfer. To tackle this, a heat pump with direct heat transfer has been proposed where heat is directly transferred between refrigerant and the air in the heat exchanger. The challenge is to accurately control the cabin temperature. Currently, heat hump has only been applied by premium cars due to its relatively higher cost.
Apart from the IAR, dedicated heating is another way to reduce the heating load. The basic idea of dedicated heating is a separation of the cabin. Warm air can be directed deliberately to the areas that influence the sensing of the driver and passengers most through specific nozzles. In addition, thermoelectric material can be located under the seat to supply heat once requested. The utilisation of thermoelectric material could be limited by relatively lower system efficiency, higher control complexity and higher cost.
The activity of battery cell is heavily retarded under cold temperature. Currently, the common solution is to import battery thermal management. The most common way is to apply liquid based battery heating system. A portion of the coolant that has been heated by the PTC heater can be circulated in the channels inside the battery pack, which will effectively raise the battery temperature. As mentioned in this paper, MHRS and AMHC can also be used to heat up the battery. Another approach of battery thermal management is direct refrigerant based heating, of which the efficiency of heat transfer is higher but the complexity of control and manufacturing is higher.
Conclusion
Simulation and experimental investigations have been carried out to examine the impact of cold weather on EV range. The key conclusions are shown as follows:
EV range decreases under cold temperature due to several reasons: the energy consumption of the cabin heating system, a deterioration in battery performance and a reduction in powertrain system efficiency. Among these factors, the cabin heating system accounts for the biggest contributor for range reduction under cold temperature, followed by the deterioration in battery performance.
Two approaches aiming to reduce the energy consumption of the cabin heating system were studied in this paper. The application of heat pump could effectively reduce the energy consumption by 30.8% and increase the range by 7.9% under −7°C NEDC while the introduction of IAR could bring in a 7.1% improvement in driving range.
In terms of battery thermal management, MHRS and AMHC were investigated and they resulted in an improvement of driving range under −7°C NEDC by % and 2.1%, respectively.
Oil viscosity increases as temperature drops, and this would increase oil splash loss, which will decrease the efficiency of the EDS. The application of low viscosity oil could increase the driving range by 2.2%.
When integrating the heat pump, IAR, MHRS, AMHC and low viscosity oil onto the test vehicle, the driving range under −7°C NEDC could be increased by 29% in total.
Footnotes
Appendix
Acknowledgements
This work was carried out as part of a research project which was partly funded by Bureau of Science and Technology of Chongqing with consortium partners Chongqing University and Chongqing Transportation University.
Handling Editor: Chenhui Liang
Author contributions
Chen Zhao: In charge of conceptualisation proposal, methodology design, results verification and paper writing. Yucheng Li: Carrying out simulation and assisting in draft writing. Yun Yang: Analysing simulation and experimental results. Song Wan: Assisting in simulation and responsible for literature review. Fuyong Yu: Carrying out experimental tests and results analysis. Cheng Yu: Preparing the test rig and data acquisition system and assisting in editing. Chenghao Deng: Preparing the test rig and data acquisition system. Anjian Zhou: Editing the draft. Xiaoyi Shen: Carrying out experimental tests.
Declaration of conflicting interests
The author(s) declared no potential conflicts of interest with respect to the research, authorship, and/or publication of this article.
Funding
The author(s) disclosed receipt of the following financial support for the research, authorship, and/or publication of this article: This work was carried out as part of a research project which was partly funded by Bureau of Science and Technology of Chongqing.