
Abstract
In this article, an approach of driving cycle generation for battery electric vehicle is proposed based on genetic ant colony algorithm. The real-world traffic information is utilized to build up a local driving cycle database, in which definitions of the short trip and kinematic characteristic parameters are discussed to describe the driving cycle. A method of principal component analysis is taken as a preprocessor for reducing the dimension of driving cycle data. And then, genetic ant colony algorithm is used to classify the type of short trips and generate the driving cycle. The experimental results on board indicate that, compared with the Economic Commission for Europe driving cycle, the error of driving range and characteristic parameters tested by genetic ant colony driving cycle are reduced by 18.1% and 18.3%, respectively. Therefore, genetic ant colony driving cycle is a good candidate to test driving range of battery electric vehicle.
Keywords
Introduction
The problem that battery electric vehicle (BEV) cannot reach the nominal driving range has been discovered by consumers. Some negative discussions about the real range of battery electric vehicles have also appeared in public, which have aroused extensive attention of many automobile companies. A typical reason for this problem is that the current test driving cycle cannot exactly match the real-world traffic conditions.
Driving cycle is a simulation of speed and time profile, which is used to describe the characteristics of a vehicle in a specific region or traffic condition.1–3 As an important common technology in the automotive industry, driving cycle is the basis of vehicle energy consumption calculation, emission testing methods and limits standards determination.4,5 Its main purpose is to determine technical development and evaluation of new models 6 and to ascertain the risk of traffic control. 7
The typical driving cycle could reflect driving conditions, which provides reliable results in energy consumption, emission certification, and assessment measurement. However, depending on the road conditions, traffic laws, and drivers, there may be a large difference in the customs and driving conditions of different regions. Ericsson compared driving patterns of different road types, drivers, and traffic conditions. They found these factors had a significant impact on the parameters. 8
At the beginning of this century, China adopted the New European Driving Cycle (NEDC) and Economic Commission for Europe (ECE), low- and medium-speed parts of NEDC, to certify energy consumption and emission of vehicles in comprehensive condition and urban condition, respectively. However, with the rapid growth of vehicle ownership, traffic situation has changed greatly in China. All these factors above result in the different energy consumption between the theory and the real-world. On the other hand, since 2001, the Chinese government has strongly encouraged the research of new energy vehicles (NEVs). Under the incentive of numerous policies, the market demand of NEVs in China is also increasing rapidly. In 2018, the sales of NEVs reached 1.256 million in China, which is one of the largest NEV markets in the world. However, with the increase of NEVs, the problem of insufficient driving range is exposed. According to the Analysis of Complaints of Automobile Products Accepted of China in 2018, published by the Consumer Association of China, driving range of NEVs is one of the most common complaints from consumers, which indicates that the energy consumption under the current driving cycle has been seriously out of line with actual energy consumption, and vehicle companies have to do technological planning and development around NEDC on their products.
Researchers around the world have provided many methods for the generation of driving cycles. Galgamuwa et al. used nodes to minimize the number of strokes needed to collect the data by the method of Markov chain, which improved the original model for route selection. And this method provides an economical and practical way to build conditions for developing countries. 3 Some researchers regard driving cycle as a stochastic process of vehicle speed. Based on the similarity criterion of amplitude–frequency characteristics between experimental road and actual road, the realization of random speed process is obtained and analyzed through testing the amplitude–frequency characteristics of FTP-75 by Chłopek. 9 Berzi et al. carried out data acquisition of epilepsy monitoring units (EMUs) by the non-intrusive data recording system. After the process of acquisition, the time–speed data sequence is filtered and grouped, and then a driving cycle is obtained by pseudo-random selection. The similarity between the constructed driving cycle and the collected data is verified by driving cycle parameters. The energy consumption of new driving cycles is compared with that of current driving cycles. 10 He et al. proposed a method for constructing highway velocity segment database based on different types of roads in California; the time traffic information tensor model analyzes the correlation of speed in the time dimension and the spatial dimension. According to the average speed of the segments in different periods, the short trips are randomly selected in the velocity segment database to generate the real-time driving cycles of each segment. 11 Some researchers regard the driving cycle as a similar speed-time profile simulating. Nyberg et al. developed a method based on the definition of driving cycle equivalence. Based on this definition, a set of algorithms are developed to transform a given driving cycle into an equivalent driving cycle or a cycle with a given equivalence measure.12,13
For the generation of driving cycle which suites to the Chinese traffic, China Automotive Technology and Research Center has developed the project of China Automotive Test Cycle since 2015. In addition to the development of EV driving cycle by Chinese officials, many researchers in Chinese academia develop relative projects thoroughly during the last few years. Gong et al. 14 used the Markov chain method to develop the driving cycle for EV of Beijing. A method of generating driving cycle based on distance is proposed by Du et al. Several frequency coefficients defined by observation data are used to represent the primitive driving cycle, and the generated driving cycle can represent random data. 15
However, there are few studies on driving cycle of BEVs. 16 To generate suitable BEV driving cycle for Chinese roads, this article takes urban driving data and proposes a new construction method of driving cycle. It contains two main parts: the establishment of local driving cycle database and the generation of urban driving cycle. First, the local database is established using a historical driving cycle, which is mainly based on the local database. In the part of construction of driving cycle, a reasonable dimension reduction method and an efficient clustering algorithm are adopted. The algorithm of genetic ant colony to generate a driving cycle is the highlight of this article. With this method, the synthetic driving cycle is accordant with the experimental data.
This article is divided into six sections. After a brief introduction in section “Introduction,” the data acquisition process of driving cycle and the method of establishing the driving database in detail are described in section “Data mining approach.” In section “Algorithm design,” the principle of principal component analysis (PCA) and ant colony algorithm (ACA) based on genetic algorithm are introduced. Taking Hefei urban area as an example; the driving cycle of Hefei urban area is generated by the method of PCA and genetic ACA, which is the content of section “Experiment and verification.” In section “Testing results analysis,” the experimental vehicles are used to run the synthetic driving cycle in Hefei and compare the test results with ECE to verify the synthetic driving cycle. Finally, some concluding remarks are summarized in section “Conclusion.”
Data mining approach
This section describes the definition of the short trip, data collection, pre-processing methods, and descriptions of kinematic parameters.
Data acquisition
Hefei is a city with distinct characteristics of mixed traffic and low road network density. Traffic congestion is a serious problem. The selection of appropriate experimental route in Hefei is directly related to the validity of the driving cycle.
Considering the level of road, traffic density, and time factors, this article takes Hefei urban road data as an example, selecting Wuhu Road, Changjiang Road, Jinzhai Road, Tongcheng Road, Tunxi Road, and other typical roads in accordance with the China Urban Traffic Analysis Report published by Amap, 17 for data acquisition. Figure 1 shows the experimental routes. According to the data published by DiDi, which is a mobile transportation platform providing app-based taxi-hailing and big-data services, peak hours in Hefei are 7:00 a.m.–9:00 a.m. and 5:00 p.m.–7:00 p.m. The experiment determined the sampling time at 7:00 a.m.–11:00 a.m. every morning, 3:00 p.m.–7:00 p.m. every afternoon, including peak hours and off-peak hours. Different driving styles bring different results. The conservative drivers, with the low frequency and small amplitudes actions on accelerator and brake pedal, are chosen in the experiment. 18

Experimental routes of urban road.
Some data acquisition tools are shown in Figure 2. The device can record the data of speed and state of charge (SOC) on the controller area network (CAN) in real time, and the messages are saved to the computer in time, with the frequency of 1 Hz.

Data acquisition tools of on-board testing. The left tool is the on-board diagnostics (OBD) port, and the right is the data record device.
Driving cycle database
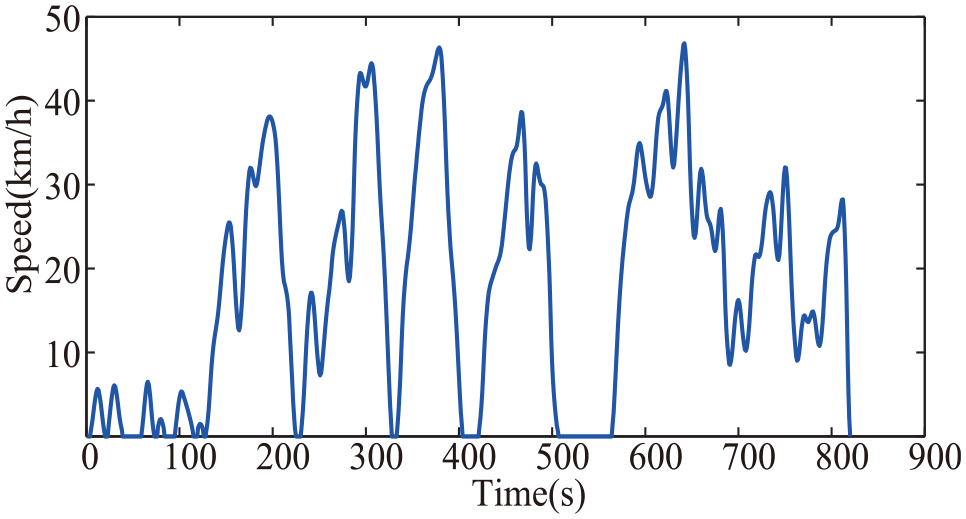
Figure 3 shows a set of collected data. It can be seen that there are several kinematic modes on urban roads, such as cruising, idling, acceleration, and deceleration. In order to describe the process expediently, the whole trip is partitioned into short trips. A short trip is a trip from the beginning of an idling mode to the beginning of the next idling mode. Four modes are defined as follows:
Cruising mode:
Idling mode:
Acceleration mode:
Deceleration mode:
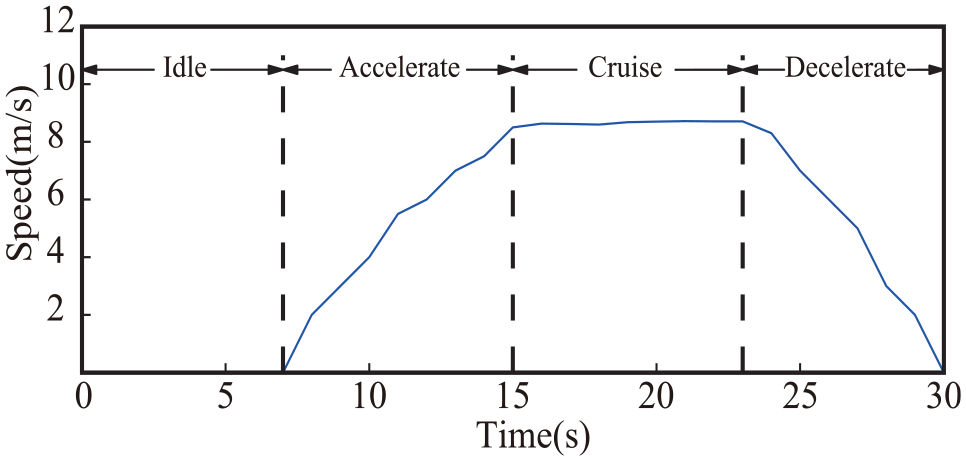
Driving modes of short trip.
A short trip and its driving modes are shown in Figure 3.
Kinematic characterization
Several kinematic characterization is used for accurate description of driving cycle. The parameters used in the characterization should not be too few; otherwise, it will result in the loss of necessary information. Nevertheless, too many parameters may cause needless trouble in calculation. Twelve kinematic characterizations are chosen19,20 such as average velocity, standard deviation of velocity, and proportion of idling time, which are shown in Table 1.
Kinematic parameters.

The time percentage of each mode are computed based on equations (1)–(4)


where
Acceleration calculation uses the worldwide harmonized light duty test cycle (WLTC) cycle calculation formula published on the worldwide harmonized light vehicles test procedure (WLTP) official website
where
Algorithm design
This section explains PCA and genetic ACA in detail and illustrates how they were applied to the generation of driving cycle.
PCA
The PCA is a multivariate statistical method to reduce the dimension of data. By analyzing kinematic parameters of original short trips, a few principal components can be extracted, without loss of important information, so as to simplify the data. The processes are as follows.
First, set up the data with a PCA model. Each row

where vector
In order to eliminate the influence of different dimensions, each variable of the original matrix is standardized and forms a new matrix

Here,
Second, calculate the correlation coefficient matrix

where

Third, compute the eigenvalues and eigenvectors of the matrix. According to determinant
Finally, calculate principal component contribution rate and cumulative contribution rate. The PCA decomposes the total variance of
The value of
ACA
ACA is an algorithm for searching optimized paths and extracting image features. 21 In the ACA, m ants are positioned on a grid element map; each ant builds the shortest path of its tour with randomized search and pheromone communication. The concept of the ACA is briefly described in the following.
Set

For computation simplicity, the probability of ant

where
Each ant leaves a corresponding pheromone on the path which has been visited, after completing a loop. When all the ants complete a loop, the pheromone of each path is updated


Genetic ACA
As an essentially parallel positive feedback algorithm, ACA continuously transmits and exchanges information between individuals, and it is easy to find the optimal solution. However, the basic ACA has some disadvantages: the basic ACA relies on the pheromone concentration guidance and heuristic search to complete the path planning, which increases the computation load of the algorithm. A random path selection strategy will make the path search slow. Pheromone can increase the probability that the better path is selected, but it is easy to cause the algorithm to fall into the local optimal solution and prematurely converge.
In order to solve this problem, the mutation rate in the genetic algorithm can be used to improve the basic ACA. 23 Compared with the basic ACA, the genetic ACA can perform global optimization without stagnation and has strong robustness. Through the research of genetic algorithm and ACA, Xiong et al. 24 found that the two algorithms generally show the speed–time curve in Figure 4 on the solution problem.
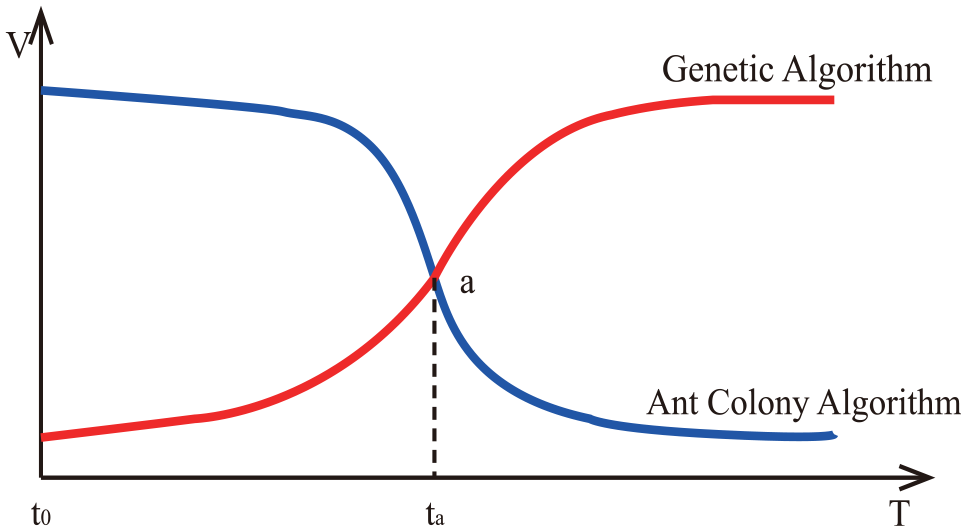
Speed–time curve of genetic algorithm and ant colony algorithm.
In the initial stage of the solution (
This article combines PCA with the genetic ACA to generate a driving cycle. First, add the mutation rate

Flowchart of genetic ant colony algorithm.
Experiment and verification
In this section, it is described in detail how to use the genetic ACA to generate the driving cycle and compare the genetic ant colony driving cycle (GACDC) with the NEDC used in China’s current standards.
Cluster analysis
The short trips and their characteristic parameters obtained in section “Algorithm design” of this article are calculated by PCA. The contribution rate, component matrix, and eigenvalues of each principal component
Eigenvalue and contribution rate.

Principal components.

The eigenvalue is one of the indicators of principal components and indicates the amount of original variable information. If the eigenvalue is greater than 1, it indicates that the explanatory intensity of the principal components is greater than the average explanatory intensity of the original variable.
As can be seen from Table 2 that the eigenvalues of the top four principal components are all greater than 1, but to simplify the calculation, only the top three principal components are selected for analysis. In addition, their cumulative contribution rate is greater than 75%, which is sufficient to describe the characteristics of a short trip. Therefore, the top three principal components can be used for follow-up research.
From Table 3, the principal component score can be calculated. Taking the principal component score

It can be seen from the equation that the principal component score
Short trips obtained in section “Data mining approach” are taken as objects to cluster with genetic ACA, and the score of their top three principal components is shown in Figure 6.

Cluster result of genetic ant colony algorithm.
Short trips obtained in section “Data mining approach” are taken as objects to cluster with genetic ACA, and the score of their top three principal components is shown in Figure 6. Different points represented different short trips. As can be seen from Figure 6, the genetic ACA divides short trips into three clusters with clear categories around their cluster centers. The first cluster included 117 short trips, the second cluster included 98 short trips, and the third cluster included 77 short trips.
GACDC
The short trips are combined into three clusters according to the results of the genetic ACA, some characteristic parameters of each cluster are calculated, and the results are shown in Table 4.
Characteristic parameters of each cluster.
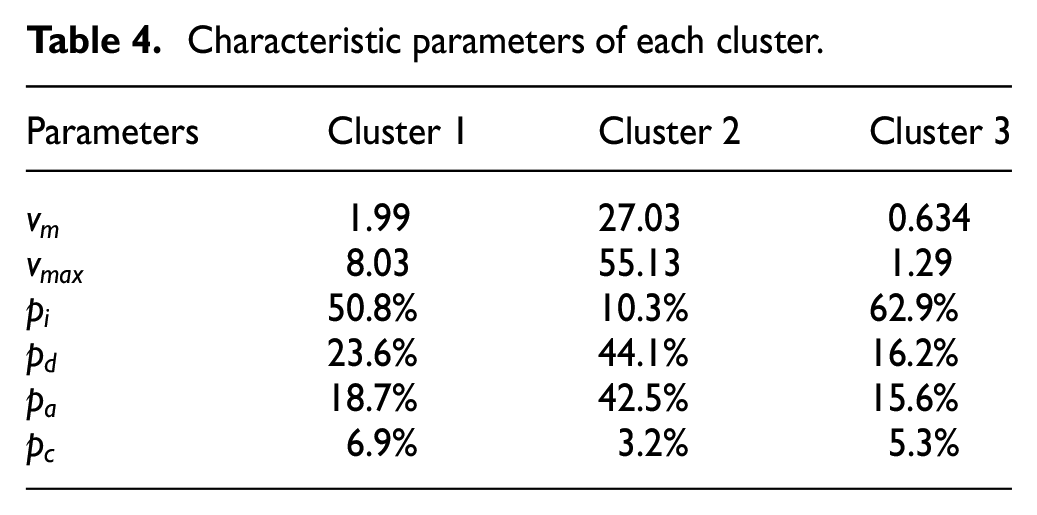
Several conclusions could be drawn from Table 4:
The maximum speed of the kinematics segment cluster 1 is 8.03 km/h, representing the characteristics of large traffic flow and congestion.
The average speed of the kinematics segment cluster 2 is 27.03 km/h, and the maximum speed is 55.13 km/h. This cluster can reflect the traffic flow which is small and smooth.
The maximum speed of cluster 3 is 1.29 km/h. The vehicle is almost stagnant, which illustrated the extreme congestion during peak hours.
Calculate the correlation coefficient

Referring to the length of NEDC and WLTP low- and medium-speed parts, the driving cycle of Hefei urban is set at 900 s. Besides, it is necessary to judge the number of kinematic segments in each cluster, and each kinematic segment cluster represents a type of driving cycle. To determine the number of segments of each cluster, calculating the duration of the ith class is necessary

The
Genetic ant colony driving cycle of Hefei urban.
As can be seen from Figure 7, the total duration of the GACDC is 820 s. Within 0–42 s, the average speed is extremely low, kinematics segment is short, reflecting the road is extremely congested (such as morning and evening peak hours), the vehicle is in idle mode frequently. Within 43–181 s, the average speed is low, reflecting the road is congested (such as in the urban area where the traffic volume is large), the vehicle stops frequent acceleration and deceleration, and on the low speed. Within 182–820 s, the average speed is high, and each kinematic segment is long, reflecting the vehicle on the smooth roads (such as the off-peak period with low traffic flow).
Testing results analysis
In this section, some real vehicle tests are carried out in Hefei urban area, the results of which are compared with ECE to verify the effectiveness of GACDC. The battery electric vehicle for experiment is shown in Figure 8.
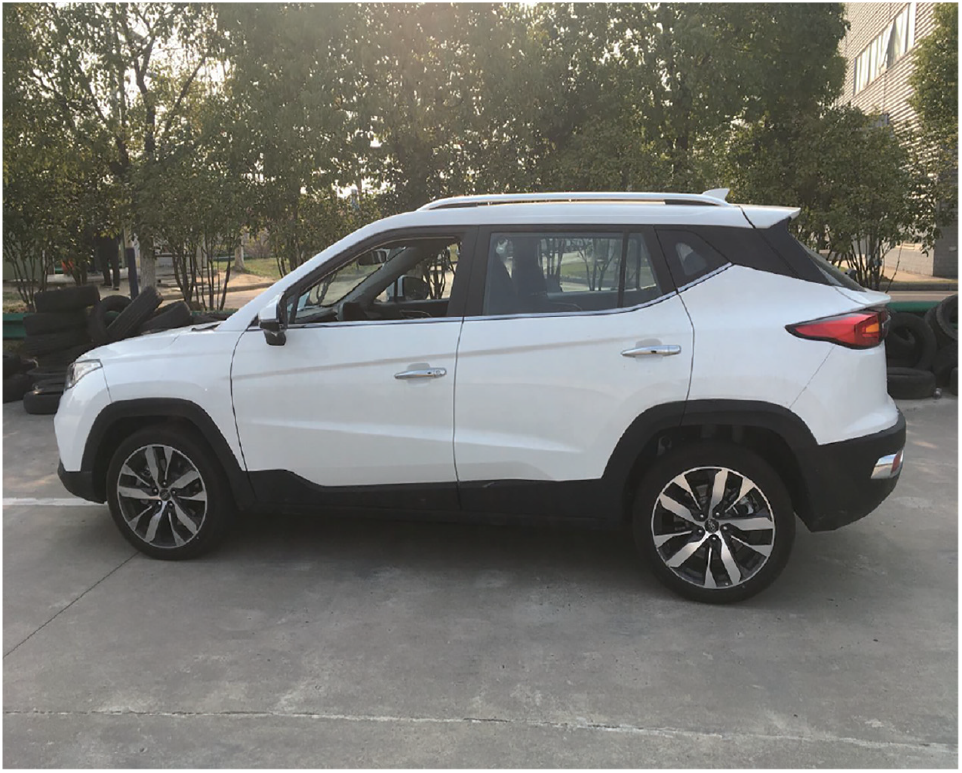
Battery electric vehicle for testing.
The battery electric vehicle parameters are shown in Table 5.
Parameters of the BEV.

BEV: battery electric vehicle.
Several typical roads in Hefei, such as Jinzhai Road, Huizhou Avenue, Tunxi Road, and Changjiang Road, are selected to collect data again, which aims at obtaining a new set of speed and driving range data. Some of the experimental data are sorted out as real-world driving cycle (RWDC) for reference. The experiment time is April, and the air conditioner is in the off state to eliminate the influence. Figure 9 shows the route of the experiment.

The route of RWDC.
To compare the errors between GACDC, Economic Commission for Europe (ECE), low- and medium-speed parts of NEDC, and RWDC,

Here,
Errors of GACDC and ECE.

GACDC: genetic ant colony driving cycle; ECE: Economic Commission for Europe; RWDC: real-world driving cycle.
It can be seen from Table 6 that compared with ECE, the GACDC of Hefei urban has higher similarity with the RWDC. And the average relative error of the driving cycle is 6.7%, which is 18.3% lower than that of ECE.
Driving cycle is one of the standards for the driving range of BEV. In real vehicle tests, the initial SOC is 51%, final SOC is 21%, and the driving range of RWDC, ECE, and GACDC is obtained, which are shown in Table 7. The results demonstrate that the driving range relative error of GACDC is 6.1% and 18.1% less than ECE driving cycle.
The SOC and driving range of driving cycles.

GACDC: genetic ant colony driving cycle; ECE: Economic Commission for Europe; RWDC: real-world driving cycle; SOC: state of charge.
From Figure 10, it can be seen that the driving range of the vehicle tested by the GACDC is closer to the actual driving range than the ECE, which verifies that the GACDC can be utilized to evaluate the driving range of battery electric vehicle.

Test results of driving range compared with GAC and ECE.
These results indicate that compared with the ECE, the GACDC is more appropriate to test the driving range.
Conclusion
In this article, the driving cycle is generated by the method of PCA and genetic ACA, with the driving data of Hefei urban area. This is an efficient and reliable approach that can be used as a reference for testing driving range of battery electric vehicle.
According to the traffic characteristic parameters of Hefei urban area, the improved ACA automatically divides the short trips into three clusters, which correspond to the traffic environment with smooth roads, congested roads, and extremely congested roads. A driving cycle is generated by selecting the appropriate short trips in each group by correlation coefficient and duration of time. The error of driving range and characteristic parameters tested by GAC driving cycle are 18.1% and 18.3% lower than those of ECE; it is verified that the GACDC is appropriate to the actual testing of driving range.
Furthermore, the driving range error of battery electric vehicle has many other factors, such as high-speed driving conditions, temperature, and seasons. If these factors can be considered to generate a driving cycle for testing, it is more benefit to test the driving range.
Footnotes
Handling Editor: Xiaodong Sun
Declaration of conflicting interests
The author(s) declared no potential conflicts of interest with respect to the research, authorship, and/or publication of this article.
Funding
The author(s) disclosed receipt of the following financial support for the research, authorship, and/or publication of this article: This research was funded by the National Natural Science Foundation of China through grant 71431003, the National Key Research and Development Program of China through grant 2017YFB0103104, and Science and Technology Special Project of Anhui Province through grants 16030901030 and 18030901063.